Abstract
Background and Purpose:
Studies looking at seasonal variation on cerebral venous thrombosis (CVT) are few with conflicting conclusions. In this region-specific study, we looked for climatic influence and seasonal trends on the incidence of CVT.
Methods:
Imaging proven adult CVT cases treated over a period of 18 years from a specific geographical location with similar seasons and climatic conditions were studied. Metrological parameters prepared using 30 years of data was used. Quantum geographical information system (QGIS software) and SPSS v 22 were used for patient plotting and analysis.
Results:
Total of 970 cases were studied. The incidence was significantly higher in summer 411 (42.3%) compared with autumn 317 (32.7%) and winter 242 (25.05); P = 0.038. This trend was consistent across all the 18 years in time series analysis. Mean age was 33.5 years (range 18–88 years). A significant majority 673 (69.4%) were below 40 years of age; P = 0.012. Females constituted 394 (40.6%) of cases. Postpartum CVT cases constituted 237 (30%). Interaction analysis showed younger age (<40 years) were more vulnerable for CVT in summer; P = 0.009. There was no seasonal influence on postpartum CVT. Apart for a weak positive correlation between rain fall (r = 0.18, P < 0.01); humidity and cloud cover was not influencing the incidence.
Conclusions:
Higher ambient temperatures were consistently associated with higher incidence of CVT. This is the largest region-specific study on CVT in the world. These results may be applicable to other regions with similar climatic conditions.
Keywords: Ambient temperatures, cerebral venous thrombosis, climate, epidemiology, incidence, season
INTRODUCTION
Cerebral venous thrombosis (CVT) is an important cause of stroke in the young. Being a rare disease, literature on the epidemiological of CVT is scarce.[1]
A cross-sectional epidemiological study performed in the Netherlands[2] had shown an incidence of 1.32/100,000/year, with women between the ages of 31 and 50 years having a higher incidence.
There are many established risk factors for CVT[3]; however studies trying to associate CVT and seasonal variations are few and conflicting. In a study from Iran[4] which looked at 165 CVT admissions over a 10-year period, there was higher incidence in the hot months. A Portuguese[5] study showed peak incidence of the onset of CVT Symptoms in the autumn and winter. In a German cohort,[6] there was a biphasic distribution in the incidence of CVT with peaks both in the summer and winter months.
In this region-specific study, we studied the seasonal and correlation between various climatic parameters on the incidence of CVT over a period of 18 years. Also, we looked at any possible associations between patient characteristics and climatic condition posing a risk for CVT.
METHODS
Study design: This is a retrospective cohort study, conducted at the Christian Medical College, Vellore, a University Teaching Hospital in South India. The study was approved by the college's institutional review board [IRB 11954 (Retro) dated: 27.03.2019]
The setting
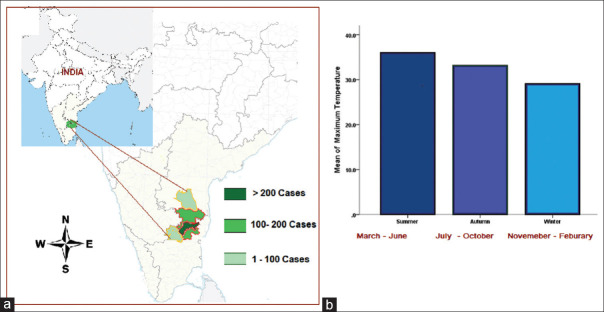
The patients who come to the hospital are mostly from the south and north-east India. For this study, we have taken patients only from the form five adjacent districts of the South Indian sates of Tamil Nadu and Andhra Pradesh with similar climatic conditions [Refer Figure 1a]. These districts include Vellore, Tiruvannamalai, Dharmapuri, and Krishnagiri (Tamil Nadu State) and Cuddapah and Chittoor (Andhra Pradesh State). These districts lie at Longitudes 77.5 0 East and 79.50 East and at Latitudes 11.40 and 15.5 0 North covering an area of 53,205 km2.
Figure 1.
(a) Map of India showing the five adjacent South Indian districts of Tamil Nadu and Andhra Pradesh states where the study was conducted. (b) Bar diagram showing the average mean of maximum temperature of the geographical region during the three seasons
The participants
We included adults (over the age of 18) who were diagnosed based on clinical and radiological features to have CVT between January 2000 and December 2017.
Only patients who were permanent residents of the five districts were considered. Those patients who were residing outside the above geographical when they had their symptom of CVT but had taken residence in it afterward were excluded from the analysis.
The month when the patient had developed their first symptom was taken as the month when CVT occurred in each case. Radiological imaging included contrast computed tomography scan with venogram, magnetic resonance imaging (MRI), and MRI with venogram. Data were obtained from the hospital's electronic medical records and CVT database.
Variables
A database has been maintained for all patients with CVT. Clinical, laboratory, and radiological data are collected. The follow-up of patients after discharge in the out-patients setting is also captured in the hospitals electronic medical records (EMR) and entered into the database.
Daily district wise normal of metrological parameters were provided by the India Meteorological Department National Climate Centre (NCC), Pune, after obtaining the necessary permission to use them for this study. Normal daily district wise data of seven metrological parameters prepared using 30 years of data were provided. The maximum temperature, minimum temperature and mean temperature (In degree Celsius), rainfall in millimeters, relative humidity in percentage, wind speed in kilometer per hour, and total cloud amount in Octas (1/8 of sky cover)
From the daily average values provided, we calculated the monthly minimum and maximum average temperatures, the average rainfall, humidity, and cloud cover for the geographical area under the study.
We divided the year into three seasons based on the mean of maximum temperature [Figure 1b]. March to June (summer), July to October (autumn), and November to February (winter).
Reliability in diagnosis
In order to establish reliability in diagnosis, all cases were checked by a trained neurologists (SA, VM, AS, and ATP) and radiological images reviewed by the radiologist (SNK, PM).
Missing data
Being a retrospective cohort, some of the data from the EMR in the early part of the study period are not very clear regarding the onset of symptoms. Since majority of the CVT cases are of acute or subacute in onset; for these cases, we had taken the month they were first seen in our hospital as the month of occurrence of CVT.
Study size
Being a complete cohort study, we are reporting data on all 970 patients that we had in the study period from the districts studied.
Statistical methods
We performed univariate analysis and the factors that were significant were entered into a regression analysis. The factors that were adjusted for included age, gender, marital status, season, rainfall, humidity, and temperature. Analysis was done with SPSS v 22 for windows. Normally distributed data were described using mean and standard deviation; others using median and interquartile range. All qualitative data were described using number and percentage. The climate data were at or around the time of the CVT.
The geographical distribution of CVT cases were plotted using quantum geographic information system (QGIS software). The district wise south India map was down loaded from the link https://bitterscotch.wordpress.com/2008/06/16/free-vector-outline-district-map-of-india/(Public domain)
Poisson regression and sine and cosine function were used in studying seasonality. Data organization for Poisson regression was done using SAS software and Zero truncated Poisson regression analyses was done as there was zero counts. There was seasonality in the data. The counts (CVT cases) were most common in summer than winter. In order to model the seasonality, we used sine and cosine function. The cosine function finds the amplitude (the maximum observations observed). The linear model Poisson was log linked with sine and cosine then modelled for studying seasonality by using sine and cosine functions in regression analysis. We have used STATA software to analyze these data.
Also, interaction analysis was done for each hypothesized risk variables including season, age, gender, etc., Seasonal trend was done from 2000 to 2017 for summer, autumn, and winter, respectively.
RESULTS
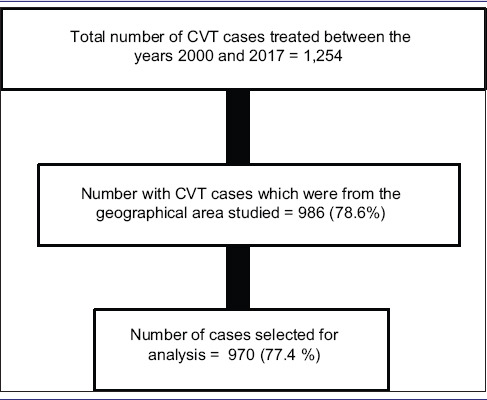
Over a period of 18 years (2000 January to 2017 December), a total of 1,254 cases of CVT were treated [Table 1].
Table 1.
STROBE figure

There were 970 cases fulfilling our criteria from the districts of Vellore (665), Thiruvannamali (129), Chittoor (122), Cuddapah (36), Dharmapuri (14), and Krishnagiri (4)
These 970 CVT cases were part of a total of 7,59,424 cases admitted form the geographical region to the hospital in the 18 year period. Thus, CVT cases contributed to 0.10% of all admissions.
Seasonal influence
Majority of the cases occurred in summer (March to June) with the highest number of cases occurring in the months showing the highest average maximum temperatures [Figure 2a].
Figure 2.
(a) Month-wise distribution of the cerebral venous thrombosis (CVT) cases and the average maximum temperature for each month over the 18-year period. (b) Time series analysis CVT cases by seasons over the 18-year period showing peaks consistently occurring in the summer seasons
This seasonal trend in the incidence was statistically significant with 411 (42.3%) cases occurring in summer compared with autumn 317 (32.7%) and winter 242 (25.05%); P = 0.038.
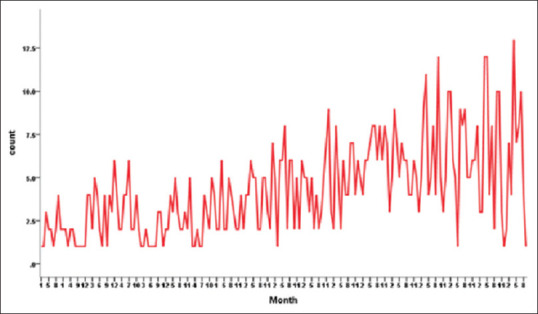
A time series analysis was done to confirm this trend across the 18-year period. This showed consistency both when the time series analysis was done by seasons. [Figure 2b] and also when analyzed by months [Figure 3]. Also, there has been a steady increase in the number of CVT cases treated over the years, which was a reflection of the overall increase in the hospital admissions.
Figure 3.

Time series analysis of CVT cases by months showing peaks occurring consistently in the summer months over 18 years
Age and sex
Men constituted 576 (59.4) of the cases. This gender difference was statistically significant; P < 0.006.
The mean age was 33.5 (range 18–88 years). A significantly higher number of cases 673 (69.4%) were <40 years of age (P = 0.012) [Table 2].
Table 2.
Univarate and multivariate analysis of gender, age, and seasons on the risk for CVT
| Variables | Univariate | Multivariate | |||||
|---|---|---|---|---|---|---|---|
| n (%) | RR | 95% CI | P | RR | 95% CI | P | |
| Age | |||||||
| <40 | 673 (69.4) | 1.2 | 1.2-2.1 | 0.004 | 1.5 | 1.1-2.0 | 0.012 |
| 40-49 | 177 (18.2) | 1.2 | 0.8-1.6 | 0.364 | 1.1 | 0.8-1.5 | 0.540 |
| 50-59 | 74 (7.6) | 1.1 | 0.8-1.6 | 0.680 | 1.0 | 0.7-1.5 | 0.882 |
| ≥60 | 46 (4.7) | 1.0 | 1.0 | ||||
| Gender | |||||||
| Female | 394 (40.6) | 1.3 | 1.1-1.5 | <0.001 | 1.2 | 1.1-1.4 | 0.006 |
| Male | 576 (59.4) | 1.0 | |||||
| Season 3 | |||||||
| Summer | 411 (42.3) | 1.1 | 1.0-1.3 | 0.133 | 1.2 | 1.0-1.4 | 0.038 |
| Autumn | 317 (32.7) | 1.1 | 0.9-1.3 | 0.391 | 1.1 | 0.9-1.3 | 0.284 |
| Winter | 242 (25.0) | 1.0 | 1.0 | ||||
CVT=cerebral venous thrombosis
Females constituted 394 (40.6%) of cases. Postpartum CVT cases constituted 237 (30%) of the total cases studied or 60% of all female CVT cases.
The interaction analyses [Table 3] for age and season showed younger age (<40 years) were at a higher risk for CVT in summer.
Table 3.
Interaction analysis: seasonal influence on gender, postpartum status and age on the CVT risk
| Interaction analysis | OR | 95% CI | P | |
|---|---|---|---|---|
| Gender and Season | ||||
| Female and summer | 233 (24.0%) | 1.41 | 1.11-1.78 | 0.005 |
| Female and autumn | 197 (20.3%) | 1.46 | 1.14-1.86 | 0.002 |
| 145 (14.9%) | ||||
| Female and winter | 1.31 | 1.01-1.70 | 0.039 | |
| Male and summer | 176 (18.1%) | 1.22 | 0.95-1.56 | 0.117 |
| Male and autumn | 120 (12.4%) | 1.02 | 0.78-1.34 | 0.868 |
| Male and winter | 97 (10.0%) | 1.00 | ||
| Postpartum vs Season | ||||
| Postpartum=Yes and Summer | 95 (16.5%) | 1.2 | 0.9,1.6 | 0.340 |
| Postpartum=Yes and Autumn | 73 (12.7%) | 1.1 | 0.9,1.6 | 0.419 |
| Postpartum=Yes and Winter | 69 (12.0%) | 1.1 | 0.8,1.5 | 0.567 |
| Postpartum=No and Summer | 138 (24.0%) | 1.2 | 0.9,1.5 | 0.312 |
| Postpartum=No and Autumn | 125 (21.7%) | 1.2 | 0.9,1.5 | 0.296 |
| Postpartum=No and Winter | 76 (13.2%) | 1.0 | ||
| Age vs Season | ||||
| <40 and Summer | 267 (27.5%) | 1.432 | 1.094,1.87 | 0.009 |
| <40 and Autumn | 230 (23.7%) | 1.323 | 1.006,1.73 | 0.045 |
| <40 and Winter | 176 (18.1%) | 1.217 | 0.917,1.61 | 0.173 |
| ≥40 and Summer | 143 (14.7%) | 1.157 | 0.864,1.54 | 0.328 |
| ≥40 and Autumn | 88 (9.1%) | 1.050 | 0.763,1.44 | 0.764 |
| ≥40 and Winter | 66 (6.8%) | 1.00 | ||
Analyses of gender and season showed women were at risk across seasons. There was no seasonal trend in the occurrence of postpartum CVT cases.
Influence of rain fall, humidity, and cloud cover
The mean rainfall and cloud cover was significantly higher in the autumn months, whereas the mean humidity was higher in the winter [Table 4].
Table 4.
Seasonal differences in the average rain fall, humidity and cloud cover
| Variable | mean±SD | P |
|---|---|---|
| Average rainfall | ||
| Summer | 41.0±25.2 | <0.001 |
| Autumn | 126.4±28.1 | |
| Winter | 53.9±48.0 | |
| Average humidity | ||
| Summer | 58.0±4.7 | <0.001 |
| Autumn | 68.1±4.1 | |
| Winter | 70.2±6.6 | |
| Average cloud cover | ||
| Summer | 3.1±1.1 | <0.001 |
| Autumn | 5.3±0.3 | |
| Winter | 3.5±0.9 |
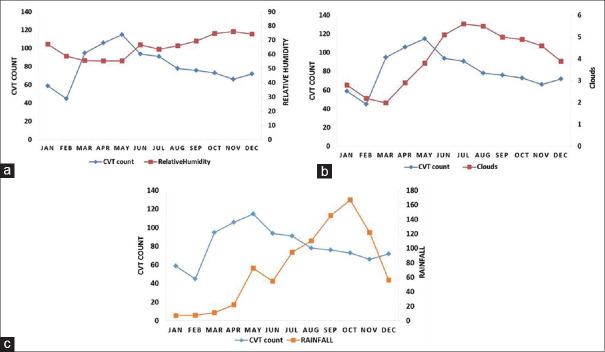
From February till June, the CVT cases increased with an increase in the cloud cover [Figure 4a] and then decreased when the cloud cover decreased. This nonsignificant correlation was seen to continue throughout the year.
Figure 4.
Correlation between the incidence of CVT and (a) average humidity, (b) average cloud cover, and (c) average rainfall
Up to June the relative humidity remained at the same level while CVT counts increased. After June the CVT counts started declining and the relative humidity started increasing mildly. However, after June there is no correlation between the two trends [Figure 4b].
Up to August, there is no correlation between CVT and rain fall [Figure 4c]. After August, there is a weak positive correlation between rain fall and CVT cases (r = 0.18, P < 0.01) with the CVT cases coming down with higher levels of rain fall.
DISCUSSION
In this cohort of CVT patients from South India, we found clear correlation between a rise in the ambient temperature and an increase in the incidence of CVT cases.
Given our large sample size, all patients being from the same geographical region with similar climatic conditions and also the consistency of the correlation over an 18-year period make the results more robust. Our findings were similar to a study from Iran,[4] which however had a much smaller number of cases.
In our study, the majority were males; however, across seasons, the risk of CVT was more in women. The reason for this is not clear. Use of oral contraceptives and other hormonal preparations may be one reason putting females at risk across seasons. The puerperal period is considered as a high-risk period for venous thromboembolic events including CVT. In a study form Mexico, 50% of CVT cases occurred during the pregnancy and puerperium.[7] During pregnancy and the postpartum period; changes in the coagulation system makes the blood hypercoaguable.[8] Volume depletion, dehydration, etc., can potentially worsen this and promote thrombosis. In our series, 237 (56%) were postpartum CVT cases. However there was no correlation between hot seasons and the occurrence of postpartum CVT. This implies that there may be other physiological factors which have a much greater influence on causing postpartum CVT.
A study from the same region[9] had earlier found that a traditional practice of restricting water in the postpartum period can be a modifiable risk factor in postpartum CVT.
In this study, postpartum CVT cases made up for 60% of all female cases. In the interaction analysis, this study also did not shown an increase in the incidence of postpartum CVT in the summer months.
In a 40-year review of all thrombosis using the Danish healthcare and administrative registries, Nils et al.[10] noted that all cases of thrombosis, including 1,118 cases of cerebral vein thrombosis cases was showing a peak during winter or autumn. This increase in thrombotic events was probably attributed to the increase in the incidence of respiratory tract infections in winter causing a prothrombotic tendency.
Studies looking at seasonal variation of occurrence of the more commonly seen deep vein thrombosis and pulmonary embolism are conflicting. A French[11] study noted an increase in confirmed cases of pulmonary embolism and deep venous thrombosis during the autumn and winter, whereas a study from Hong Kong[12] looking at autopsy proven cases of pulmonary thromboembolism showed two peaks: one in early summer and another in early winter. A study from the United States[13] did not show any trend even in the regions where seasons are sharply defined.
Cerebral venous beds and sinuses are different form systemic venous beds. Cerebral veins do not have valves and bidirectional flow is possible; also the walls of cerebral veins are thin and do not contain muscle tissue.
There are studies which have looked at the influence of climate on arterial strokes. In a large meta-analysis of 21 studies, a lower mean ambient temperature was significantly associated with the risk of hemorrhagic strokes.[14] A similar trend was noted in the Intensive Blood Pressure Reduction in Acute Cerebral Haemorrhage Trial (INTERACT2).[15]
In this study, we had also looked at other parameters other than temperature. There was a weak positive correlation with rainfall; however, humidity and cloud cover were not seem to be influence the occurrence of CVT.
INTERPRETATION, GENERALIZABILITY, AND CONCLUSIONS
Higher ambient temperatures were associated with an increase in the incidence of CVT cases. This study should be seen in the context of global environment undergoing profound changes and climate models predicting higher temperatures.[16,17] These data from South India can be applied to countries with hot tropical temperature and may be helpful for public health professionals and epidemiologists in taking appropriate preventive measures for CVT.
Limitations
There will be cases of CVT form these districts that may have been treated in other hospitals; this will not affect the findings of this study; however, due to this, our data do not represent the true incidence or prevalence of CVT of this geographical area.
Financial support and sponsorship
Nil.
Conflicts of interest
There are no conflicts of interest.
Acknowledgements
We wish to thank the patients who contributed to the study, the medical records department as well as India Meteorological Department National Climate Centre (NCC), Pune, India who gave us data.
REFERENCES
- 1.Danwang C, Mazou TN, Tochie JN, Tankeu R, Bigna JJ. Global epidemiology and patterns of cerebral venous thrombosis: A systematic review and meta-analysis protocol. BMJ Open. 2018;8:e019939. doi: 10.1136/bmjopen-2017-019939. [DOI] [PMC free article] [PubMed] [Google Scholar]
- 2.Coutinho JM, Zuurbier SM, Aramideh M, Stam J. The incidence of cerebral venous thrombosis: A cross-sectional study. Stroke. 2012;43:3375–7. doi: 10.1161/STROKEAHA.112.671453. [DOI] [PubMed] [Google Scholar]
- 3.Saadatnia M, Fatehi F, Basiri K, Mousavi SA, Mehr GK. Cerebral venous sinus thrombosis risk factors. Int J Stroke. 2009;4:111–23. doi: 10.1111/j.1747-4949.2009.00260.x. [DOI] [PubMed] [Google Scholar]
- 4.Salehi G, Sarraf P, Fatehi F. Cerebral venous sinus thrombosis may follow a seasonal pattern. J Stroke Cerebrovasc Dis. 2016;25:2838–43. doi: 10.1016/j.jstrokecerebrovasdis.2016.07.045. [DOI] [PubMed] [Google Scholar]
- 5.Ferro JM, Lopes GC, Rosas MJ, Araújo C, Henriques I Venoport Investigators. Chronobiology of cerebral vein and dural sinus thrombosis. Cerebrovasc Dis. 2002;14:265. doi: 10.1159/000065670. [DOI] [PubMed] [Google Scholar]
- 6.Stolz E, Klötzsch C, Rahimi A, Schlachetzki F, Kaps M. Seasonal variations in the incidence of cerebral venous thrombosis. Cerebrovasc Dis. 2003;16:455–6. doi: 10.1159/000072578. author reply 456. [DOI] [PubMed] [Google Scholar]
- 7.Cantú C, Barinagarrementeria F. Cerebral venous thrombosis associated with pregnancy and puerperium. Review of 67 cases. Stroke. 1993;24:1880–4. doi: 10.1161/01.str.24.12.1880. [DOI] [PubMed] [Google Scholar]
- 8.Chandra S, Tripathi AK, Mishra S, Amzarul M, Vaish AK. Physiological changes in hematological parameters during pregnancy. Indian J Hematol Blood Transfus. 2012;28:144–6. doi: 10.1007/s12288-012-0175-6. [DOI] [PMC free article] [PubMed] [Google Scholar]
- 9.Aaron S, Alexander M, Maya T, Mathew V, Goel M, Nair SC, et al. Underlying prothrombotic states in pregnancy associated cerebral venous thrombosis. Neurol India. 2010;58:555–9. doi: 10.4103/0028-3886.68676. [DOI] [PubMed] [Google Scholar]
- 10.Skajaa N, Horváth-Puhó E, Adelborg K, Prandoni P, Rothman KJ, Sørensen HT. Venous thromboembolism in Denmark: Seasonality in occurrence and mortality. TH Open. 2019;3:e171–9. doi: 10.1055/s-0039-1692399. [DOI] [PMC free article] [PubMed] [Google Scholar]
- 11.Ferrari E, Baudouy M, Cerboni P, Tibi T, Guigner A, Leonetti J, et al. Clinical epidemiology of venous thromboembolic disease. Results of a French Multicentre Registry. Eur Heart J. 1997;18:685–91. doi: 10.1093/oxfordjournals.eurheartj.a015316. [DOI] [PubMed] [Google Scholar]
- 12.Chau KY, Yuen ST, Wong MP. Seasonal variation in the necropsy incidence of pulmonary thromboembolism in Hong Kong. J Clin Pathol. 1995;48:578–9. doi: 10.1136/jcp.48.6.578. [DOI] [PMC free article] [PubMed] [Google Scholar]
- 13.Stein PD, Kayali F, Olson RE. Analysis of occurrence of venous thromboembolic disease in the four seasons. Am J Cardiol. 2004;93:511–3. doi: 10.1016/j.amjcard.2003.10.061. [DOI] [PubMed] [Google Scholar]
- 14.Wang X, Cao Y, Hong D, Zheng D, Richtering S, Sandset EC, et al. Ambient temperature and stroke occurrence: A systematic review and meta-analysis. Int J Environ Res Public Health. 2016;13:E698. doi: 10.3390/ijerph13070698. [DOI] [PMC free article] [PubMed] [Google Scholar]
- 15.Zheng D, Arima H, Sato S, Gasparrini A, Heeley E, Delcourt C, et al. Low ambient temperature and intracerebral hemorrhage: The INTERACT2 study. PLoS One. 2016;11:e0149040. doi: 10.1371/journal.pone.0149040. [DOI] [PMC free article] [PubMed] [Google Scholar]
- 16.Duffy PB, Tebaldi C. Increasing prevalence of extreme summer temperatures in the US. Clim Change. 2012;111:487–95. [Google Scholar]
- 17.Ganguly AR, Steinhaeuser K, Erickson DJ, 3rd, Branstetter M, Parish ES, Singh N, et al. Higher trends but larger uncertainty and geographic variability in 21st century temperature and heat waves. Proc Natl Acad Sci U S A. 2009;106:15555–9. doi: 10.1073/pnas.0904495106. [DOI] [PMC free article] [PubMed] [Google Scholar]


