

Abstract
We conducted an inhalation study, in accordance with Organisation for Economic Co-operation and Development Test Guideline 453, exposing A/J mice to tobacco heating system (THS) 2.2 aerosol or 3R4F reference cigarette smoke (CS) for up to 18 months to evaluate chronic toxicity and carcinogenicity. All exposed mice showed lower thymus and spleen weight, blood lymphocyte counts, and serum lipid concentrations than sham mice, most likely because of stress and/or nicotine effects. Unlike THS 2.2 aerosol-exposed mice, CS-exposed mice showed increased heart weight, changes in red blood cell profiles and serum liver function parameters. Similarly, increased pulmonary inflammation, altered lung function, and emphysematous changes were observed only in CS-exposed mice. Histopathological changes in other respiratory tract organs were significantly lower in the THS 2.2 aerosol-exposed groups than in the CS-exposed group. Chronic exposure to THS 2.2 aerosol also did not increase the incidence or multiplicity of bronchioloalveolar adenomas or carcinomas relative to sham, whereas CS exposure did. Male THS 2.2 aerosol-exposed mice had a lower survival rate than sham mice, related to an increased incidence of urogenital issues that appears to be related to congenital factors rather than test item exposure. The lower impact of THS 2.2 aerosol exposure on tumor development and chronic toxicity is consistent with the significantly reduced levels of harmful and potentially harmful constituents in THS 2.2 aerosol relative to CS. The totality of the evidence from this study further supports the risk reduction potential of THS 2.2 for lung diseases in comparison with cigarettes.
Keywords: cigarette smoke, heated tobacco product, mouse, inhalation, chronic toxicity, carcinogenicity
Cigarette smoke (CS) exposure elicits complex biological responses which—if sustained—lead to smoking-related diseases. The strategy of tobacco harm reduction has generated a regulatory and scientific framework for the development and testing of tobacco products that have the potential to reduce the harm or risk of tobacco-related diseases, called modified risk tobacco products (MRTPs; Institute of Medicine, 2012; WHO, 2008). MRTPs aim to provide smokers who would otherwise continue to smoke with novel nicotine-containing products that are substantially less toxic than CS and have the potential to present less risk of harm to smokers who switch to these products versus continued smoking.
One such candidate MRTP is the tobacco heating system (THS) 2.2. (Smith et al., 2016), which has been designed to heat instead of burn tobacco; it consists of a tobacco stick which is inserted into a holder, which heats the tobacco plug to no more than 350°C. The purpose of THS 2.2 is to deliver a nicotine-containing aerosol from tobacco, with significantly reduced levels of the toxicants found in CS. When compared with CS, THS 2.2 aerosol contains significantly lower levels of toxicants, including harmful and potentially harmful constituents (HPHCs) (Mallock et al., 2018; Schaller et al., 2016a,b), and free radicals (Shein and Jeschke, 2019) and no carbon-based solid particles (Pratte et al., 2017, 2018). A series of studies have demonstrated that, relative to CS, THS 2.2 aerosol has significantly reduced cytotoxicity, reduced mutagenic potency in the mouse lymphoma assay, and no mutagenic effect in the Ames assay (Schaller et al., 2016a; Thorne et al., 2018); it also has a reduced biological impact on human 3D organotypic bronchial, small airway, and oral epithelial cultures (Gonzalez-Suarez et al., 2016; Iskandar et al., 2017a,b; Zanetti et al., 2016) and significantly reduced systemic toxicity, lung inflammation, respiratory tract alterations, and disease risk in rodent laboratory models of chronic obstructive pulmonary disease (COPD) and atherosclerosis (Oviedo et al., 2016; Phillips et al., 2016, 2019a; Wong et al., 2016). However, both the systemic effects of chronic exposure to THS 2.2 aerosol and its impact on lung tumor development and on mechanisms linking chronic lung inflammation, emphysema, and lung cancer remain largely unknown.
Because of the long latency period of disease manifestation, classical tobacco product risk evaluation relies on epidemiological studies. Nevertheless, by leveraging a systems toxicology approach, both in vitro and in vivo studies can prove valuable for assessing the effects of candidate MRTPs on key biological mechanisms associated with toxicity and lung carcinogenesis (Hoeng et al., 2019; Smith et al., 2016). Mouse models have been useful for studying the carcinogenicity of chemicals and—in spite of the histological differences between murine and human lung tumors—used to infer the underlying mechanisms of lung tumor development in humans (Akbay and Kim, 2018; Nikitin et al., 2004). The A/J mouse is highly susceptible to lung tumor development and has been widely used as a screening system for carcinogenicity analysis. Past A/J mouse studies have successfully demonstrated the development of lung tumors following mainstream or sidestream CS exposure (Coggins, 1998; Stinn et al., 2005, 2010, 2013a,b; Witschi et al., 2002, 2004). In previous studies, CS-exposed A/J mice showed pronounced lung inflammation accompanied by emphysematous changes, indicating that the A/J mouse is a suitable model for smoking-induced emphysema and might be a useful tool for understanding the molecular changes common to COPD and lung cancer development (Cabanski et al., 2015; Stinn et al., 2013b). Furthermore, the marked differences between lung tumors developing in CS-exposed A/J mice and spontaneously arising tumors could be harnessed to distinguish spontaneous and exposure-related pulmonary neoplasms (Luettich et al., 2014). On the basis of these observations, we consider the A/J mouse a suitable in vivo model of smoking-related lung cancer for comparative assessment of candidate MRTPs and cigarettes.
This study comparatively evaluated the impact of lifetime exposure to THS 2.2 aerosol and mainstream smoke from the 3R4F reference cigarette, a laboratory-use “full flavor”, filtered, American blended cigarette (Roemer et al., 2012), on A/J mice on the basis of Organization for Economic Co-operation and Development (OECD) Test Guideline 453 for combined chronic toxicity/carcinogenicity studies (OECD, 2018b). Although this study evaluated a number of OECD endpoints—including nonrespiratory tract toxicity and carcinogenicity—the effects of chronic exposure on lung tumor incidence and multiplicity, extent of lung inflammation, and emphysematous changes in this mouse strain were central to the evaluation. This publication describes the study design, analytical characterization of selected aerosol constituents in the test atmospheres, biomarkers of exposure in the blood and urine samples of exposed mice, general health conditions of the mice, and histopathological findings of nonrespiratory and respiratory tract organs, including those of nonproliferative and proliferative respiratory tract lesions. The results of extensive omics analyses of nasal and laryngeal epithelia and the lungs collected from mice in this study are reported separately (Titz et al., 2020).
MATERIALS AND METHODS
Study design
This 18-month inhalation study was conducted in compliance with the OECD Principles of Good Laboratory Practice (OECD, 1997) and in basic accordance with OECD Test Guideline 453 (OECD, 2018b).
A total of 263 male and 990 nulliparous and nonpregnant female A/J mice were randomly allocated to 22 experimental groups on the basis of body weight, sex, dissection time points, and treatment using a Provantis v9.3 (Instem, Staffordshire, UK) randomization sequence. Allocation took into account previously observed mortality rates of 58% and 45% for males and 39% and 20% for females in sham and 3R4F High groups (Stinn et al., 2013a), respectively, and the numbers of animals allocated per group for terminal dissection were calculated to ensure at least 50 animals per sex per group at terminal dissection according to OECD Test Guideline 453 (Supplementary Table 1).
The group design for female mice was in alignment with OECD Test Guideline 453. Female mice were exposed to air (sham), 3R4F CS (300 µg/l total particulate matter [TPM], equivalent to 13.4 µg/l nicotine), or one of 3 concentrations of THS 2.2 aerosol (THS 2.2 low [L], medium [M], or high [H], corresponding to 6.7, 13.4, and 26.8 µg/l nicotine, respectively; Figure 1). The nicotine concentration in THS 2.2 (M) was selected to match that in the 3R4F group, an exposure concentration demonstrated to induce a significant increase in lung tumor incidence and multiplicity (Stinn et al., 2013a,b). The group design for male mice deviated from OECD Test Guideline 453 in that they were exposed to fresh air (sham group) or THS 2.2 (H). CS exposure was omitted in male mice because studies have shown that female mice and rats are more sensitive to the toxicological effects of CS than their male counterparts and that CS exposure induces similar lung tumor multiplicity in male and female A/J mice (Stinn et al., 2013a; Vanscheeuwijck et al., 2002). These data from female mice were to be used for comparison with historical data and making inferences regarding tumor incidence and multiplicity in male mice. Furthermore, because THS 2.2 aerosol contains lower levels of HPHCs than CS, as demonstrated by analytical chemistry studies (Mallock et al., 2018; Schaller et al., 2016a), male mice were only exposed to the high dose to demonstrate the sex independence/dependence of tumor incidence and/or chronic toxicity related to THS 2.2 aerosol exposure. The lower number of male than female groups was also in alignment with the principles of the 3Rs—Replacement, Reduction, and Refinement—as stated in the National Advisory Committee For Laboratory Animal Research (NACLAR) Guidelines (NACLAR, 2004).
Figure 1.

Schematic overview of study design, dissection time points, and study endpoints. Female A/J mice were exposed to filtered air (sham), 3R4F CS (13.4 µg/l nicotine), or 3 concentrations of THS 2.2 aerosol (6.7, 13.4, and 26.8 µg/l nicotine). Male mice were exposed to filtered air or THS 2.2 aerosol (26.8 µg/l nicotine). The mice were acclimatized to the facility for 25 days before the start of the study. Interim dissections of subgroups of female mice were performed after 1, 5, and 10 months of exposure. Terminal dissections of male and female mice were performed at months 15 and 18, respectively. At selected time points, the animals were allocated for the following analyses: OECD toxicology endpoint analyses (mortality, hematological analysis, clinical chemistry analysis, urinalysis, etc.), BALF analysis by flow cytometry and multi-analyte (cytokine/chemokine and growth factor) profiling, histopathological evaluation of respiratory and nonrespiratory tract organs, lung function tests, lung morphometry, lung tumor analysis, and extensive systems toxicological analysis (transcriptomics, proteomics, and DNA sequencing). Abbreviations: THS, tobacco heating system; CS, cigarette smoke; OECD, Organization for Economic Co-operation and Development; BALF, bronchoalveolar lavage fluid.
Test item, reference item, test atmosphere generation, and analysis of test atmosphere
The test item, THS 2.2 HeatStick, has been described previously (Smith et al., 2016). 3R4F cigarettes, which were used as the reference, were purchased from the University of Kentucky (University of Kentucky Tobacco Research and Development Center: The Reference Cigarette University of Kentucky, 2003). THS 2.2 HeatSticks and cigarettes were conditioned in accordance with ISO standard 3402 (ISO3402, 1999) before being used for aerosol generation. Mainstream smoke from 3R4F cigarettes and aerosol from THS 2.2 HeatSticks were generated as previously described (Wong et al., 2016).
The test atmosphere in the whole-body exposure chambers was monitored for particle/droplet size distribution and TPM, nicotine, carbon monoxide (CO), formaldehyde, acetaldehyde, and acrolein concentrations as reported previously (Wong et al., 2016). Additional details are provided in Supplementary File 1.
Animals and treatment
Housing and all procedures involving animals were performed in accordance with the approved Institutional Animal Care and Use Committee protocol in a facility licensed by the Agri-Food & Veterinary Authority of Singapore and accredited by the Association for Assessment and Accreditation of Laboratory Animal Care International, where the procedures for care and use of animals for scientific purposes were in accordance with the NACLAR Guidelines (NACLAR, 2004). Inbred male and female A/J mice, bred under maximum hygiene status, were obtained from The Jackson Laboratory (Bar Harbor, Maine). Prior to the start of exposure (day 1), the mice were acclimatized to the facility for 25 days. The mice, 9–11 weeks old, were whole-body exposed to fresh conditioned air, THS 2.2 aerosol, or CS for 6 h/day, 5 days/week, and for up to 18 months. The position of cages within the exposure chamber was changed once per week to exclude the possibility of positional effects on exposure. The animals were adapted to exposure, starting with a 1-h exposure period on day 1, which was extended in increments of 0.5 h/day to the final 6 h/day (day 11). The general condition and health of the mice were monitored daily. Interim dissections of female mice were scheduled at the end of months 1, 5, and 10, and terminal dissections were scheduled at months 15 and 18 for male and female mice, respectively.
Further details on animal husbandry and in-life monitoring are provided in Supplementary File 1; details on group size and group allocation are provided in Supplementary Table 1.
Biomonitoring
Uptake of aerosol components was monitored by quantifying blood and urine biomarkers of exposure (Supplementary File 1).
Necropsy, gross pathology, and organ weight
Organs were collected during scheduled dissections after months 1, 5, 10, and 18 for female mice and at month 15 for male mice according to the organ list recommended in OECD Test Guideline 453 (OECD, 2018b), with the exception of lymph nodes; only bronchial and mediastinal lymph nodes were collected at terminal dissection. These 2 lymph nodes are most closely associated with the respiratory organs, which were expected to be the most affected in this inhalation study. Other deep and peripheral lymph nodes listed in OECD Test Guideline 453 were not examined. Mice that died spontaneously or were euthanized in a moribund state were also necropsied and investigated. The animals were not fasted on the day prior to dissection. They were anesthetized with 100 mg/kg pentobarbital (Jurox, Rutherford, NSW, Australia) via intraperitoneal injection. After blood collection, the animals were exsanguinated via the abdominal aorta. The adrenal glands, brain, heart, kidneys, larynx with trachea, lungs, liver with gallbladder, ovaries, spleen, testes, thymus, and uterus with cervix were weighed. Lung volume measurements were performed by the fluid displacement method (Scherle, 1970) at 20–48 h from the time of instillation with fixative. Histoprocessing details are provided in Supplementary File 1. Group sizes at dissection time points are summarized in Supplementary Table 2.
Hematological analysis, blood flow cytometry, clinical chemistry analysis, and urinalysis
Parameters for assessing systemic effects were selected in accordance with OECD Test Guideline 453 (OECD, 2018b) with slight modifications. Full blood cell count and serum clinical chemistry analysis were performed at all time points for female and at terminal dissection for male mice (see actual group sizes in statistical tables in Supplementary File 4). For blood flow cytometry, blood was collected from male and female animals via the facial vein at months 1, 5, and 10 and from pentobarbital-anesthetized mice via the retro-orbital venous sinus at terminal dissection. Full blood count was determined by using the Sysmex XT2000i system (Sysmex Canada Inc., Mississauga, Canada). Differential white blood cell (WBC) and lymphocyte counts were determined by flow cytometry (FACSCanto, BD Biosciences, Franklin Lakes, New Jersey; Supplementary File 1).
Plasma samples were prepared from blood collected in sodium citrate tubes at terminal dissection and analyzed for prothrombin time (PT) and activated partial thromboplastin time (APTT) by using a Stago STA Compact (Diagnostica Stago, Inc, Parsippany, New Jersey). However, these parameters could not be reliably determined because of the limited volume and frequent clotting of blood samples, and these results are, therefore, not presented here.
Serum samples were collected at terminal dissection in Microtainer SST II tubes (BD Biosciences). Serum clinical chemistry parameters were determined with the UniCel DxC 600i system (Beckman Coulter, Brea, California). In some instances, sample analysis was not possible or data were excluded from analysis because of insufficient volume, blood clotting, or other technical reasons.
Urinalysis parameters measured by the urine dipstick test were confounded by the presence of fecal matter and feed contamination and are, therefore, not shown here. Instead, selected urine clinical chemistry parameters assessed by using the UniCel DxC 600i system (Beckman Coulter) are reported. Bladder stones, if found at necropsy, were analyzed by polarizing light microscopy and infrared spectroscopy by Mount Pleasant Animal Medical Centre Pte Ltd., Singapore.
Lung lavage and analysis
Female animals were subjected to bronchoalveolar lavage (BAL) at months 1 and 5 as described previously (Boué et al., 2013). Cells in the BAL fluid (BALF) were analyzed for free lung cell (FLC) and differential counts by flow cytometry. BALF supernatants were used for multi-analyte profiling, performed by Myriad RBM (Rules Based Medicine, Austin, Texas) by using a multiplexed bead array. They were also used for analyzing gelatinolytic activity by using a commercially available assay kit based on the cleavage of fluorochrome-labeled gelatin (EnzChek Gelatinase/Collagenase Assay Kit; Thermo Fisher Scientific, Singapore). Additional details are provided in Supplementary File 1.
Lung function tests
Female mice were subjected to lung function tests at months 1 and 5. The animals were anesthetized, tracheotomized, and cannulated (Phillips et al., 2015b), with the cannula connected to a computer-controlled small animal ventilator (Scireq, Montreal, Canada). The animals were treated with 0.6 mg/kg rocuronium bromide (MSD, Kenilworth, New Jersey) prior to lung mechanics analysis by using flexiVent FX equipment and Flexiware v7 (Scireq). Multiple perturbation maneuvers were executed, including the deep inflation maneuver (air drawn into the lungs from positive end-expiratory pressure to 30 cm H2O over 3 s), quasi-static pressure-volume [P-V] loops (slow stepwise or continuous inflation to total lung capacity [TLC] and deflation back to functional residual capacity), single compartment model (snapshot maneuver, single frequency of forced oscillation waveform), constant phase model (quick prime-3, multi-frequency forced oscillation waveform), and negative pressure forced expiration (inflation to TLC followed by a rapid switch to negative pressure; SciReq). The perturbations were performed 3 times consecutively per animal to record acceptable measurements (coefficient of determination > 0.95).
Lung morphometry
Emphysematous changes were quantitatively assessed by stereological analysis (Hsia et al., 2010; Ochs and Mühlfeld, 2013) of digitalized images of lung serial sections (left lung; 300 µm sections) by using the Visiopharm Integrator System v4.2.9.0 (Visiopharm, Hoersholm, Denmark). Evaluations were performed on the left lung, which was sectioned at intervals of 300 µm. Lung volume was estimated by the Cavalieri method (Gundersen et al., 1999) by analyzing images of all available serial sections of the lungs at 2× magnification, with 5 × 6 evaluation points per image. All other morphometric endpoints were evaluated in 7–8 serial lung sections. This approach, in addition to random uniform sampling of each lung section, ensures unbiased sampling of the entire lung (Hsia et al., 2010). Endpoints and calculations are discussed in detail in Supplementary File 1.
Histopathological evaluation
Histopathological evaluation of nonrespiratory organs and respiratory organs was performed on glass slides by light microscopy (Zeiss, Oberkochen, Germany) and by using scanned digital slides (Aperio, Haifa, Israel), respectively, with the study pathologist being blinded to the exposure groups. Histopathological findings and their incidences were recorded, and the severity was scored in accordance with a defined severity scale from 0 to 5, with 0 indicating findings within normal limits; 1, minimal changes; 2, minimal to moderate changes; 3, moderate changes; 4, moderate to severe changes; and 5, severe changes. For paired organs, at least one organ had to be valid for histopathological evaluation, and the scores for individual organs as well as the maximum score per organ pair were recorded. In some animals, several nonrespiratory tract organs could not be evaluated because of missing or invalid sections (see Supplementary Table 2 for group sizes at dissection and statistical tables in Supplementary File 4 for actual group sizes).
Pulmonary proliferative lesions were classified in accordance with the International Classification of Rodent Tumors (Dungworth et al., 2001) and International Harmonization of Nomenclature and Diagnostic Criteria (Renne et al., 2009). The size of any proliferative lesion/tumor in the lungs was calculated as the sum of the number of sections needed to transect the individual proliferative lesion/tumor at a 300-µm distance. Computation of the average size of any proliferative lesion/tumor in the lungs per animal excluded animals without proliferative lung lesions/tumors. Computation of the sum of all sizes (tumor load) of any proliferative lesion/tumor in the lungs per animal included data from all valid animals. Lung tumor multiplicity was computed as the total number of proliferative lesions/tumors in the lungs per animal for all evaluated animals (ie, including those not bearing tumors). In some instances, it was not possible to report the lung tumor incidence, multiplicity, and load in an individual animal, or data were excluded because of invalid/missing data from individual lung lobe(s).
There was complete concordance between the study pathologist and the peer review pathologist (Supplementary File 1). In animals that died spontaneously or were declared moribund during the study, the most obvious reasons for death were diagnosed by the study pathologist on the basis of histopathological findings (Supplementary File 1).
Statistical evaluation
Pairwise comparisons of the THS 2.2 groups with the sham and 3R4F groups were performed separately according to sex, dissection time point, and endpoint. Inferential statistics for binary (except mortality), nominal, and ordinal data were analyzed by the Fisher exact, exact chi-square, and Wilcoxon rank sum tests. Continuous data were analyzed by Student’s 2-sample t test with the assumption of nonequal variances (Satterthwaite correction). Inferential statistical tests were 1-sided (lung tumor incidence and multiplicity) or 2-sided (all other endpoints) to allow identification of endpoints for which the THS 2.2 groups were different from the 3R4F group as well as the potential doses at which the THS 2.2 groups started to differ from the sham group. Mortality was computed by using the Kaplan-Meier estimator, excluding replacement animals after study day −1, right-censored technical deaths, and right-censored scheduled dissections; early dissection of male animals was taken into account. Inferential statistics for comparing group survival at the end of the study was performed by the log-rank test. Trend tests for binary and ordinal/continuous were performed by the Cochran-Armitage trend test and Spearman’s rank correlation coefficient analysis. Additional details are provided in Supplementary File 1.
RESULTS
Particle Size Distribution and Analytical Characterization of the Test Atmosphere
Daily monitoring of aerosol components indicated consistent aerosol generation and delivery to the inhalation chambers, with mean nicotine test atmosphere concentrations within ±10% of the target concentrations for the THS 2.2 (L), (M), and (H) and 3R4F groups. Aerosol characterization confirmed less TPM and CO as well as lower formaldehyde, acetaldehyde, and acrolein concentrations in THS 2.2 aerosol than in CS at equal nicotine concentrations (Figure 2), consistent with previous reports (Phillips et al., 2016, 2019a).
Figure 2.

Characterization of test atmosphere in the exposure chambers. Mean nicotine, TPM, CO, formaldehyde, acetaldehyde, and acrolein concentrations in female sham, 3R4F, THS 2.2 (L), THS 2.2 (M), and THS 2.2 (H) and male sham and THS 2.2 (H) chambers are shown. The numbers on top of each bar represent the study mean concentrations, which were derived from the average of daily concentrations. The nicotine concentrations in the sham chambers were below the LOD (= 0.06 µg/L) and were substituted with LOD/2 for tabulating the mean ± SD. The TPM concentration in the sham chamber has a negative value because of the removal of moisture during sampling under slight negative pressure, which caused a decrease in filter weight after sampling. Formaldehyde, acetaldehyde, and acrolein levels in the sham chambers were not quantified because the levels were expected to be very low. All data are provided in a descriptive statistics table in Supplementary File 4. Abbreviations: TPM, total particulate matter; CO, carbon monoxide; L, low; M, medium; H, high; THS, tobacco heating system; LOD, limit of detection; SD, standard deviation.
Analysis of particle/droplet size distributions indicated similar respirable efficiencies for the test atmospheres (Table 1), which were within the specifications defined for uptake and lung deposition (Asgharian et al., 2014; OECD, 2018a).
Table 1.
Particle Size Distribution
| Groups | Female |
Male |
|||||
|---|---|---|---|---|---|---|---|
| Sham | 3R4F | THS (L) | THS (M) | THS (H) | Sham | THS (H) | |
| MMAD (µm) | ND | 0.85 ± 0.011 (78) | 0.73 ± 0.011 (79) | 0.75 ± 0.011 (78) | 0.78 ± 0.011 (78) | ND | 0.77 ± 0.012 (66) |
| GSD | ND | 1.35 ± 0.028 (78) | 1.30 ± 0.034 (79) | 1.26 ± 0.011 (78) | 1.25 ± 0.006 (78) | ND | 1.30 ± 0.031 (66) |
Results shown are mean ± SEM. The number of measurements is shown in parentheses. All data are provided in a descriptive statistics table in Supplementary File 4.
Abbreviations: ND, not determined; MMAD, mass median aerodynamic diameter; GSD, geometric standard deviation; THS, tobacco heating system; L, low; M, medium; H, high; SEM, standard error of the mean.
In-Life Observations
During the study, animals in all groups gained weight progressively. A slight exposure-related decrease in body weight was noted during the first 3 weeks of exposure, although the weight loss during this period was minimal and less pronounced in THS 2.2 aerosol-exposed mice than in CS-exposed mice. After the adaptation period, animals in all groups gained body weight over time throughout the exposure period (Figure 3).
Figure 3.

Body weight progression in the study. Body weight was measured once per week, and the average body weight measurements across the study period are shown for the female (left) and male groups (right). Female mice were scheduled for terminal dissection after day 508, whereas male mice were dissected on day 445. All data are provided in a descriptive statistics table in Supplementary File 4. Abbreviations: THS, tobacco heating system; L, low; M, medium; H, high.
The 3R4F and THS 2.2 test atmospheres were, in general, well tolerated by the mice. A few animals from all exposure groups showed normal grooming behavior and piloerection postexposure. There were no adverse clinical signs in the animals in response to exposure, except for sporadic incidents of transient hypersalivation during the first 2 months of the study and transient mild-to-moderate tremors in a few CS- and THS 2.2 aerosol-exposed mice (Supplementary Table 3).
Food consumption in the female 3R4F and THS 2.2 groups was similar to that in the corresponding sham group, while it was slightly higher in the male THS 2.2 (H) group than in the male sham group. Water consumption was lower in the 3R4F group and higher in the male THS 2.2 group than in the corresponding sham control groups (Supplementary Figure 1).
Ophthalmoscopic examination during the acclimatization period revealed no significant findings. At month 13, all groups showed a low incidence of ophthalmoscopic findings such as cataract and retinal hemorrhage; these were considered incidental or background findings.
Survival Rate and Cause of Death
The mortality rates at months 1 and 5 were low. During the first 6 weeks of the study, 5 female animals (sham group, 2; THS group, 3) that were moribund or found dead showed an enlarged heart; 4 were histopathologically evaluated to confirm dilation of the heart muscle. The mortality rates in male mice increased from month 10 onwards, similar to previous studies (Stinn et al., 2013a). At terminal dissection, the survival rates in the sham and aerosol-exposed female groups were similar (sham, 69.3%; 3R4F, 68.3%; THS 2.2 [L], [M], and [H], 66.0%, 79.1%, and 70.0%, respectively). Male mice had lower survival rates than female mice. Additionally, male THS 2.2 (H) mice had a lower survival rate than sham mice (55.5% vs. 80.5%; Figure 4).
Figure 4.

Kaplan-Meier curves and potential causes of death. Survival estimates over time are presented together with causes of death proposed on the basis of histopathological findings in animals that were moribund or found dead in the histopathological dissection scheme subgroup (Supplementary Tables 5-7). The total number of deaths per group as well as the number of deaths ascribed to individual causes of deaths is indicated in the bar graphs. ***Statistically significant differences between the treatment and sham group at p ≤ 0.001. Abbreviations: THS, tobacco heating system; L, low; M, medium; H, high.
Up to one-third of early deaths (all groups) were of unclear causes owing to the lack of obvious or major histopathological findings. There were no treatment-related differences in the incidence of individual types of neoplasia among early death animals, including male animals; the incidences in the female THS 2.2, sham, and 3R4F groups were similar (Supplementary Table 4). Musculoskeletal-type neoplasia (rhabdomyosarcoma, fibrosarcoma, and undifferentiated sarcoma) was a common cause of death in the study animals independent of exposure group, confirming previous reports of A/J mouse-specific diseases (Sher et al., 2011; Sundberg et al., 2016). Additionally, both musculoskeletal-type neoplasias and squamous cell carcinoma of the nonglandular stomach were observed in the 3R4F and THS 2.2 (L) groups.
Impairment of the urogenital system was a common cause of death in male A/J mice (male sham, 31.8%; male THS 2.2 [H], 41.5%). This finding was related to the presence of struvite uroliths in the urinary bladder and/or specific histopathological findings in the seminal vesicles, urinary bladder, and/or prostate glands (in male mice) or specific histopathological findings in the kidneys, ovaries, and/or uteri (in female mice). Consistent with uroliths and urinary retention, the urinary bladders of the affected animals showed dilatation, transitional cell hyperplasia, epithelial degeneration, and/or presence of mixed inflammatory cells, although the male groups showed no significant increase in severity scores in relation to the treatment. The findings in female animals were incidental or background findings (Supplementary Tables 5 and 6).
Animals with urogenital system impairment frequently had underlying minimal to moderate progressive muscular dystrophy. The incidences of muscular dystrophy as a potential cause of early mortality were 4.5% and 7.3% in the male sham and THS 2.2 (H) groups, respectively. Histopathological findings showed mixed inflammatory cell infiltration and degeneration of muscle fibers (collectively scored as progressive muscle dystrophy) in the musculus rectus abdominis, musculus quadriceps, and/or skeletal muscles. Overall, there was no treatment-related increase in the severity of muscular dystrophy.
The incidence of skin wounds, histopathologically correlated to skin ulceration or chronic inflammation, was 7.3% in the male THS 2.2 (H) group, but it was very low in the female groups and absent in male sham early death animals. The other determined causes of death were of low incidence and likely not related to the treatment (Supplementary Table 7).
Biomonitoring
Consistent with the CO concentrations in the test atmospheres, the average levels of carboxyhemoglobin (COHb) in CS-exposed mice were higher than those in THS 2.2 aerosol-exposed animals and similar in male and female animals exposed to THS 2.2 (H) (Figure 5A). The very low detectable levels of plasma nicotine and cotinine in some sham mice might have originated from sample mix-up in a single case. Given that nicotine is easily adsorbed to surfaces (Ongwandee and Sawanyapanich, 2012; Petrick et al., 2010) and that the animals shared the same anesthesia chamber and were handled by the same personnel on the day of blood collection, it is not possible to exclude cross-contamination of blood samples. The THS 2.2 (M) group showed lower plasma nicotine and cotinine concentrations than the nicotine-matched 3R4F group. In the THS 2.2 (H) group, female mice showed lower plasma nicotine and cotinine concentrations than male mice (Figure 5A). Consistent with the nicotine concentrations in THS 2.2 aerosol, the concentrations of plasma nicotine, plasma cotinine, and urine total nicotine metabolites showed a concentration-dependent increase across the 3 female THS 2.2 groups. The relative proportions of the 5 nicotine metabolites reflected the accumulation of each nicotine metabolite in the urine of the exposed animals. There was no sex-dependent difference in the total daily levels of urinary nicotine metabolites in the THS 2.2 (H) group, indicating comparable nicotine dosing and uptake in the male and female THS 2.2 (H) groups. The total urinary nicotine metabolite levels in the THS 2.2 (M) group were higher than those in the 3R4F group (Figure 5C).
Figure 5.

Quantification of biomarkers of exposure in blood, plasma, and urine. Concentrations of biomarkers of exposure in (A) blood and plasma and (B–D) 24-h urine samples are shown. Blood was collected at the end of daily exposure; COHb was measured at exposure month 12, whereas plasma nicotine and cotinine and urinary biomarkers were analyzed at 15 and 14 months, respectively. Urinary biomarkers of exposure are presented as (B) total levels present in 24-h urine samples, (C) proportions of 5 nicotine metabolites relative to the sum of all nicotine metabolites; and (D) concentrations in 24-h urine. Mean values are indicated as text next to the bars. *, **, and *** represent statistically significant differences between the treatment and sham groups at p ≤ .05, p ≤ .01, and p ≤ .001, respectively. #, ##, and ### represent statistically significant differences between the THS and 3R4F groups at p ≤ .05, p ≤ .01, and p ≤ .001, respectively. All data are provided in a descriptive statistics table in Supplementary File 4. Abbreviations: THS, tobacco heating system; L, low; M, medium; H, high; CEMA, 2-cyanoethylmercapturic acid; HPMA, 3-hydroxypropylmercuric acid; SPMA, S-phenylmercapturic acid; NNAL, 4-(methylnitrosamino)-1-(3-pyridyl)-1-butanol.
In sham animals, the absolute levels of urinary 2-cyanoethylmercapturic acid (CEMA), total 4-(methylnitrosamino)-1-(3-pyridyl)-1-butanol (NNAL), and S-phenylmercapturic acid (SPMA) were very low, although the level of 3-hydroxypropylmercuric acid (HPMA)—which is derived from endogenous acrolein in nonexposed mice and rats (Stevens and Maier, 2008; Zheng et al., 2013)—was slightly elevated. Male sham mice excreted more HPMA than their female counterparts, most likely because of their higher body mass, basal food consumption, and respiratory minute volume (Linhart et al., 1996). Consistent with the exposure type and chemical composition of the aerosol (Schaller et al., 2016a), the urinary levels of CEMA, HPMA, total NNAL, and SPMA in mice exposed to THS 2.2 aerosol were approximately 70-, 7-, 20-, and 40-fold lower, respectively, than those in 3R4F CS mice (Figs. 5B and 5D).
Organ Weights
Overall, there were no clear exposure-related changes in absolute or relative larynx/trachea, lung, and lymph node weights in THS 2.2 aerosol-exposed mice relative to sham mice. The marginal increase in relative larynx/trachea weight in the male THS 2.2 group relative to the sham group was not derived from the increased absolute organ weights and probably resulted from the variance in body weights that were used in the normalization. The bronchial lymph node weight in the male THS 2.2 group was lower than that in the sham group at terminal dissection. The 3R4F CS group showed higher larynx/trachea, lung, and bronchial lymph node weights than the sham group (Figure 6).
Figure 6.
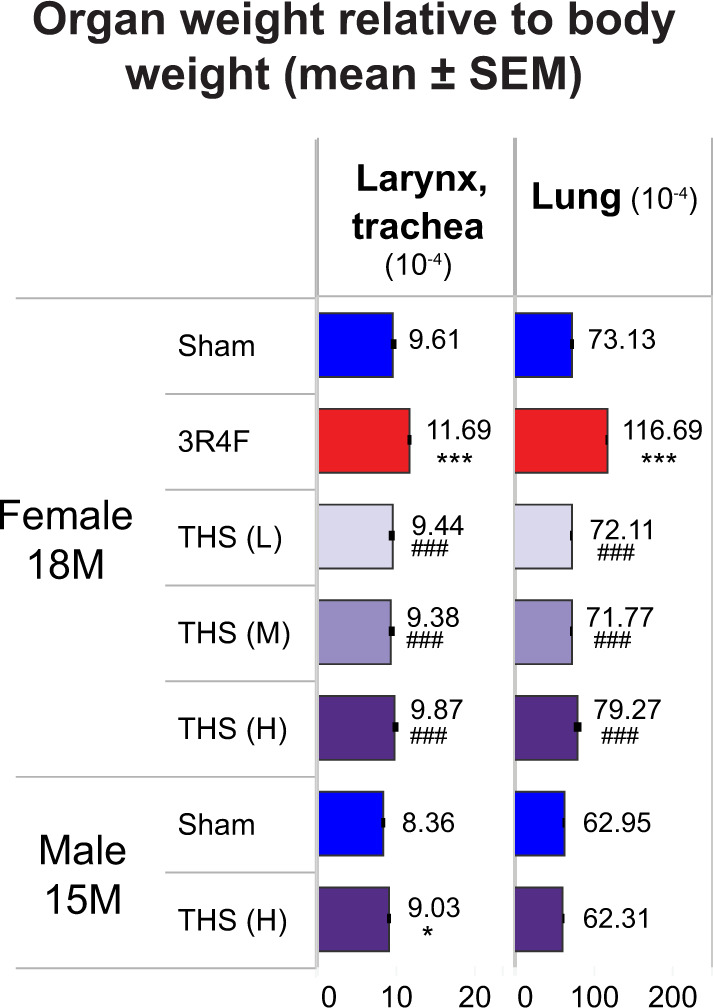
Relative weight of the larynx with the trachea and lungs in female mice at month 18 (18M) and male mice at month 15 (15M). Organ weight expressed as weight relative to the body weight after exsanguination. The numbers shown on top of each bar in the bar graphs represent the mean organ weight. *, **, and *** represent statistically significant differences between the treatment and sham groups at p ≤ .05, p ≤ .01, or p ≤ .001, respectively. #, ##, and ### represent statistically significant differences between the treatment and 3R4F groups at p ≤ .05, p ≤ .01, or p ≤ .001, respectively. All data are provided in a descriptive statistics table in Supplementary File 4. Abbreviations: SEM, standard error of the mean; THS, tobacco heating system; L, low; M, medium; H, High.
The 3R4F and male THS groups showed exposure-induced responses such as decreased thymus and spleen weight relative to the corresponding sham groups. This decrease was related to the more severe thymus involution/atrophy in the CS-exposed animals; however, there was no histopathological correlate to explain the decreased spleen weight in the THS group. The 3R4F and THS groups also showed a marginal decrease in ovary weight; however, the extent of decrease was more obvious in the 3R4F group (Supplementary Figure 1). Despite this decrease, necropsy findings revealed enlarged ovaries in several animals in the sham and THS groups. These were often associated with proliferative and/or cystic changes, which were not significantly different among the groups. Furthermore, the THS 2.2 (H) group showed a marginal increase in adrenal gland (female only) and kidney (male only) weight (Supplementary Figure 1). The increase in relative adrenal gland weight without a corresponding increase in absolute organ weight in the male THS group is likely a body weight effect introduced during normalization. There were no clear exposure-related changes in absolute or relative heart weight in the THS group. The marginal increase in relative heart weight in the male and female THS groups was without a corresponding increase in absolute organ weight and likely due to the variation in body weight values used for normalization. There were no clear treatment-related changes in organ weight in the other examined organs (Supplementary Figure 1).
Hematology and Flow Cytometry
There were no or only subtle changes in erythrocyte count and red blood cell indices in the THS groups. In contrast, CS-exposed female animals had higher erythrocyte count and red blood cell indices than the sham and THS 2.2 groups (Figure 7), consistent with previous findings and most likely because of exposure to high CO levels in CS (Phillips et al., 2015b, 2016).
Figure 7.

Total and differential blood cell counts. Results from hematology analysis by using the Sysmex XT2000i system are shown. Data from female animals were recorded at scheduled dissections at months 1, 5, 10, and 18, and data from male mice were recorded at scheduled dissection at month 15. Flow cytometric quantification of B lymphocyte counts are shown for female animals at months 1, 5, 10, and 18 and for male mice at month 15. *, **, and *** represent statistically significant differences between the treatment and sham groups at p ≤ .05, p ≤ .01, and p ≤ .001, respectively. #, ##, and ### represent statistically significant differences between the THS and 3R4F groups at p ≤ .05, p ≤ .01, and p ≤ .001, respectively. All data are provided in a descriptive statistics table in Supplementary File 4. Abbreviations THS, tobacco heating system; L, low; M, medium; H, high; 1M, 5M, 10M, 15M, 18M: dissection at months 1, 5, 10, 15, and 18.
The female THS 2.2 groups showed no consistent changes in WBC, WBC differential, or platelet counts relative to the sham group across the time points. In correlation with the lower absolute thymus and spleen weight (Supplementary Figure 2), the total WBC and lymphocyte counts were lower in the male THS 2.2 (H) group than in the sham group at terminal dissection (Figure 7). The CS-exposed female group had lower absolute and relative lymphocyte counts than the sham and THS 2.2 groups at months 1 and 5. Additionally, the 3R4F group showed higher absolute and relative neutrophil counts at month 10 and terminal dissection than the sham and THS 2.2 groups (Figure 7).
The leukocyte subtypes in blood were further distinguished by flow cytometric analysis of whole blood collected from the facial vein. The female THS 2.2 (H) group showed a transient decrease in B lymphocyte count relative to the sham group at month 5. The 3R4F group showed consistently lower absolute and relative B lymphocyte counts than the sham group at all time points. This decrease was consistent with the decreased lymphocyte count in the 3R4F group determined by using the automated hematology system (Figure 7). Relative to the sham group, selected female THS 2.2 groups showed transiently higher absolute leukocyte counts at month 1, which coincided with the slightly higher B cell, T cell, CD8+ T cell, CD4+ T cell, neutrophil, and monocyte counts. The THS 2.2 groups showed a concentration-dependent increase in CD4+ and CD8+ lymphocyte counts at month 1. However, in the 3R4F group, the increased neutrophil count determined by automated hematological analysis was not observed upon flow cytometric analysis (Supplementary Table 8).
Serum and Urine Clinical Chemistry Analysis
The female THS 2.2 groups showed no exposure concentration dependency or consistency in changes in liver function parameters relative to the sham group (Figure 8). Where changes were observed in the THS 2.2 groups, the extent of the changes were small and within the normal ranges for this mouse strain (Bogue et al., 2018). In contrast, CS-exposed animals generally (and at multiple dissection time points) exhibited higher serum levels of liver-derived proteins (albumin and total protein) and alkaline phosphatase activity than the sham and THS 2.2 groups. Serum glucose levels were higher in the 3R4F and THS 2.2 (L) and (M) groups at month 5 and in the THS 2.2 (L) group at terminal dissection. These changes appear to have been transient and lacked concentration dependency; they were, therefore, unlikely to be a direct effect of aerosol exposure. Serum cholesterol concentrations were lower in the THS groups than in the sham group (month 5 only) and were also lower in the 3R4F group from month 5 onwards. Triglyceride concentrations were lower at months 1 and 5 in the THS 2.2 (H) group and at month 5 in the 3R4F group (Figure 8).
Figure 8.

Results of serum and urine clinical chemistry analysis. Results of quantification of serum analytes representative of liver function (left panel), metabolic and lipid profiles (top right), and urinalysis (bottom right) are shown. Serum samples were analyzed at months 1, 5, 10, and 18 for female animals and at month 15 for male mice. Urine samples were from 24-h collection from male and female animals at months 10 and 13/14. The numbers shown on top of each bar represent the mean values. *, **, and *** represent statistically significant differences between the treatment and sham groups at p ≤ .05, p ≤ .01, and p ≤ .001, respectively. #, ##, or ### represent statistically significant differences between the THS and 3R4F groups at p ≤ .05, p ≤ .01, and p ≤ .001, respectively. All data are provided in a descriptive statistics table in Supplementary File 4. Abbreviations: THS, tobacco heating system; L, low; M, medium; H, high; 1M, 5M, 10M, 13M, 14M, 15M, and 18M: analysis at the respective months.
For assessing kidney function, selected analytes were measured in the serum of female mice at months 10–11 and in male and female mice at terminal dissection (Supplementary Table 9). The serum creatinine results were inconclusive because the levels were below the quantification limit. The overall assessment did not indicate impairment of kidney function in the 3R4F or THS groups. The increased serum glucose concentrations were likely transient and might have been a consequence of stress and exposure to high nicotine concentrations.
Up to month 10, the average 24-h urine volume collected per group (0.55–0.88 ml, excluding the volume used for flushing) was not significantly different among the groups. At month 14, the average 24-h urine volume (0.29–0.82 ml, excluding the volume used for flushing) was lower in the 3R4F and female THS 2.2 (M) and THS 2.2 (H) groups than in the sham group. There was no difference in urine volume between the 3R4F and THS 2.2 (M) groups. The urine volumes in the female THS 2.2 groups were inversely related to the test atmosphere concentrations of nicotine (Figure 8). Because of contamination of urine samples with feces and food, the results of the routine urine dipstick test were deemed unreliable; instead, we performed urine clinical chemistry analysis focusing on quantification of creatinine and glucose. Urinary creatinine levels, normalized to body weight, were lower in the 3R4F, THS 2.2 (M), and THS 2.2 (H) groups than in the sham group. However, there was no significant difference in this parameter between the nicotine-matched 3R4F and THS 2.2 (M) groups. The female THS groups showed higher urinary glucose levels than the sham group (Figure 8).
BALF Analysis
Female 3R4F CS-exposed mice showed extensive lung inflammation, as evidenced by their higher total FLC counts (at months 1 and 5), inflammatory mediator concentrations (at months 1 and 5), and matrix metalloproteinase (MMP) activity in BALF (at month 5) than those in sham mice. In contrast, the THS 2.2 groups showed no or minimal changes in FLC count, soluble analyte concentrations, and MMP activity in BALF (Figure 9). Of the mediators measured in BALF at month 5, myoglobin was the only analyte that showed a concentration-dependent increase in the THS 2.2 aerosol-exposed groups; in comparison, there was a more than 4-fold increase in BALF myoglobin levels in the 3R4F CS-exposed group. However, the difference in BALF myoglobin levels between the 3R4F and (nicotine concentration matched) THS 2.2 (M) groups was not statistically significant. Furthermore, CS-exposed mice showed increased absolute macrophage, neutrophil, alveolar dendritic cell, total lymphocyte, CD4+ and CD8+ T lymphocyte, and CD3-natural killer cell counts in the BALF, relative to the sham control; however, these changes were not observed in THS 2.2 animals (Figure 9 and Supplementary Table 10).
Figure 9.

Evaluation of BALF and lung inflammation in female animals at months 1 (1M) and 5 (5M). A, Total free lung cell, total lymphocyte, total macrophage, and total neutrophil counts; (B) BALF levels of inflammatory mediators; (C) MMP activity. The numbers shown on top of each bar in the bar graphs represent the mean values. The concentration of BALF inflammatory mediators is shown as fold change relative to the sham group, and the statistical significance and direction of change are color-coded (see legend). *, **, and *** represent statistically significant differences between the treatment and sham groups at p ≤ .05, p ≤ .01, and p ≤ .001, respectively. #, ##, and ### represent statistically significant differences between the treatment and 3R4F groups at p ≤ .05, p ≤ .01, and p ≤ .001, respectively. All data are provided in a descriptive statistics table in Supplementary File 4. Abbreviations BALF, bronchoalveolar lavage fluid; MMP, matrix metalloproteinase; THS, tobacco heating system; L, low; M, medium; H, high; SEM, standard error of the mean.
Lung Function Assessment
A series of lung function tests were performed on female mice at months 1 and 5. In the THS 2.2 groups, quasi-static P-V loops did not show an obvious deflection or increase in lung volume at maximum pressure (30-cm H2O). In contrast, the 3R4F group showed an upward and leftward shift in the P-V loop in both the inflation and deflation phases of the maneuver at months 1 and 5, relative to the sham group (Figure 10). Correspondingly, only the 3R4F group showed increased values for lung volume at maximum pressure, Salazar-Knowles parameters A and B, quasi-static compliance, and area under the P-V loop and decreased values for the Salazar-Knowles parameter K and quasi-static elastance. In addition, exposure to THS 2.2 aerosol did not have any marked effect on inspiratory capacity, compliance, elastance, or resistance relative to sham exposure. In contrast, the 3R4F group showed a typical increase in inspiratory capacity and compliance (and, thus, a decrease in elastance—the reciprocal of compliance) at both time points, relative to the sham and THS 2.2 groups (Supplementary Table 11).
Figure 10.

Lung function P-V loops. The data for P-V are median values of replicate measurements recorded at months 1 (1M; left) and 5 (5M; right) in female mice (9–10 mice per group). All data are provided in a descriptive statistics table in Supplementary File 4. Abbreviations P-V, pressure-volume; H2O, water; THS, tobacco heating system; L, low; M, medium; H, high.
In the constant-phase model, the 3R4F group had lower tissue damping or resistance (G) at month 5 and lower tissue elastance (H) at months 1 and 5 than the sham and THS 2.2 groups. In the forced expiration maneuver test, the 3R4F group had higher forced vital capacity, forced expiratory volume (FEV), forced expiratory flow (FEF), and time to peak expiratory flow (TPEF) than the sham and THS 2.2 groups. The small changes observed in FEV, FEF, and/or TPEF in the THS 2.2 (L) group are likely incidental, because no concentration-dependent changes were observed (Supplementary Table 11).
Histopathological Analysis of Respiratory Tract Organs
Nonneoplastic changes in the nose, larynx, and trachea
Adaptive changes in nasal epithelia (eg, hyperplasia, squamous epithelial metaplasia, cornification, and ectasis of submucosal glands) and degenerative changes (ie, atrophy with loss of nerve bundles) were observed in CS-exposed mice. Up to month 10, such findings were either absent or much less severe in the THS 2.2 group than in the 3R4F group (Table 2). At terminal dissection, exposure-related changes were observed at deeper levels of the nose (eg, atrophy and metaplasia of olfactory epithelium at nose level 4) and were more severe in CS-exposed mice than in THS 2.2 aerosol-exposed mice. In the THS 2.2 groups, changes that were not previously seen at interim dissections (eg, squamous epithelial metaplasia of respiratory epithelium at nose level 1 and olfactory epithelium atrophy at nose level 2) were seen at terminal dissection. However, these changes were significantly less severe than those in the 3R4F group (Table 2).
Table 2.
Nonneoplastic Changes in the Nose, Larynx, and Trachea
| Parameters | Month | Female |
Male |
||||||
|---|---|---|---|---|---|---|---|---|---|
| Sham | 3R4F | THS (L) | THS (M) | THS (H) | Sham | THS (H) | |||
| Nose level 1 | Respiratory epithelium, cornification | 1 | 0.00±0.000 (11) | 0.09±0.091 (11) | 0.00±0.000 (11) | 0.00±0.000 (11) | 0.00±0.000 (11) | ND | ND |
| 5 | 0.00±0.000 (12) | 0.08±0.083 (12) | 0.00±0.000 (12) | 0.00±0.000 (12) | 0.00±0.000 (12) | ND | ND | ||
| 10 | 0.00±0.000 (12) | 0.45±0.282 (11) | 0.00±0.000 (11) | 0.00±0.000 (11) | 0.00±0.000 (12) | ND | ND | ||
| 15/18 | 0.00±0.000 (54) | 0.73±0.103 (56)*** | 0.00±0.000 (56)### | 0.00±0.000 (61)### | 0.00±0.000 (59)### | 0.00±0.000 (99) | 0.00±0.000 (61) | ||
| Respiratory epithelium, hyperplasia | 1 | 0.27±0.141 (11) | 3.91±0.091 (11)*** | 0.45±0.157 (11)### | 0.64±0.203 (11)### | 1.18±0.182 (11)**, ### | ND | ND | |
| 5 | 0.75±0.179 (12) | 4.00±0.000 (12)*** | 0.67±0.142 (12)### | 0.42±0.149 (12)### | 0.67±0.142 (12)### | ND | ND | ||
| 10 | 0.42±0.193 (12) | 3.82±0.122 (11)*** | 0.36±0.152 (11)### | 0.55±0.157 (11)### | 1.17±0.423 (12)### | ND | ND | ||
| 15/18 | 0.41±0.077 (54) | 3.88±0.077 (56)*** | 0.39±0.079 (56)### | 0.41±0.079 (61)### | 0.92±0.106 (59)***, ### | 1.15±0.078 (99) | 2.36±0.099 (61)*** | ||
| Respiratory epithelium, squamous epithelial metaplasia | 1 | 0.00±0.000 (11) | 3.18±0.122 (11)*** | 0.00±0.000 (11)### | 0.00±0.000 (11)### | 0.00±0.000 (11)### | ND | ND | |
| 5 | 0.00±0.000 (12) | 3.25±0.179 (12)*** | 0.00±0.000 (12)### | 0.00±0.000 (12)### | 0.00±0.000 (12)### | ND | ND | ||
| 10 | 0.00±0.000 (12) | 3.36±0.203 (11)*** | 0.00±0.000 (11)### | 0.00±0.000 (11)### | 0.25±0.131 (12)### | ND | ND | ||
| 15/18 | 0.07±0.036 (54) | 3.86±0.078 (56)*** | 0.00±0.000 (56)*, ### | 0.02±0.016 (61)### | 0.14±0.074 (59)### | 0.12±0.036 (99) | 0.54±0.068 (61)*** | ||
| Nose level 2 | Respiratory epithelium, hyperplasia | 1 | 0.00±0.000 (11) | 1.73±0.237 (11)*** | 0.09±0.091 (11)### | 0.00±0.000 (11)### | 0.09±0.091 (11)### | ND | ND |
| 5 | 0.00±0.000 (12) | 2.42±0.229 (12)*** | 0.00±0.000 (12)### | 0.00±0.000 (12)### | 0.00±0.000 (12)### | ND | ND | ||
| 10 | 0.00±0.000 (12) | 2.50±0.379 (12)*** | 0.36±0.364 (11)## | 0.00±0.000 (11)### | 0.00±0.000 (12)### | ND | ND | ||
| 15/18 | 0.00±0.000 (54) | 3.30±0.142 (56)*** | 0.00±0.000 (56)### | 0.00±0.000 (62)### | 0.07±0.068 (59)### | 0.08±0.028 (99) | 0.18±0.050 (61) | ||
| Respiratory epithelium, squamous epithelial metaplasia | 1 | 0.00±0.000 (11) | 0.36±0.203 (11) | 0.00±0.000 (11) | 0.00±0.000 (11) | 0.00±0.000 (11) | ND | ND | |
| 5 | 0.00±0.000 (12) | 0.83±0.207 (12)*** | 0.00±0.000 (12)### | 0.00±0.000 (12)### | 0.00±0.000 (12)### | ND | ND | ||
| 10 | 0.00±0.000 (12) | 1.42±0.379 (12)** | 0.27±0.273 (11)# | 0.00±0.000 (11)## | 0.00±0.000 (12)## | ND | ND | ||
| 15/18 | 0.00±0.000 (54) | 2.55±0.171 (56)*** | 0.00±0.000 (56)### | 0.00±0.000 (62)### | 0.05±0.051 (59)### | 0.00±0.000 (99) | 0.00±0.000 (61) | ||
| Olfactory epithelium, atrophy | 1 | 0.00±0.000 (11) | 1.36±0.364 (11)** | 0.00±0.000 (11)## | 0.00±0.000 (11)## | 0.00±0.000 (11)## | ND | ND | |
| 5 | 0.00±0.000 (12) | 2.58±0.149 (12)*** | 0.00±0.000 (12)### | 0.00±0.000 (12)### | 0.00±0.000 (12)### | ND | ND | ||
| 10 | 0.00±0.000 (12) | 2.64±0.279 (11)*** | 0.36±0.364 (11)## | 0.09±0.091 (11)### | 0.17±0.112 (12)### | ND | ND | ||
| 15/18 | 0.28±0.100 (54) | 2.61±0.203 (56)*** | 0.29±0.083 (56)### | 0.29±0.070 (62)### | 0.64±0.132 (59)*, ### | 0.13±0.049 (99) | 0.69±0.125 (61)*** | ||
| Olfactory epithelium, lamina propria, loss of nerve bundles | 1 | 0.00±0.000 (11) | 0.09±0.091 (11) | 0.00±0.000 (11) | 0.00±0.000 (11) | 0.00±0.000 (11) | ND | ND | |
| 5 | 0.00±0.000 (12) | 0.00±0.000 (12) | 0.00±0.000 (12) | 0.00±0.000 (12) | 0.00±0.000 (12) | ND | ND | ||
| 10 | 0.00±0.000 (12) | 1.64±0.364 (11)*** | 0.27±0.273 (11)## | 0.00±0.000 (11)### | 0.00±0.000 (12)### | ND | ND | ||
| 15/18 | 0.00±0.000 (54) | 3.93±0.150 (56)*** | 0.00±0.000 (56)### | 0.00±0.000 (62)### | 0.12±0.091 (59)### | 0.00±0.000 (99) | 0.00±0.000 (61) | ||
| Submucosal glands, ectasia | 1 | 0.00±0.000 (11) | 0.00±0.000 (11) | 0.00±0.000 (11) | 0.00±0.000 (11) | 0.00±0.000 (11) | ND | ND | |
| 5 | 0.00±0.000 (12) | 0.00±0.000 (12) | 0.00±0.000 (12) | 0.00±0.000 (12) | 0.00±0.000 (12) | ND | ND | ||
| 10 | 0.08±0.083 (12) | 0.50±0.289 (12) | 0.18±0.122 (11) | 0.00±0.000 (11) | 0.00±0.000 (12) | ND | ND | ||
| 15/18 | 0.09±0.061 (54) | 2.66±0.143 (56)*** | 0.25±0.073 (56)*, ### | 0.16±0.052 (62)### | 0.20±0.072 (59)### | 0.00±0.000 (99) | 0.00±0.000 (61) | ||
| Nose level 4 | Olfactory epithelium, atrophy | 1 | 0.00±0.000 (11) | 0.00±0.000 (11) | 0.00±0.000 (11) | 0.00±0.000 (11) | 0.00±0.000 (11) | ND | ND |
| 5 | 0.00±0.000 (12) | 0.00±0.000 (12) | 0.00±0.000 (12) | 0.00±0.000 (12) | 0.00±0.000 (12) | ND | ND | ||
| 10 | 0.00±0.000 (12) | 0.33±0.225 (12) | 0.00±0.000 (11) | 0.00±0.000 (11) | 0.00±0.000 (12) | ND | ND | ||
| 15/18 | 0.00±0.000 (54) | 1.63±0.172 (56)*** | 0.02±0.018 (56)### | 0.00±0.000 (61)### | 0.03±0.034 (58)### | 0.00±0.000 (99) | 0.00±0.000 (61) | ||
| Olfactory epithelium, lamina propria, loss of nerve bundles | 1 | 0.00±0.000 (11) | 0.00±0.000 (11) | 0.00±0.000 (11) | 0.00±0.000 (11) | 0.00±0.000 (11) | ND | ND | |
| 5 | 0.00±0.000 (12) | 0.00±0.000 (12) | 0.00±0.000 (12) | 0.00±0.000 (12) | 0.00±0.000 (12) | ND | ND | ||
| 10 | 0.00±0.000 (12) | 0.00±0.000 (12) | 0.00±0.000 (11) | 0.00±0.000 (11) | 0.00±0.000 (12) | ND | ND | ||
| 15/18 | 0.00±0.000 (54) | 0.57±0.127 (56)*** | 0.00±0.000 (56)### | 0.00±0.000 (61)### | 0.02±0.017 (58)### | 0.00±0.000 (99) | 0.00±0.000 (61) | ||
| Olfactory epithelium, squamous epithelial metaplasia | 1 | 0.00±0.000 (11) | 0.00±0.000 (11) | 0.00±0.000 (11) | 0.00±0.000 (11) | 0.00±0.000 (11) | ND | ND | |
| 5 | 0.00±0.000 (12) | 0.00±0.000 (12) | 0.00±0.000 (12) | 0.00±0.000 (12) | 0.00±0.000 (12) | ND | ND | ||
| 10 | 0.00±0.000 (12) | 0.00±0.000 (12) | 0.00±0.000 (11) | 0.00±0.000 (11) | 0.00±0.000 (12) | ND | ND | ||
| 15/18 | 0.00±0.000 (54) | 0.02±0.018 (56) | 0.00±0.000 (56) | 0.00±0.000 (61) | 0.00±0.000 (58) | 0.00±0.000 (99) | 0.00±0.000 (61) | ||
| Submucosal glands, ectasia | 1 | 0.00±0.000 (11) | 0.00±0.000 (11) | 0.00±0.000 (11) | 0.00±0.000 (11) | 0.00±0.000 (11) | ND | ND | |
| 5 | 0.00±0.000 (12) | 0.00±0.000 (12) | 0.00±0.000 (12) | 0.00±0.000 (12) | 0.00±0.000 (12) | ND | ND | ||
| 10 | 0.00±0.000 (12) | 0.42±0.288 (12) | 0.00±0.000 (11) | 0.00±0.000 (11) | 0.00±0.000 (12) | ND | ND | ||
| 15/18 | 0.00±0.000 (54) | 0.77±0.157 (56)*** | 0.00±0.000 (56)### | 0.00±0.000 (61)### | 0.03±0.034 (58)### | 0.00±0.000 (99) | 0.00±0.000 (61) | ||
| Trachea, carina of bifurcation | Epithelium, hyperplasia | 1 | 0.00±0.000 (6) | 1.33±0.471 (9)* | 0.14±0.143 (7) | 0.00±0.000 (5) | 0.00±0.000 (8)# | ND | ND |
| 5 | 0.00±0.000 (9) | 1.29±0.360 (7)** | 0.09±0.091 (11)## | 0.00±0.000 (8)## | 0.18±0.182 (11)## | ND | ND | ||
| 10 | 0.00±0.000 (6) | 1.91±0.211 (11)*** | 0.00±0.000 (8)### | 0.00±0.000 (9)### | 0.25±0.250 (8)## | ND | ND | ||
| 15/18 | 0.10±0.057 (42) | 2.47±0.178 (49)*** | 0.12±0.068 (43)### | 0.13±0.067 (46)### | 0.24±0.101 (42)### | 0.01±0.013 (78) | 0.08±0.050 (48) | ||
| Epithelium, squamous epithelial metaplasia | 1 | 0.33±0.211 (6) | 0.56±0.242 (9) | 0.14±0.143 (7) | 0.40±0.245 (5) | 0.13±0.125 (8) | ND | ND | |
| 5 | 0.22±0.147 (9) | 1.14±0.404 (7)* | 0.18±0.182 (11)# | 0.13±0.125 (8)# | 0.09±0.091 (11)## | ND | ND | ||
| 10 | 0.17±0.167 (6) | 1.27±0.304 (11)* | 0.00±0.000 (8)## | 0.11±0.111 (9)## | 0.13±0.125 (8)# | ND | ND | ||
| 15/18 | 0.12±0.061 (42) | 1.59±0.157 (49)*** | 0.02±0.023 (43)### | 0.07±0.037 (46)### | 0.10±0.046 (42)### | 0.00±0.000 (78) | 0.00±0.000 (48) | ||
| Trachea, longitudinal section | Epithelium, hyperplasia | 1 | 0.38±0.263 (8) | 0.40±0.267 (10) | 0.10±0.100 (10) | 0.13±0.125 (8) | 0.00±0.000 (8) | ND | ND |
| 5 | 0.20±0.133 (10) | 0.86±0.404 (7) | 0.00±0.000 (11)## | 0.11±0.111 (9) | 0.08±0.083 (12)# | ND | ND | ||
| 10 | 0.38±0.183 (8) | 1.00±0.270 (11) | 0.00±0.000 (10)*, ## | 0.11±0.111 (9)# | 0.11±0.111 (9)# | ND | ND | ||
| 15/18 | 0.07±0.053 (42) | 2.00±0.184 (51)*** | 0.07±0.049 (45)### | 0.06±0.047 (47)### | 0.09±0.061 (46)### | 0.00±0.000 (80) | 0.00±0.000 (49) | ||
| Epithelium, squamous epithelial metaplasia | 1 | 0.00±0.000 (8) | 0.00±0.000 (10) | 0.00±0.000 (10) | 0.00±0.000 (8) | 0.00±0.000 (8) | ND | ND | |
| 5 | 0.00±0.000 (10) | 0.00±0.000 (7) | 0.00±0.000 (11) | 0.00±0.000 (9) | 0.00±0.000 (12) | ND | ND | ||
| 10 | 0.00±0.000 (8) | 0.00±0.000 (11) | 0.00±0.000 (10) | 0.00±0.000 (9) | 0.00±0.000 (9) | ND | ND | ||
| 15/18 | 0.00±0.000 (42) | 0.65±0.125 (51)*** | 0.02±0.022 (45)### | 0.00±0.000 (47)### | 0.00±0.000 (46)### | 0.00±0.000 (80) | 0.00±0.000 (49) | ||
| Trachea, transverse section | Epithelium, hyperplasia | 1 | 0.20±0.133(10) | 0.10±0.100 (10) | 0.36±0.203 (11) | 0.10±0.100 (10) | 0.18±0.122 (11) | ND | ND |
| 5 | 0.67±0.236 (9) | 1.00±0.236 (9) | 0.30±0.153 (10)# | 0.55±0.247 (11) | 0.55±0.207 (11) | ND | ND | ||
| 10 | 0.10±0.100 (10) | 0.55±0.207 (11) | 0.30±0.153 (10) | 0.22±0.147 (9) | 0.09±0.091 (11) | ND | ND | ||
| 15/18 | 0.44±0.107 (48) | 0.78±0.129 (54)* | 0.20±0.064 (50)### | 0.22±0.065 (58)### | 0.16±0.061 (49)### | 0.08±0.028 (93) | 0.05±0.030 (56) | ||
| Epithelium, squamous epithelial metaplasia | 1 | 0.00±0.000 (10) | 0.00±0.000 (10) | 0.00±0.000 (11) | 0.00±0.000 (10) | 0.18±0.122 (11) | ND | ND | |
| 5 | 0.11±0.111 (9) | 0.22±0.147 (9) | 0.10±0.100 (10) | 0.18±0.122 (11) | 0.09±0.091 (11) | ND | ND | ||
| 10 | 0.00±0.000 (10) | 0.09±0.091 (11) | 0.10±0.100 (10) | 0.00±0.000 (9) | 0.00±0.000 (11) | ND | ND | ||
| 15/18 | 0.04±0.029 (48) | 0.20±0.067 (54)* | 0.06±0.034 (50) | 0.10±0.047 (58) | 0.08±0.040 (49) | 0.02±0.015 (93) | 0.00±0.000 (56) | ||
| Larynx, base of epiglottis | Epithelium, cornification | 1 | 0.00±0.000 (11) | 3.82±0.536 (11)*** | 0.00±0.000 (11)### | 0.00±0.000 (10)### | 0.00±0.000 (11)### | ND | ND |
| 5 | 0.00±0.000 (12) | 4.83±0.112 (12)*** | 0.00±0.000 (12)### | 0.00±0.000 (11)### | 0.09±0.091 (11)### | ND | ND | ||
| 10 | 0.00±0.000 (12) | 4.45±0.455 (11)*** | 0.00±0.000 (11)### | 0.00±0.000 (11)### | 0.17±0.167 (12)### | ND | ND | ||
| 15/18 | 0.00±0.000 (54) | 4.78±0.085 (55)*** | 0.00±0.000 (55)### | 0.02±0.016 (62)### | 0.44±0.125 (57)***, ### | 0.00±0.000 (95) | 0.52±0.102 (60)*** | ||
| Epithelium, hyperplasia | 1 | 1.09±0.285 (11) | 5.00±0.000 (11)*** | 2.00±0.135 (11) *, ### | 2.50±0.269 (10)**, ### | 3.55±0.207 (11)***, ### | ND | ND | |
| 5 | 1.00±0.246 (12) | 5.00±0.000 (12)*** | 1.83±0.167 (12)**, ### | 2.55±0.282 (11)**, ### | 3.45±0.157 (11)***, ### | ND | ND | ||
| 10 | 0.25±0.131 (12) | 5.00±0.000 (11)*** | 1.18±0.182 (11)**, ### | 1.64±0.203 (11)***, ### | 2.83±0.271 (12)***, ### | ND | ND | ||
| 15/18 | 0.54±0.094 (54) | 4.96±0.036 (55)*** | 1.05±0.095 (55)***, ### | 2.29±0.116 (62)***, ### | 3.25±0.104 (57)***, ### | 0.61±0.074 (95) | 3.82±0.097 (60)*** | ||
| Epithelium, hyperplasia of metaplastic epithelium | 1 | 0.00±0.000 (11) | 3.64±0.244 (11)*** | 0.00±0.000 (11)### | 0.00±0.000 (10)### | 0.00±0.000 (11)### | ND | ND | |
| 5 | 0.00±0.000 (12) | 4.67±0.188 (12)*** | 0.00±0.000 (12)### | 0.00±0.000 (11)### | 0.00±0.000 (11)### | ND | ND | ||
| 10 | 0.00±0.000 (12) | 4.27±0.237 (11)*** | 0.00±0.000 (11)### | 0.00±0.000 (11)### | 0.00±0.000 (12)### | ND | ND | ||
| 15/18 | 0.00±0.000 (54) | 4.71±0.112 (55)*** | 0.00±0.000 (55)### | 0.00±0.000 (62)### | 0.16±0.099 (57)### | 0.00±0.000 (95) | 0.17±0.076 (60)** | ||
| Epithelium, papillary hyperplasia/folding | 1 | 0.00±0.000 (11) | 0.00±0.000 (11) | 0.00±0.000 (11) | 0.00±0.000 (10) | 0.00±0.000 (11) | ND | ND | |
| 5 | 0.00±0.000 (12) | 1.33±0.449 (12)** | 0.00±0.000 (12)## | 0.00±0.000 (11)## | 0.00±0.000 (11)## | ND | ND | ||
| 10 | 0.00±0.000 (12) | 2.09±0.476 (11)*** | 0.00±0.000 (11)### | 0.00±0.000 (11)### | 0.00±0.000 (12)### | ND | ND | ||
| 15/18 | 0.00±0.000 (54) | 2.40±0.207 (55)*** | 0.00±0.000 (55)### | 0.00±0.000 (62)### | 0.09±0.072 (57)### | 0.00±0.000 (95) | 0.03±0.033 (60) | ||
| Epithelium, squamous epithelial metaplasia | 1 | 0.73±0.273 (11) | 4.73±0.195 (11)*** | 1.09±0.211 (11)### | 1.60±0.221 (10)*, ### | 2.36±0.203 (11)***, ### | ND | ND | |
| 5 | 0.25±0.131 (12) | 5.00±0.000 (12)*** | 0.50±0.230 (12)### | 1.55±0.282 (11)***, ### | 2.36±0.310 (11)***, ### | ND | ND | ||
| 10 | 0.00±0.000 (12) | 5.00±0.000 (11)*** | 0.18±0.122 (11)### | 0.73±0.237 (11)**, ### | 1.83±0.322 (12)***, ### | ND | ND | ||
| 15/18 | 0.15±0.049 (54) | 4.98±0.018 (55)*** | 0.31±0.063 (55)*, ### | 1.66±0.113 (62)***, ### | 2.88±0.128 (57)***, ### | 0.17±0.049 (95) | 3.25±0.105 (60)*** | ||
| Larynx, floor | Epithelium, cornification | 1 | 0.00±0.000 (11) | 4.36±0.338 (11)*** | 0.00±0.000 (11)### | 0.00±0.000 (10)### | 0.10±0.100 (10)### | ND | ND |
| 5 | 0.00±0.000 (12) | 4.92±0.083 (12)*** | 0.00±0.000 (12)### | 0.09±0.091 (11)### | 0.00±0.000 (11)### | ND | ND | ||
| 10 | 0.00±0.000 (12) | 5.00±0.000 (11)*** | 0.00±0.000 (11)### | 0.00±0.000 (11)### | 0.08±0.083 (12)### | ND | ND | ||
| 15/18 | 0.00±0.000 (51) | 4.89±0.096 (53)*** | 0.00±0.000 (52)### | 0.00±0.000 (57)### | 0.36±0.136 (50)**, ### | 0.00±0.000 (94) | 0.41±0.098 (58)*** | ||
| Epithelium, hyperplasia | 1 | 1.55±0.312 (11) | 5.00±0.000 (11)*** | 2.00±0.191 (11)### | 2.50±0.224 (10)* , ### | 3.80±0.200 (10)*** , ### | ND | ND | |
| 5 | 1.08±0.229 (12) | 5.00±0.000 (12)*** | 1.58±0.193 (12)### | 2.91±0.163 (11)***, ### | 3.45±0.157 (11)***, ### | ND | ND | ||
| 10 | 0.58±0.229 (12) | 5.00±0.000 (11)*** | 1.73±0.333 (11)*, ### | 2.18±0.182 (11)***, ### | 2.92±0.313 (12)***, ### | ND | ND | ||
| 15/18 | 0.98±0.127 (51) | 4.96±0.038 (53)*** | 1.38±0.114 (52)*, ### | 2.30±0.112 (57)***, ### | 3.24±0.116 (50)***, ### | 1.11±0.107 (94) | 3.57±0.105 (58)*** | ||
| Epithelium, hyperplasia of metaplastic epithelium | 1 | 0.00±0.000 (11) | 4.09±0.251 (11)*** | 0.00±0.000 (11)### | 0.00±0.000 (10)### | 0.00±0.000 (10)### | ND | ND | |
| 5 | 0.00±0.000 (12) | 4.83±0.112 (12)*** | 0.00±0.000 (12)### | 0.00±0.000 (11)### | 0.00±0.000 (11)### | ND | ND | ||
| 10 | 0.00±0.000 (12) | 4.73±0.195 (11)*** | 0.00±0.000 (11)### | 0.00±0.000 (11)### | 0.00±0.000 (12)### | ND | ND | ||
| 15/18 | 0.00±0.000 (51) | 4.77±0.103 (53)*** | 0.00±0.000 (52)### | 0.00±0.000 (57)### | 0.22±0.119 (50)*, ### | 0.00±0.000 (94) | 0.19±0.087 (58)** | ||
| Epithelium, papillary hyperplasia/ folding | 1 | 0.00±0.000 (11) | 0.00±0.000 (11) | 0.00±0.000 (11) | 0.00±0.000 (10) | 0.00±0.000 (10) | ND | ND | |
| 5 | 0.00±0.000 (12) | 1.33±0.582 (12)* | 0.00±0.000 (12)# | 0.00±0.000 (11)# | 0.00±0.000 (11)# | ND | ND | ||
| 10 | 0.00±0.000 (12) | 2.64±0.491 (11)*** | 0.00±0.000 (11)### | 0.00±0.000 (11)### | 0.00±0.000 (12)### | ND | ND | ||
| 15/18 | 0.00±0.000 (51) | 2.30±0.210 (53)*** | 0.00±0.000 (52)### | 0.11±0.054 (57)### | 0.10±0.071 (50)### | 0.00±0.000 (94) | 0.16±0.088 (58)* | ||
| Epithelium, squamous epithelial metaplasia | 1 | 0.27±0.141 (11) | 4.73±0.141 (11)*** | 0.36±0.203 (11)### | 1.20±0.200 (10)**, ### | 2.30±0.367 (10)***, ### | ND | ND | |
| 5 | 0.08±0.083 (12) | 5.00±0.000 (12)*** | 0.42±0.260 (12)### | 1.27±0.359 (11)**, ### | 1.64±0.152 (11)***, ### | ND | ND | ||
| 10 | 0.00±0.000 (12) | 5.00±0.000 (11)*** | 0.27±0.141 (11)### | 0.82±0.182 (11)***, ### | 1.17±0.322 (12)***, ### | ND | ND | ||
| 15/18 | 0.12±0.053 (51) | 4.67±0.165 (54)*** | 0.17±0.053 (52)### | 1.11±0.147 (57)***, ### | 2.30±0.167 (50)***, ### | 0.20±0.060 (94) | 2.71±0.159 (58)*** | ||
| Larynx, ventral depression | Epithelium, cornification | 1 | 0.00±0.000 (11) | 0.80±0.442 (10) | 0.00±0.000 (11) | 0.00±0.000 (10) | 0.00±0.000 (10) | ND | ND |
| 5 | 0.00±0.000 (12) | 3.73±0.574 (11)*** | 0.00±0.000 (12)### | 0.00±0.000 (12)### | 0.00±0.000 (11)### | ND | ND | ||
| 10 | 0.00±0.000 (12) | 4.27±0.469 (11)*** | 0.00±0.000 (11)### | 0.00±0.000 (11)### | 0.00±0.000 (12)### | ND | ND | ||
| 15/18 | 0.00±0.000 (51) | 4.35±0.212 (54)*** | 0.00±0.000 (52)### | 0.00±0.000 (58)### | 0.10±0.100 (50)### | 0.00±0.000 (96) | 0.00±0.000 (59) | ||
| Epithelium, papillary hyperplasia/ folding | 1 | 0.00±0.000 (11) | 0.00±0.000 (10) | 0.00±0.000 (11) | 0.00±0.000 (10) | 0.00±0.000 (10) | ND | ND | |
| 5 | 0.00±0.000 (12) | 0.09±0.091 (11) | 0.00±0.000 (12) | 0.00±0.000 (12) | 0.00±0.000 (11) | ND | ND | ||
| 10 | 0.00±0.000 (12) | 0.82±0.553 (11) | 0.00±0.000 (11) | 0.00±0.000 (11) | 0.00±0.000 (12) | ND | ND | ||
| 15/18 | 0.00±0.000 (51) | 0.28±0.122 (54)* | 0.00±0.000 (52)# | 0.00±0.000 (58)# | 0.00±0.000 (50)# | 0.00±0.000 (96) | 0.00±0.000 (59) | ||
| Epithelium, squamous epithelial metaplasia | 1 | 0.00±0.000 (11) | 2.10±0.526 (10)*** | 0.09±0.091 (11)## | 0.00±0.000 (10)### | 0.00±0.000 (10)### | ND | ND | |
| 5 | 0.00±0.000 (12) | 4.18±0.464 (11)*** | 0.00±0.000 (12)### | 0.08±0.083 (12)### | 0.18±0.122 (11)### | ND | ND | ||
| 10 | 0.00±0.000 (12) | 4.82±0.122 (11)*** | 0.00±0.000 (11)### | 0.00±0.000 (11)### | 0.00±0.000 (12)### | ND | ND | ||
| 15/18 | 0.00±0.000 (51) | 4.65±0.140 (54)*** | 0.00±0.000 (52)### | 0.07±0.048 (58)### | 0.10±0.100 (50)### | 0.00±0.000 (96) | 0.07±0.041 (59)* | ||
| Larynx, vocal cords | Epithelium, cornification | 1 | 0.00±0.000 (11) | 2.36±0.691 (11)** | 0.00±0.000 (11)## | 0.00±0.000 (10)## | 0.00±0.000 (10)## | ND | ND |
| 5 | 0.00±0.000 (12) | 4.83±0.167 (12)*** | 0.00±0.000 (12)### | 0.00±0.000 (12)### | 0.00±0.000 (11)### | ND | ND | ||
| 10 | 0.00±0.000 (12) | 5.00±0.000 (11)*** | 0.00±0.000 (10)### | 0.00±0.000 (11)### | 0.00±0.000 (12)### | ND | ND | ||
| 15/18 | 0.00±0.000 (51) | 4.90±0.100 (50)*** | 0.00±0.000 (52)### | 0.00±0.000 (57)### | 0.12±0.102 (50)### | 0.00±0.000 (94) | 0.05±0.038 (58) | ||
| Epithelium, hyperplasia | 1 | 1.18±0.226 (11) | 3.64±0.310 (11)*** | 1.09±0.251 (11)### | 1.50±0.167 (10)### | 2.00±0.211 (10)*, ## | ND | ND | |
| 5 | 0.75±0.218 (12) | 5.00±0.000 (12)*** | 1.33±0.188 (12)### | 1.67±0.225 (12)*, ### | 2.27±0.195 (11)***, ### | ND | ND | ||
| 10 | 0.17±0.112 (12) | 4.64±0.152 (11)*** | 0.70±0.260 (10)### | 0.91±0.211 (11)**, ### | 1.08±0.193 (12)**, ### | ND | ND | ||
| 15/18 | 0.12±0.046 (51) | 4.62±0.099 (50)*** | 0.48±0.085 (52)***, ### | 0.70±0.112 (57)***, ### | 0.82±0.153 (50)***, ### | 0.46±0.067 (94) | 1.05±0.119 (58)*** | ||
| Epithelium, papillary hyperplasia/ folding | 1 | 0.00±0.000 (11) | 0.00±0.000 (11) | 0.00±0.000 (11) | 0.00±0.000 (10) | 0.00±0.000 (10) | ND | ND | |
| 5 | 0.00±0.000 (12) | 0.75±0.411 (12) | 0.00±0.000 (12) | 0.00±0.000 (12) | 0.00±0.000 (11) | ND | ND | ||
| 10 | 0.00±0.000 (12) | 0.27±0.195 (11) | 0.00±0.000 (10) | 0.00±0.000 (11) | 0.00±0.000 (12) | ND | ND | ||
| 15/18 | 0.00±0.000 (51) | 0.72±0.146 (50)*** | 0.00±0.000 (52)### | 0.00±0.000 (57)### | 0.06±0.060 (50)### | 0.00±0.000 (94) | 0.00±0.000 (58) | ||
Data shown are severity scores reported as mean ± SEM. The number of individual animal measurements is shown in parentheses. Organs were evaluated at months 1, 5, 10, 15 (male), or 18 (female). *, **, and *** represent statistically significant differences between the treatment and sham groups at p ≤ .05, p ≤ .01, and p ≤ .001, respectively. #, ##, and ### represent statistically significant differences between the THS and 3R4F groups at p ≤ .05, p ≤ .01, and p ≤ .001, respectively. All data are provided in a descriptive statistics table in Supplementary File 4.
Abbreviations: THS, tobacco heating system; L, low; M, medium; H, high; ND, not detected.
Overall, pathological findings at the larynx were either absent or notably lower in severity in the THS 2.2 group than in the 3R4F group (Table 2). Epithelial cornification at the ventral depression (at months 5 and 10 and terminal dissection) and vocal cords (all time points) was observed only in CS-exposed mice. The same was true for hyperplasia and squamous epithelial metaplasia of submucosal glands/duct epithelium at the base of the epiglottis (months 1, 5, and 10). Epithelial hyperplasia at the base of the epiglottis was observed in all groups at all time points, whereas epithelial hyperplasia on the floor of the larynx was observed in female THS 2.2 (L) mice at month 10 and terminal dissection and in THS 2.2 (M), THS 2.2 (H), and 3R4F mice at all time points. The severity of hyperplasia was directly related to THS 2.2 aerosol concentration; however, hyperplasia was less severe in the THS 2.2 groups than in the 3R4F group. Similarly, squamous epithelial metaplasia at the base of the epiglottis was observed in the female THS 2.2 (M) and THS 2.2 (H) groups at months 1, 5, and 10, in all male and female THS 2.2 groups at terminal dissection, and in the 3R4F group at all time points. The severity of squamous epithelial metaplasia was also directly related to THS 2.2 aerosol concentration, and, again, this epithelial change was less severe in the THS 2.2 groups than in the 3R4F group.
No remarkable exposure-related effects were noted in the trachea of THS 2.2 aerosol-exposed mice at any time point (Table 2). From month 5 onwards, the mean severity scores for epithelial hyperplasia and squamous epithelial metaplasia of the carina of bifurcation were substantially higher in the 3R4F group than in the THS 2.2 and sham groups. Hyperplasia and squamous epithelial metaplasia in the longitudinal and transverse sections of the trachea were observed only in 3R4F CS-exposed mice at terminal dissection.
Neoplastic changes in the nose, larynx, and trachea
Preneoplastic and neoplastic changes observed in respiratory tract organs included papillary hyperplasia/folding and papilloma at the larynx. There was no increase in the incidence of papilloma of the laryngeal epithelium in the THS 2.2 groups relative to the sham group. In contrast, the incidence of papilloma on the floor of the larynx (as well as the pooled incidence at all anatomical laryngeal locations) was higher in the 3R4F group than in the sham group. Although papillomas were also found in the vocal cords and base of the epiglottis in CS-exposed animals, their incidence was not statistically significantly increased relative to that in the sham animals. The incidence of preneoplastic laryngeal lesions (ie, papillary hyperplasia/folding combined with papilloma) was also higher (only) in the 3R4F group than in the sham group (Supplementary Figure 3).
Nonneoplastic changes in the lungs
Histopathological assessment of the lungs in the 3R4F group further confirmed the presence of inflammatory cell infiltrates, which were absent in the THS 2.2 groups (Figure 11). The lung discoloration observed in 3R4F CS-exposed mice upon gross pathological analysis was correlated with intra-alveolar inflammation. Increased unpigmented macrophage and yellow-pigmented macrophage infiltrates were observed only in the 3R4F group, starting from month 1. From month 5 onwards, increased pigmented macrophage nests, neutrophilic granulocytes, and lymphocyte infiltrates were additionally observed in the alveolar lumen in the 3R4F group only (Figure 11).
Figure 11.

Histopathological findings in the lungs. Prominent histopathological findings indicative of lung inflammation (severity scores) at months 1 (1M), 5 (5M), 10 (10M), 15 (15M), and/or 18 (18M). The numbers shown on top of each bar in the bar graphs represent the mean values. *, **, and *** represent statistically significant differences between the treatment and sham groups at p ≤ .05, p ≤ .01, and p ≤ .001, respectively. #, ##, and ### represent statistically significant differences between the THS and 3R4F groups at p ≤ .05, p ≤ .01, and p ≤ .001, respectively. All data are provided in a descriptive statistics table in Supplementary File 4. Abbreviations THS, tobacco heating system; L, low; M, medium; H, high; 1, 5, 10, 18, and 15M, dissection at months 1, 5, 10, 18, and 15.
Histomorphological assessment of lung emphysematous changes
Although moderate to marked lung emphysematous changes were present in the 3R4F group, they were absent in the THS 2.2 groups. None of the lung volume or lung morphometry parameters was affected in the THS 2.2 groups (Figure 12). In contrast, the mean chord length, destructive index, and lung volume were consistently greater and the number of bronchiolar attachments was lower in the 3R4F group than in the sham group at all time points. Enlargement of distal airspaces in the CS-exposed group was reflected by the increase in total alveolar duct air volume, total air (alveolar and duct) volume, and volume-weighted mean volume of the alveoli at all time points. Destruction of alveolar septa in the 3R4F group at month 5 and terminal dissection was evidenced by the reduced total number of alveoli (Figure 12).
Figure 12.

Assessment of lung emphysematous changes. Histopathological findings, conventional morphology endpoints (mean chord length, destructive index, and bronchiolar attachments), lung volume, and stereological morphology endpoints for assessment of lung emphysema in female mice at months 5 (5M), 10 (10M), and 18 (18M) and in male mice at month 15 (15M) are shown. The numbers shown on top of each bar in the bar graphs represent the mean values. *, **, and *** represent statistically significant differences between the treatment and sham groups at p ≤ .05, p ≤ .01, and p ≤ .001, respectively. #, ##, and ### represent statistically significant differences between the THS and 3R4F groups at p ≤ .05, p ≤ .01, and p ≤ .001, respectively. All data are provided in a descriptive statistics table in Supplementary File 4. Abbreviations: SEM, standard error of the mean; THS, tobacco heating system; L, low; M, medium; H, high.
Neoplastic changes in the lungs
Consistent with the findings of past studies, preneoplastic and neoplastic lesions of the lungs exclusively included nodular hyperplasia of the alveolar epithelium, bronchioloalveolar adenoma, and bronchioloalveolar adenocarcinoma. Masses or nodules noted on the lung lobes at necropsy were often associated with one of these lesions. At terminal dissection, all experimental groups had a group size of at least 50 animals to ensure sufficient statistical power, and tumor data were survival adjusted to account for early deaths in accordance with OECD guidance document 116 (OECD, 2012).
The lung tumor multiplicities for bronchioloalveolar adenoma, bronchioloalveolar carcinoma, and bronchioloalveolar adenoma and carcinoma combined in the female sham group were 0.9, 0.5, and 1.4, respectively; in comparison, the corresponding multiplicities in the 3R4F group were higher (2.9, 0.9 and 3.8, respectively). In female mice, lung tumor multiplicity was lower in the THS 2.2 and sham groups than in the 3R4F group (Figure 13 and Supplementary Table 12). There was no difference in lung tumor multiplicity between the female THS 2.2 groups and the sham group. The lower combined lung tumor multiplicity in the THS 2.2 and sham groups relative to the 3R4F group was partly attributable to the lower multiplicity of bronchioloalveolar adenoma. In addition, the multiplicity of bronchioloalveolar carcinoma was lower in the sham, THS 2.2 (H), and THS 2.2 (L) groups than in the 3R4F group. An inverse relationship was observed between THS 2.2 aerosol concentration and the multiplicity of nodular hyperplasia. The multiplicity of nodular hyperplasia was higher in the THS (L) group than in the 3R4F group and comparable in the 3R4F and sham groups. In male mice, the survival-adjusted multiplicities of lung tumors and bronchioloalveolar adenomas were lower in the THS 2.2 (H) group than in the sham group (Supplementary Table 12).
Figure 13.

Preneoplastic and neoplastic lesions of the lungs. Survival-adjusted (A) multiplicity, (B) incidence, (C) size, and (D) load of bronchioloalveolar adenoma and bronchioloalveolar carcinoma are shown for female (month 18; 18M) and male (month 15; 15M) animals. The box-whisker plot in (A) indicates tumor multiplicity with 25th and 75th percentiles, with the bars extending to 1.5 times the interquartile range. The numbers shown on top represent the mean values. Tumor size was calculated as the sum of the number of cross-sections needed to transect the same proliferative lesion/tumor at a 300 µm intervals. A power of 3 in the poly-k analysis (k = 3) was used for survival-adjustment of tumor incidence. A power of 2 (X = 2) as well as thresholds (T) of study days 400 for female mice and 240 for male mice were used for survival adjustment of tumor multiplicity. Survival adjustment of tumor load and size was performed as in case of tumor multiplicity, except that a power of 1 was used. *, **, and *** represent statistically significant differences between the treatment and sham groups at p ≤ .05, p ≤ .01, and p ≤ .001, respectively. #, ##, and ### represent statistically significant differences between the THS and 3R4F groups at p ≤ .05, p ≤ .01, and p ≤ .001, respectively. All data are provided in a descriptive statistics table in Supplementary File 4. Abbreviations: SEM, standard error of the mean; THS, tobacco heating system; L, low; M, medium; H, high; ♂: male; ♀: female.
At terminal dissection, the incidences of bronchioloalveolar adenoma, bronchioloalveolar carcinoma, and all lung tumors (bronchioloalveolar adenoma and bronchioloalveolar carcinoma combined) in the female sham group were 55.7%, 30.7%, and 72.4%, respectively (Figure 13 and Supplementary Table 13). The incidences of bronchioloalveolar adenoma, bronchioloalveolar carcinoma, and lung tumors were statistically significantly higher in the 3R4F group (88.5%, 47.5%, and 95.4%, respectively) than in the sham group. There was no significant difference in lung tumor incidence between the female THS 2.2 groups and the sham group nor was there a positive trend in lung tumor incidence with increasing THS 2.2 concentrations. The incidences of bronchioloalveolar adenoma and all lung tumors (bronchioloalveolar adenoma and bronchioloalveolar carcinoma combined) were statistically significantly lower in the THS 2.2 groups than in the 3R4F group. The incidence of bronchioloalveolar carcinoma was also lower in the female THS 2.2 (H) group than in the 3R4F group. The incidence of preneoplastic nodular hyperplasia was inversely related to aerosol concentration in the female THS 2.2 groups. Among male animals, the incidences of bronchioloalveolar adenoma and lung tumors were lower in the THS 2.2 (H) group than in the sham group. However, the difference became nonsignificant when incidence was survival adjusted by using a power of 6 (poly-k test), which suggests that the lower lung tumor incidence might be attributable to the higher mortality rate in the male THS 2.2 (H) group (Supplementary Table 13).
The size of the proliferative lesions increased with tumor progression from nodular hyperplasia to bronchioloalveolar adenoma to bronchioloalveolar carcinoma. In female mice, bronchioloalveolar adenomas were bigger in size in the THS 2.2 and sham groups than in the 3R4F group. No difference in tumor size was observed between the THS 2.2 groups and the sham group. In male mice, bronchioloalveolar carcinomas were smaller in size in the THS 2.2 (H) group than in the sham group (Figure 13).
Tumor load is the sum of individual rounded tumor sizes per lesion type per animal. Because tumor load is dependent on tumor size and multiplicity, the statistically significant differences derived for tumor load closely matched those for tumor multiplicity.
Histopathology of Nonrespiratory Tract Organs
Nonneoplastic changes
There were no significant findings in male reproductive organs, brain, spinal cord, sciatic nerve, optic nerve, skin (with mammary glands), aorta, or fat tissues in the 3R4F, THS, or sham groups. Typical age-related findings in female mice, including cystic glandular dilation, hemometra, and uterine hyperplasia, were mild and did not appear to be exposure related (Supplementary Table 14).
Overall, there were very few THS 2.2 aerosol exposure-related effects, frequently with low severity scores and lacking dose-dependence. The THS 2.2 (L) and (H) groups showed minimal vacuolation of the adrenal cortical region relative to the sham and 3R4F groups (severity score <1). The 3R4F and female THS 2.2 (H) groups showed suppression of hyperplasia of type A cells in the adrenal glands. The female 3R4F, THS 2.2 (L), and THS 2.2 (M) groups showed a slight increase in myelopoiesis in the bone marrow of the femur. Both findings were much less severe in the THS 2.2 (M) group than in the 3R4F group. Thymus involution/atrophy was less severe in the female THS 2.2 groups than in the sham and 3R4F groups, with a dose-dependent decrease in severity scores. The 3R4F and THS groups both showed abnormal findings in the glandular and nonglandular stomach, such as squamous cell hyperplasia and hyperkeratosis, with the severity of these findings being similar in the 3R4F and THS (H) groups. Of note, diverticulum and focal atypical mucosal hyperplasia were absent in the 3R4F group but present in THS groups, with severity scores exhibiting inverse dose dependence. Additionally, in line with the suppression of inflammatory endpoints in other organs (eg, uterus, salivary glands, liver, lacrimal gland, and nonglandular stomach), CS-exposed animals also exhibited increased cystic follicles in the thyroid glands, reduced infiltration of interstitial mononuclear inflammatory cells in the kidneys, and reduced hyperplasia of subepithelial lymphoid cells in the urinary bladder (Supplementary Table 14).
Preneoplastic and Neoplastic Changes
No preneoplastic or neoplastic lesions were observed in urinary tract organs or male reproductive organs. Proliferative lesions and neoplasia of the ovaries, uterus, liver, thymus, Harderian gland, and pancreas (endocrine) were very rare and not likely exposure related. Systemic neoplasias—including hemangioma, histiocytic sarcoma, lymphoma, and mast cell tumors—were low in incidence in the sham, 3R4F, and THS groups and also not likely related to exposure. Because of the genetic predisposition of this mouse strain, firm masses found at dissection in the quadriceps and spinal cord were frequently associated with sarcoma of the skeletal muscle (rhabdomyosarcoma, fibrosarcoma, or undifferentiated sarcoma). Such masses were observed in the 3R4F, THS, and sham groups, without any significant treatment-related differences (Supplementary Table 15).
Neoplasia of the stomach usually developed late in the study (after 1 year) and was frequently first detected in-life as a firm mass in the abdomen. Neoplasias of the nonglandular stomach were either papillomas or squamous cell carcinomas. The incidence of squamous cell carcinomas, but not papillomas, of the nonglandular stomach was significantly higher in the 3R4F group than in the sham and THS 2.2 (M) and (H) groups (Supplementary Figure 4). The pooled incidence of squamous cell carcinomas, papillomas, and hyperplastic lesions in the nonglandular stomach was higher in the male THS 2.2 group than in the sham group. This was largely attributable to the preneoplastic lesions in the nonglandular stomach, because the severity scores for hyperplasia/folding of squamous cells were higher in the male THS 2.2 (H) group than in the sham group. There was no significant difference in the incidence of glandular stomach adenoma between any of the female treatment groups and the sham group; however, the incidence was lower in the male THS 2.2 (H) group than in the sham group (Supplementary Figure 4). When combined with diverticulum and hyperplastic lesions, the incidences of pooled preneoplastic and neoplastic lesions of the glandular stomach were lower in the 3R4F, THS 2.2 (M), and male and female THS 2.2 (H) groups than in the sham group. This was largely attributable to the preneoplastic lesions in the glandular stomach, because the severity scores for atypical diverticulum and mucosal hyperplasia were lower in the treatment groups than in the sham group (Supplementary Figure 4).
DISCUSSION
This report provides the first insight into the chronic toxicity and carcinogenicity of THS 2.2 aerosol in A/J mice relative to that of CS. The THS (M) 2.2 aerosol was matched by nicotine concentration to CS, whereas the THS 2.2 (L) and (H) aerosols contained half and 2 times the nicotine concentration of CS, respectively. On the basis of the study exposure regimen and a body surface area conversion factor of 12.3 (CDER, 2005; Reagan-Shaw et al., 2008)—and assuming a minute volume of 0.023 l/min, body weight of 22 g for female mice, and complete uptake of nicotine—the estimated delivered doses in the THS 2.2 (M) and THS 2.2 (H) groups were 4.98 and 9.96 mg/kg or 110 and 220 µg nicotine per day, corresponding to human equivalent nicotine doses of around 28.4 and 56.7 mg/day (ie, 1 and 2 packs of cigarettes per day), respectively.
Aerosols were generated and delivered in a consistent manner, with lower TPM, CO, and aldehyde levels in THS 2.2 aerosols than in CS at the same nicotine concentration and equivalent respirability of THS 2.2 aerosols and CS. Recovery of total nicotine metabolites in urine proportional in concentration to the nicotine concentrations of inhaled THS 2.2 aerosols reflected consistent aerosol uptake. The concentrations of urinary metabolites of nicotine and other aerosol components confirmed a significantly lower uptake of harmful constituents in the THS groups than in the 3R4F group, which is in line with previous reports of lower HPHC levels in THS 2.2 aerosol (Schaller et al., 2016a). Urinary nicotine metabolite levels were higher in the THS 2.2 group than in the nicotine-matched 3R4F group. This higher nicotine uptake from THS 2.2 aerosol is most likely due to its reduced irritancy relative to CS and the consequent reduced depression of respiratory frequency and minute volume, as observed in previous subchronic THS 2.2 inhalation studies in rats (Oviedo et al., 2016; Wong et al., 2016). In contrast to urinary nicotine metabolite levels, plasma nicotine and cotinine concentrations were higher in the 3R4F group than in the (nicotine matched) THS 2.2 group. The short half-lives of plasma nicotine and cotinine in mice (Zhou et al., 2010) and the time needed for blood collection postexposure make these endpoints less reliable than urine data, which present an integrative measurement of nicotine exposure over a longer time frame.
The 3R4F and THS 2.2 test atmospheres were well tolerated by the mice. Weight loss was transient and most prominent in the 3R4F and male THS 2.2 (H) groups during the first 3 weeks of the study. Thereafter, all animals gained weight progressively. Previous inhalation studies using this mouse strain have also reported similar initial body weight loss upon CS exposure (Stinn et al., 2013a,b), likely because of the adaptation to inhalation of harmful CS constituents. The weight loss observed in the THS 2.2 groups relative to the sham group might be attributable, at least in part, to the effects of nicotine, as seen in other nicotine-only administration studies (Chowdhury, 1990; Grunberg et al., 1987; Phillips et al., 2015a). Similarly, our findings of sporadic/transient tremors and increased salivation in the 3R4F and THS groups and reduced water consumption in the 3R4F group are consistent with previous reports (Clarke and Kumar, 1984; Iida et al., 2011) and might be due to exposure-related stress and nicotine exposure.
The present survival rates were consistent with those in previous CS exposure studies, with female mice showing better survival rates than male mice (Stinn et al., 2013a,b). It is worth noting, however, that the mortality rates are quite variable across studies and, hence, colonies of A/J mice. In addition, the previously reported trend of higher mortality in sham-exposed mice than in CS-exposed mice (Stinn et al., 2013a,b) was not seen in the present female groups.
Cardiomyopathy-related deaths, for which stress is a likely contributing factor, have been observed in previous studies (Chase et al., 2009; Han et al., 2007; Stinn et al., 2013a; Wenzel et al., 2007); however, they were very low in incidence in this study and did not contribute to the difference in mortality rates between the sham and CS groups or male and female mice. Early deaths due to neoplasia, including muscle-related tumors, were lower in the male THS group than in the sham group. No treatment-related difference in the incidence of muscle-related tumors was evident.
The higher mortality rate in the male THS 2.2 (H) group was predominantly linked to urogenital system impairment, on the basis of histopathological evaluation of animals found dead or declared moribund owing to excessive weight loss and/or other in-life observations. There were no causes of poor condition/moribundity and mortality that were uniquely found among male mice. There also were no unique histopathological findings that differentiated male early death THS (H) animals from their sham counterparts; male animals of both the sham and THS (H) exposure groups presented with findings in organs such as the urinary bladder, prostate, seminal vesicles, spleen and thymus. Although the nature of these findings seems to be very similar in male sham- and THS (H) aerosol-exposed mice, the exposure to the test substance exacerbates the incidence of these findings. In previous studies, this mouse strain did not present with urogenital problems; early death occurred often later in the studies and was either related to cardiac problems or musculoskeletal neoplasms such as rhabdomyosarcomas (Sher et al., 2011; Stinn et al., 2013a; Sundberg et al., 2016). Mortality due to urogenital pathologies has previously been reported in male inbred rats (Cramer and Gill, 1975; Shoji and Harata, 1977) and mice (Bendele and Carlton, 1986; Horton et al., 1988; Sokoloff and Barile, 1962). Although the causes of these urogenital pathologies remain multifactorial, congenital factors associated with mutations might induce modifications of the urogenital system in these animals, including in A/J mice (Sundberg et al., 2016), and lead to unexpected death during long-term studies (Bendele and Carlton, 1986; Horton et al., 1988). The way in which the inbred A/J mouse strain is maintained (ie, by sister × brother mating) might, therefore, have led to enrichment of the urogenital problems we observed in this study, suggesting that this is a strain-specific finding.
The changes in liver function parameters in this study were always within the physiological ranges reported for this strain of mice (Maddatu et al., 2012). In addition, we observed no marked changes in serum triglyceride and cholesterol levels beyond the physiological range following THS 2.2 aerosol exposure, even though CS and nicotine exposure have previously been reported to affect blood lipid levels in rats (Balakrishnan and Menon, 2007; Latha et al., 1993; Phillips et al., 2015a; Vanscheeuwijck et al., 2002; Wong et al., 2016). CS (and, in part, nicotine) was linked to increased oxidative stress, changes in lipid peroxidation, and exacerbation of underlying liver diseases (Bailey et al., 2009; Friedman et al., 2012; Helen and Vijayammal, 1997; Nemmar et al., 2012). Liver function data consistent with those of past studies in ApoE−/− mice (Phillips et al., 2016, 2019b) and the absence of histopathological liver findings support the notion that chronic THS 2.2 exposure does not exert hepatotoxic effects. Moreover, despite the slight increase in kidney weight in the male THS 2.2 (H) group, the absence of histopathological findings and the physiological levels of kidney function parameters in A/J mice suggest that chronic THS 2.2 aerosol exposure is not associated with renal toxicity.
Stress due to handling and exposure can have multiple effects, including changes in leukocyte counts (Everds et al., 2013; Reiche et al., 2004; Sopori, 2002), and is, eg, reflected by increased stress hormone levels in CS-exposed mice (Stinn et al., 2013b; Sundar et al., 2014). In this study, the lower lymphocyte counts, reduced spleen and thymus weight, and increased adrenal gland weight in the 3R4F and THS 2.2 groups suggest nicotine-related stress, in line with previous observations in nicotine inhalation studies (Oviedo et al., 2016; Phillips et al., 2015a, 2017; Wong et al., 2016). Exposure to CS toxicants and nicotine also negatively affects the maturation and/or number of follicles in the ovaries (Iranloye and Bolarinwa, 2009; Mohammadghasemi et al., 2012; Paixão et al., 2012; Sadeu and Foster, 2011; Tuttle et al., 2009). Ovary weight reduction was more obvious in the 3R4F group than in the THS groups in this study, but it was not observed after subchronic inhalation exposure of rats to CS or nicotine in previous studies (Oviedo et al., 2016; Phillips, 2016; Wong et al., 2016). However, this decrease showed no histopathological correlates that would suggest a reason for biological concern in the 3R4F or THS groups.
Chronic exposure of A/J mice to CS resulted in the typical adaptive and degenerative changes in nasal epithelia previously observed in mice and rats (Phillips et al., 2016, 2019b; Vanscheeuwijck et al., 2002). Such findings were either absent or much less severe in the THS 2.2 groups, and epithelia were affected at less deep levels of the nose. In addition, while CS-exposed mice commonly showed more advanced and more severe laryngeal epithelial adaptation, the THS 2.2 groups mostly showed low-grade epithelial adaptation in the larynx. Given that laryngeal epithelia are particularly sensitive to adaptive changes caused by inhaled particulates, and the extent of laryngeal epithelial adaptation permits assessment of the degree of irritation induced by the test atmosphere (Burger et al., 1989), these findings confirm earlier reports that aerosols from heat-not-burn tobacco products lack the irritancy of CS (Kogel et al., 2014; Phillips et al., 2016). Moreover, the incidence of laryngeal papilloma was very low (<10%), with the 3R4F group showing a higher incidence than the sham group, similar to our previous findings (Stinn et al., 2013a). Papillary hyperplasia of laryngeal epithelia represents the preneoplastic lesion of papilloma. The incidence of papilloma as well as the pooled incidence of papilloma and papillary hyperplasia/folding were significantly elevated in the 3R4F group relative to the sham and THS 2.2 (H) groups. It is likely that the CS-induced epithelial adaptation represents a precursor stage of a histological continuum encompassing hyperplasia with folding and papillary hyperplasia, ultimately leading to papilloma development. The absence of laryngeal epithelial adaptation in THS 2.2 aerosol-exposed mice suggests the lack of propensity of the aerosol for laryngeal tumor formation even under chronic exposure conditions as well as nicotine concentrations twice as high as those in CS.
Chronic exposure to CS is the leading cause of COPD and lung cancer, and there is ample evidence that CS-induced inflammation in the lungs plays a central role in the development of both diseases in long-term smokers (Adcock et al., 2011; Houghton, 2018). There was no significant lung inflammation in THS 2.2 aerosol-exposed animals in this study. Though not statistically significantly different from the 3R4F group, myoglobin was the only BALF analyte that showed a concentration dependent increase in the THS 2.2 aerosol-exposed groups relative to the sham group; this trend was not observed in a previous THS 2.2 inhalation study in ApoE−/− mice (Phillips et al., 2016). Myoglobin is an oxygen-binding heme protein abundantly expressed in muscle tissues and plays an important role in oxygen transport and free radical scavenging (Wittenberg and Wittenberg, 2003). However, myoglobin can also be expressed in nonmuscle tissues in response to hypoxia (Fraser et al., 2006) and in solid tumors, possibly in response to low oxygen tension (Flonta et al., 2009; Oleksiewicz et al., 2011). The origin of myoglobin in the BALF of exposed mice is uncertain at this time. The tumor response at month 5 was very low, and tumor-related hypoxia is, therefore, an unlikely cause. The underlying progressive muscle dystrophy might have contributed to the presence of myoglobin in BALF (Ho et al., 2004). Without treatment-related histological evidence of rhabdomyolysis in muscle tissues or its consequences in organs such as the kidneys—which might be causally linked to elevated circulating myoglobin levels (Rubio-Navarro et al., 2016)—the biological significance of this finding is unclear.
CS exposure delivers more than 6000 harmful compounds (Rodgman and Perfetti, 2013) that can directly or indirectly (eg, following cell damage) trigger an inflammatory response. The proinflammatory milieu, in turn, feeds into further amplifying the inflammatory reaction and ultimately results in the protease/antiprotease imbalance that contributes to the lung tissue destruction seen in COPD. This imbalance also promotes an immunosuppressive lung microenvironment and enhances cell proliferation, angiogenesis, antiapoptotic processes, and cellular transformation (Caramori et al., 2011; DiDonato et al., 2012; Houghton et al., 2010; Takahashi et al., 2010), thereby promoting the development of lung cancer. In this study, we observed accumulation of macrophages, neutrophils, and CD4+ and CD8+ lymphocytes in the lungs as well as significantly increased levels of inflammatory mediators in the BALF of CS-exposed mice, but not in that of THS 2.2 aerosol-exposed mice. This is consistent with data from other THS 2.2 studies in ApoE−/− mice (Phillips et al., 2016, 2019b) and Sprague Dawley rats (Oviedo et al., 2016; Wong et al., 2016).
Lung emphysematous changes were assessed by histopathological evaluation, lung function and volume measurements, and quantitative morphometric approaches. Although the lungs of THS 2.2 aerosol-exposed animals did not exhibit emphysematous changes, those of CS-exposed animals showed mild-to-moderate emphysema. This was accompanied by changes in lung function parameters characteristic of emphysematous changes as well as an approximately 30–50% increase in lung volume relative to the sham group; in contrast, there was no marked change in the THS 2.2 aerosol-exposed groups. The absence of emphysematous changes following long-term exposure to THS 2.2 aerosol is consistent with the findings of our past inhalation studies (Phillips et al., 2016, 2019b). Together, these results suggest a microenvironment in the lungs of THS 2.2 aerosol-exposed mice that lacks the major components of CS-induced inflammation (eg, immune cell infiltration, tissue remodeling, and protease/antiprotease imbalance), which culminate in emphysematous changes. Importantly, considering the mechanistic connection between COPD and lung cancer in smokers, the absence of a tumor-promoting environment in THS 2.2 aerosol-exposed mice could also point to a favorable lung cancer risk reduction potential of this candidate MRTP. Indeed, in this study, the histopathological findings of the lungs—in terms of lung tumor incidence, multiplicity, and load—in female THS 2.2 aerosol-exposed A/J mice point favorably to the lung cancer risk reduction potential of this candidate MRTP relative to cigarettes. The increased lung tumor burden in female A/J mice exposed to CS at 300 µg/l TPM for 18 months in this study was similar to that reported in previous studies (Stinn et al., 2013a,b; Supplementary Table 16). The small differences in multiplicity and incidences between the present and previous studies are most likely related to the slightly higher background of spontaneous bronchioloalveolar adenoma in the current study. Nodular hyperplasia remained at baseline levels in the CS-exposed mice. Interestingly, the incidence, multiplicity and load of nodular hyperplasia were lower in the female THS 2.2 (H) group compared with the sham group. A concentration dependent reduction in nodular hyperplasia incidence was observed in the THS2.2 female groups relative to the sham group. As past A/J mouse cancer studies indicated, stress related to CS exposure can have a negative influence on tumor progression (Curtin et al., 2004; Stinn et al., 2010), and we suspect stress due to high nicotine exposure may also have had a possible role here considering, eg, the reduced adrenal gland weights in the female animals. Alternatively, nicotine could have limited tumor progression via its action on the cholinergic anti-inflammatory pathway (Gao et al., 2011; Grando et al., 2012; Guinet et al., 2004).
In addition, the male sham group in the current study showed a lower incidence and multiplicity of bronchioloalveolar carcinoma but a higher incidence and multiplicity of bronchioloalveolar adenoma than the female sham group. These differences were likely related to the shorter study duration for the male mice (15 vs. 18 months) and emphasize that the progression of bronchioloalveolar adenoma to carcinoma requires time. The size of proliferative lesions consistently increased with their progression from nodular hyperplasia to bronchioloalveolar adenoma to bronchioloalveolar carcinoma in all CS exposure studies. In contrast, THS 2.2 aerosol exposure did not impact the size of the lung tumors. These lung tumor data are consistent with the significantly reduced levels of known carcinogens (such as nicotine-derived nitrosamine ketone [NNK], aldehydes, polyaromatic hydrocarbons, benzene, and acrylonitrile) in THS 2.2 aerosol (Schaller et al., 2016a) and the consequently lower uptake of these carcinogens in THS 2.2 aerosol-exposed animals, as indicated by the low levels of biomarkers of exposure in urine in the THS 2.2 groups in this study.
Because of the underlying predisposition of A/J mice to developing muscle-related pathologies (Brayton et al., 2012; Fanzani et al., 2013; Sher et al., 2011), we expected to observe progressive muscular dystrophy and rhabdomyosarcomas in this study. In fact, all treatment groups showed skeletal muscle neoplasias with overall low severity scores and small differences relative to the sham group. Therefore, the findings in this category are considered incidental and normal background findings in this mouse strain rather than a consequence of aerosol exposure.
Histopathological evaluation also showed a significant increase in the incidence of squamous cell carcinoma in the nonglandular stomach only in the 3R4F group relative to the sham group. Although tumors were present at low incidence in the THS 2.2 aerosol-exposed groups (not reaching statistical significance), there was no concentration dependent increase in their incidence. The A/J mouse strain is susceptible to the development of neoplasias of the forestomach in response to carcinogens such as benzo[a]pyrene and NNK (Prokopczyk et al., 2000; Singh et al., 1998; Wang et al., 1992). Neoplasia of the forestomach was frequently first detected as firm mass in the abdomen of the A/J mice after more than 1 year into the study. Possibly because of the long latency and very low incidence, increased incidence of squamous cell carcinoma of the stomach following CS exposure was not observed in past A/J inhalation studies (Stinn et al., 2013a,b). Other neoplasias were mostly sporadic and did not show exposure-related changes in incidence. These results suggest an extremely low (if not absent) carcinogenic potential of THS 2.2 aerosol relative to that of CS.
This study has several limitations. First, we did not include a male 3R4F group for comparison of exposure effects for reasons discussed in the Study Design section. It was, therefore, not possible to make a direct comparison of THS 2.2 aerosol- and CS-induced effects in male mice. This study also omitted the low- and medium-concentration THS 2.2 groups to reduce the number of animals used. However, comparison of the effects of THS 2.2 (H) aerosol exposure between male and female mice revealed an overall similar pattern of lung inflammation, emphysematous changes, and lung tumorigenesis. It is, therefore, expected that similar conclusions obtained in female mice would be valid in male mice as well. Second, in accordance with OECD test guideline 453, the study design was powered to meet the minimum animal numbers required for cancer endpoints at terminal dissection (n = 50 per group; OECD, 2018b). Although the planned size of 10 animals per group at interim dissections does not meet the minimum number of animals required for cancer endpoints, it is sufficient for assessing noncancer mechanistic endpoints in the study. Third, blood clotting data (PT and APTT) had to be excluded because of limited blood volume or blood clotting. Furthermore, interpretation of urinalysis results was hampered by technical issues because of fecal and/or feed contamination in the first 6-h collection period during exposure, direct deposition or excretion of unmetabolized nicotine in urine, and the physiological state (eg, stress) of animals that were individually housed in metabolic cages during urine collection. These technical issues were inevitable because of the way urine was collected in the study, and, therefore, the results of the urine dipstick tests were also excluded.
It is also worth noting here that, because of the use of lung volume as the reference volume in lung morphometric analysis, the increase in lung volume and, conversely, the volume of parenchyma observed in emphysematous lungs will artificially mask the decrease in alveolar air and septal volumes, but enhance the increase in duct and total air volumes. The same observation has been made in past studies involving CS exposure (Phillips et al., 2015b, 2016). Because there were no statistically significant differences in lung volume between the sham and THS 2.2 groups, the comparison of emphysema endpoints between these groups is not thought to be influenced by the changes in lung volume. Other limitations include the known drawbacks of this mouse strain, such as the high rate of spontaneous lung tumors in aging mice and the lack of reduction in lung cancer risk upon cessation of CS inhalation, which make this animal model of lung cancer unsuitable for modeling switching to an MRTP. Nevertheless, this study provides unique insights into the long-term effects of THS 2.2 aerosol exposure on the respiratory tract as well as its carcinogenic potential relative to CS exposure.
CONCLUSION
The only findings in common among mice exposed to THS 2.2 aerosol and CS were decreased thymus and spleen weight, blood lymphocyte counts, and serum cholesterol and triglyceride concentrations. These findings are expected in inhalation studies and most likely linked to stress related to the high nicotine concentration in the test atmosphere. THS 2.2 aerosol-exposed mice also showed an increase in adrenal gland weight. The extents of these changes were not significantly different from those in CS-exposed mice. All other nonrespiratory tract findings were considered to be background changes in the absence of obvious treatment-related changes. Additionally, lung inflammation, emphysema, and lung tumor incidence and multiplicity were not increased following long-term exposure of the A/J mice to THS 2.2 aerosol, even at double the nicotine concentration used in the 3R4F group and at a human equivalent dose of ca. 1–2 cigarette packs a day. Increased lung inflammation, emphysematous changes, and lung tumor development were observed only in CS-exposed mice. Further, the increased incidence of laryngeal papilloma noted in the 3R4F group was not observed in the THS 2.2 groups. Most of the CS exposure-related changes in the respiratory tract were absent in the THS 2.2 aerosol-exposed groups. When the THS 2.2 groups did show changes, they were significantly less severe and/or less advanced than those in the 3R4F group. The reduced biological impact of THS 2.2 aerosol exposure on tumor development and chronic respiratory toxicity is consistent with the significantly reduced levels of HPHCs in THS 2.2 aerosol and the lower uptake of HPHCs by the THS 2.2 aerosol-exposed animals in this study.
The totality of our results does not point to subchronic or chronic toxicity of THS 2.2 aerosol exposure in spite of nicotine exposure at up to twice the concentration in CS. The significantly reduced genotoxicity (Schaller et al., 2016a), and the absence of lung inflammation, and emphysematous changes upon chronic exposure to THS 2.2 aerosol collectively support its significantly lower lung tumorigenic potential.
SUPPLEMENTARY DATA
Supplementary data are available at Toxicological Sciences online.
Datasets, further details on the protocols, and additional data visualizations are available on the INTERVALS platform at https://doi.org/10.26126/intervals.3pcrrx.1 (last accessed 13 August 2020).
Supplementary Material
ACKNOWLEDGMENTS
We acknowledge the technical assistance and support of the Bioresearch, Aerosol, Veterinary, Facility, and Data Compliance Teams at Philip Morris International Research Laboratories Singapore. The flow cytometry assays were developed and optimized under the guidance of Dr Maciej Cabanski and Stefano Acali. We are grateful for the critical discussions and review of study documents, data, and manuscript by Drs Emilija Veljkovic, Michael Peck, Walter K. Schlage, Yi Shen, and Wei Teck Tan. We would like to say special thanks to Sindhoora Bhargavi Gopala Reddy for help with editing this article.
FUNDING
Philip Morris International (PMI).
DECLARATION OF CONFLICTING INTERESTS
THS 2.2 is a reduced-risk product (RRP) developed by PMI. All authors are (or were) employees of PMI or worked with PMI under contractual agreement.
Contributor Information
Ee Tsin Wong, PMI R&D, Philip Morris International Research Laboratories Pte. Ltd, Science Park II, Singapore 117406, Singapore.
Karsta Luettich, Department of Life Sciences, Systems Toxicology, PMI R&D, Philip Morris Products S.A, CH-2000 Neuchâtel, Switzerland.
Subash Krishnan, PMI R&D, Philip Morris International Research Laboratories Pte. Ltd, Science Park II, Singapore 117406, Singapore.
Sin Kei Wong, PMI R&D, Philip Morris International Research Laboratories Pte. Ltd, Science Park II, Singapore 117406, Singapore.
Wei Ting Lim, PMI R&D, Philip Morris International Research Laboratories Pte. Ltd, Science Park II, Singapore 117406, Singapore.
Demetrius Yeo, PMI R&D, Philip Morris International Research Laboratories Pte. Ltd, Science Park II, Singapore 117406, Singapore.
Ansgar Büttner, Histovia GmbH, 51491 Overath, Germany.
Patrice Leroy, PMI R&D, Philip Morris International Research Laboratories Pte. Ltd, Science Park II, Singapore 117406, Singapore.
Grégory Vuillaume, PMI R&D, Philip Morris International Research Laboratories Pte. Ltd, Science Park II, Singapore 117406, Singapore.
Stéphanie Boué, PMI R&D, Philip Morris International Research Laboratories Pte. Ltd, Science Park II, Singapore 117406, Singapore.
Julia Hoeng, PMI R&D, Philip Morris International Research Laboratories Pte. Ltd, Science Park II, Singapore 117406, Singapore.
Patrick Vanscheeuwijck, PMI R&D, Philip Morris International Research Laboratories Pte. Ltd, Science Park II, Singapore 117406, Singapore.
Manuel C Peitsch, PMI R&D, Philip Morris International Research Laboratories Pte. Ltd, Science Park II, Singapore 117406, Singapore.
REFERENCES
- Adcock I. M., Caramori G., Barnes P. J. (2011). Chronic obstructive pulmonary disease and lung cancer: New molecular insights. Respiration 81, 265–284. [DOI] [PubMed] [Google Scholar]
- Akbay E. A., Kim J. (2018). Autochthonous murine models for the study of smoker and never-smoker associated lung cancers. Transl. Lung Cancer Res. 7, 464–486. [DOI] [PMC free article] [PubMed] [Google Scholar]
- Asgharian B., Price O. T., Oldham M., Chen L. C., Saunders E. L., Gordon T., Mikheev V. B., Minard K. R., Teeguarden J. G. (2014). Computational modeling of nanoscale and microscale particle deposition, retention and dosimetry in the mouse respiratory tract. Inhal. Toxicol. 26, 829–842. [DOI] [PMC free article] [PubMed] [Google Scholar]
- Bailey S. M., Mantena S. K., Millender-Swain T., Cakir Y., Jhala N. C., Chhieng D., Pinkerton K. E., Ballinger S. W. (2009). Ethanol and tobacco smoke increase hepatic steatosis and hypoxia in the hypercholesterolemic ApoE −/− mouse: Implications for a “multihit” hypothesis of fatty liver disease. Free Radic. Biol. Med. 46, 928–938. [DOI] [PMC free article] [PubMed] [Google Scholar]
- Balakrishnan A., Menon V. P. (2007). Protective effect of hesperidin on nicotine induced toxicity in rats. Indian J. Exp. Biol. 45, 194–202. [PubMed] [Google Scholar]
- Bendele A., Carlton W. (1986). Incidence of obstructive uropathy in male b6c3f1 mice on a 24-month carcinogenicity study and its apparent prevention by ochratoxin A. Lab. Anim. Sci. 36, 282–285. [PubMed] [Google Scholar]
- Bogue M. A., Grubb S. C., Walton D. O., Philip V. M., Kolishovski G., Stearns T., Dunn M. H., Skelly D. A., Kadakkuzha B., TeHennepe G., et al. (2018). Mouse phenome database: An integrative database and analysis suite for curated empirical phenotype data from laboratory mice. Nucleic Acids Res. 46, D843–D850. [DOI] [PMC free article] [PubMed] [Google Scholar]
- Boué S., De León H., Schlage W. K., Peck M. J., Weiler H., Berges A., Vuillaume G., Martin F., Friedrichs B., Lebrun S., et al. (2013). Cigarette smoke induces molecular responses in respiratory tissues of ApoE−/− mice that are progressively deactivated upon cessation. Toxicology 314, 112–124. [DOI] [PubMed] [Google Scholar]
- Brayton C., Treuting P., Ward J. (2012). Pathobiology of aging mice and gem background strains and experimental design. Vet. Pathol. 49, 85–105. [DOI] [PubMed] [Google Scholar]
- Burger G. T., Renne R. A., Sagartz J. W., Ayres P. H., Coggins C. R., Mosberg A. T., Hayes A. W. (1989). Histologic changes in the respiratory tract induced by inhalation of xenobiotics: Physiologic adaptation or toxicity? Toxicol. Appl. Pharmacol. 101, 521–542. [DOI] [PubMed] [Google Scholar]
- Cabanski M., Fields B., Boue S., Boukharov N., DeLeon H., Dror N., Geertz M., Guedj E., Iskandar A., Kogel U., et al. (2015). Transcriptional profiling and targeted proteomics reveals common molecular changes associated with cigarette smoke-induced lung emphysema development in five susceptible mouse strains. Inflamm. Res. 64, 471–486. [DOI] [PMC free article] [PubMed] [Google Scholar]
- Caramori G., Casolari P., Cavallesco G. N., Giuffre S., Adcock I., Papi A. (2011). Mechanisms involved in lung cancer development in COPD. Int. J. Biochem. Cell Biol. 43, 1030–1044. [DOI] [PubMed] [Google Scholar]
- CDER. (2005). Guidance for Industry: Estimating the Maximum Safe Starting Dose in Initial Clinical Trials for Theraperutics in Adult Healthy Volunteers Food and Drug Administration. U.S. Department of Health and Human Services. Food and Drug Administration. Center for Drug Evaluation and Research, pp. 1–27. [Google Scholar]
- Chase T. H., Cox G. A., Burzenski L., Foreman O., Shultz L. D. (2009). Dysferlin deficiency and the development of cardiomyopathy in a mouse model of limb-girdle muscular dystrophy 2B. Am. J. Pathol. 175, 2299–2308. [DOI] [PMC free article] [PubMed] [Google Scholar]
- Chowdhury P. (1990). Endocrine and metabolic regulation of body mass by nicotine: Role of growth hormone. Ann. Clin. Lab. Sci. 20, 415–419. [PubMed] [Google Scholar]
- Clarke P. B., Kumar R. (1984). Some effects of nicotine on food and water intake in undeprived rats. Br. J. Pharmacol. 82, 233–239. [DOI] [PMC free article] [PubMed] [Google Scholar]
- Coggins C. R. (1998). A review of chronic inhalation studies with mainstream cigarette smoke in rats and mice. Toxicol. Pathol. 26, 307–314. [DOI] [PubMed] [Google Scholar]
- Cramer D. V., Gill I. I. T. III. (1975). Genetics of urogenital abnormalities in ACI inbred rats. Teratology 12, 27–32. [DOI] [PubMed] [Google Scholar]
- Curtin G. M., Higuchi M. A., Ayres P. H., Swauger J. E., Mosberg A. T. (2004). Lung tumorigenicity in A/J and rasH2 transgenic mice following mainstream tobacco smoke inhalation. Toxicol. Sci. 81, 26–34. [DOI] [PubMed] [Google Scholar]
- DiDonato J. A., Mercurio F., Karin M. (2012). NF-kappaB and the link between inflammation and cancer. Immunol. Rev. 246, 379–400. [DOI] [PubMed] [Google Scholar]
- Dungworth D. L. Rittinghausen S. Schwartz L. Harkema J. R. Hayashi Y. Kittel B. Lewis D Miller R. A. Mohr U. Rehm S., et al. (2001). Respiratory system and mesothelium. In International classification of rodent, the mouse tumors (U. Mohr, Ed.), pp. 87–139. [Google Scholar]
- Everds N. E., Snyder P. W., Bailey K. L., Bolon B., Creasy D. M., Foley G. L., Rosol T. J., Sellers T. (2013). Interpreting stress responses during routine toxicity studies: A review of the biology, impact, and assessment. Toxicol. Pathol. 41, 560–614. [DOI] [PubMed] [Google Scholar]
- Fanzani A., Monti E., Donato R., Sorci G. (2013). Muscular dystrophies share pathogenetic mechanisms with muscle sarcomas. Trends Mol. Med. 19, 546–554. [DOI] [PubMed] [Google Scholar]
- Flonta S. E., Arena S., Pisacane A., Michieli P., Bardelli A. (2009). Expression and functional regulation of myoglobin in epithelial cancers. Am. J. Pathol. 175, 201–206. [DOI] [PMC free article] [PubMed] [Google Scholar]
- Fraser J., de Mello L. V., Ward D., Rees H. H., Williams D. R., Fang Y., Fang Y., Brass A., Gracey A. Y., Cossins A. R. (2006). Hypoxia-inducible myoglobin expression in nonmuscle tissues. Proc. Natl. Acad. Sci. U.S.A. 103, 2977–2981. [DOI] [PMC free article] [PubMed] [Google Scholar]
- Friedman T. C., Sinha-Hikim I., Parveen M., Najjar S. M., Liu Y., Mangubat M., Shin C.-S., Lyzlov A., Ivey R., Shaheen M., et al. (2012). Additive effects of nicotine and high-fat diet on hepatic steatosis in male mice. Endocrinology 153, 5809–5820. [DOI] [PMC free article] [PubMed] [Google Scholar]
- Gao F. G., Li H. T., Li Z. J., Gu J. R. (2011). Nicotine stimulated dendritic cells could achieve anti-tumor effects in mouse lung and liver cancer. J. Clin. Immunol. 31, 80–88. [DOI] [PubMed] [Google Scholar]
- Gonzalez-Suarez I., Martin F., Marescotti D., Guedj E., Acali S., Johne S., Dulize R., Baumer K., Peric D., Goedertier D., et al. (2016). In vitro systems toxicology assessment of a candidate modified risk tobacco product shows reduced toxicity compared to that of a conventional cigarette. Chem. Res. Toxicol. 29, 3–18. [DOI] [PubMed] [Google Scholar]
- Grando S. A., Kawashima K., Kirkpatrick C. J., Meurs H., Wessler I. (2012). The non-neuronal cholinergic system: Basic science, therapeutic implications and new perspectives. Life Sci. 91, 969–972. [DOI] [PubMed] [Google Scholar]
- Grunberg N., Winders S., Popp K. (1987). Sex differences in nicotine’s effects on consummatory behavior and body weight in rats. Psychopharmacology 91, 221–225. [DOI] [PubMed] [Google Scholar]
- Guinet E., Yoshida K., Nouri-Shirazi M. (2004). Nicotinic environment affects the differentiation and functional maturation of monocytes derived dendritic cells (DCS). Immunol. Lett. 95, 45–55. [DOI] [PubMed] [Google Scholar]
- Gundersen H. J., Jensen E. B., Kieu K., Nielsen J. (1999). The efficiency of systematic sampling in stereology–reconsidered. J. Microsc. 193, 199–211. [DOI] [PubMed] [Google Scholar]
- Han R., Bansal D., Miyake K., Muniz V. P., Weiss R. M., McNeil P. L., Campbell K. P. (2007). Dysferlin-mediated membrane repair protects the heart from stress-induced left ventricular injury. J. Clin. Invest. 117, 1805–1813. [DOI] [PMC free article] [PubMed] [Google Scholar]
- Helen A., Vijayammal P. L. (1997). Vitamin c supplementation on hepatic oxidative stress induced by cigarette smoke. J. Appl. Toxicol. 17, 289–295. [DOI] [PubMed] [Google Scholar]
- Ho M., Post C. M., Donahue L. R., Lidov H. G., Bronson R. T., Goolsby H., Watkins S. C., Cox G. A., Brown R. H. Jr. (2004). Disruption of muscle membrane and phenotype divergence in two novel mouse models of dysferlin deficiency. Hum. Mol. Genet. 13, 1999–2010. [DOI] [PubMed] [Google Scholar]
- Hoeng J., Maeder S., Vanscheeuwijck P., Peitsch M. C. (2019). Assessing the lung cancer risk reduction potential of candidate modified risk tobacco products. Intern. Emerg. Med. 14, 821–834. [DOI] [PMC free article] [PubMed] [Google Scholar]
- Horton C. E., Davisson M. T., Jacobs J. B., Bernstein G. T., Retik A. B., Mandell J. (1988). Congenital progressive hydronephrosis in mice: A new recessive mutation. J. Urol. 140, 1310–1315. [DOI] [PubMed] [Google Scholar]
- Houghton A. M. (2018). Common mechanisms linking chronic obstructive pulmonary disease and lung cancer. Ann. Am. Thorac. Soc. 15, S273–S277. [DOI] [PMC free article] [PubMed] [Google Scholar]
- Houghton A. M., Rzymkiewicz D. M., Ji H., Gregory A. D., Egea E. E., Metz H. E., Stolz D. B., Land S. R., Marconcini L. A., Kliment C. R., et al. (2010). Neutrophil elastase-mediated degradation of IRS-1 accelerates lung tumor growth. Nat. Med. 16, 219–223. [DOI] [PMC free article] [PubMed] [Google Scholar]
- Hsia C. C., Hyde D. M., Ochs M., Weibel E. R.; ATS/ERS Joint Task Force on Quantitative Assessment of Lung Structure. (2010). An official research policy statement of the American thoracic society/European respiratory society: Standards for quantitative assessment of lung structure. Am. J. Respir. Crit. Care Med. 181, 394–418. [DOI] [PMC free article] [PubMed] [Google Scholar]
- Iida T., Ono K., Inagaki T., Hosokawa R., Inenaga K. (2011). Nicotinic receptor agonist-induced salivation and its cellular mechanism in parotid acini of rats. Auton. Neurosci. 161, 81–86. [DOI] [PubMed] [Google Scholar]
- Institute of Medicine. (2012). Scientific Standards for Studies on Modified Risk Tobacco Products. The National Academies Press, Washington, DC. [Google Scholar]
- Iranloye B., Bolarinwa A. (2009). Effect of nicotine administration on weight and histology of some vital visceral organs in female albino rats. Niger. J. Physiol. Sci. 24, [DOI] [PubMed] [Google Scholar]
- Iskandar A. R., Martinez Y., Martin F., Schlage W. K., Leroy P., Sewer A., Torres L. O., Majeed S., Merg C., Trivedi K., et al. (2017. a). Comparative effects of a candidate modified-risk tobacco product aerosol and cigarette smoke on human organotypic small airway cultures: A systems toxicology approach. Toxicol. Res. 6, 930–946. [DOI] [PMC free article] [PubMed] [Google Scholar]
- Iskandar A. R., Mathis C., Schlage W. K., Frentzel S., Leroy P., Xiang Y., Sewer A., Majeed S., Ortega-Torres L., Johne S., et al. (2017. b). A systems toxicology approach for comparative assessment: Biological impact of an aerosol from a candidate modified-risk tobacco product and cigarette smoke on human organotypic bronchial epithelial cultures. Toxicol. In Vitro 39, 29–51. [DOI] [PubMed] [Google Scholar]
- ISO3402. (1999). Tobacco and Tobacco Products - Atmospheres for Conditioning and Testing. International Organization for Standardization, Geneva. [Google Scholar]
- Kogel U., Schlage W. K., Martin F., Xiang Y., Ansari S., Leroy P., Vanscheeuwijck P., Gebel S., Buettner A., Wyss C., et al. (2014). A 28-day rat inhalation study with an integrated molecular toxicology endpoint demonstrates reduced exposure effects for a prototypic modified risk tobacco product compared with conventional cigarettes. Food Chem. Toxicol. 68, 204–217. [DOI] [PubMed] [Google Scholar]
- Latha M. S., Vijayammal P. L., Kurup P. A. (1993). Effect of nicotine administration on lipid metabolism in rats. Indian J. Med. Res. 98, 44–49. [PubMed] [Google Scholar]
- Linhart I., Frantík E., Vodicková L., Vosmanská M., Smejkal J., Mitera J. (1996). Biotransformation of acrolein in rat: Excretion of mercapturic acids after inhalation and intraperitoneal injection. Toxicol. Appl. Pharmacol. 136, 155–160. [DOI] [PubMed] [Google Scholar]
- Luettich K., Xiang Y., Iskandar A., Sewer A., Martin F., Talikka M., Vanscheeuwijck P., Berges A., Veljkovic E., Gonzalez-Suarez I., et al. (2014). Systems toxicology approaches enable mechanistic comparison of spontaneous and cigarette smoke-related lung tumor development in the A/J mouse model. Interdiscip. Toxicol. 7, 73–84. [DOI] [PMC free article] [PubMed] [Google Scholar]
- Maddatu T. P., Grubb S. C., Bult C. J., Bogue M. A. (2012). Mouse phenome database (MPD). Nucleic Acids Res. 40, D887–D894. [DOI] [PMC free article] [PubMed] [Google Scholar]
- Mallock N., Böss L., Burk R., Danziger M., Welsch T., Hahn H., Trieu H.-L., Hahn J., Pieper E., Henkler-Stephani F., et al. (2018). Levels of selected analytes in the emissions of “heat not burn” tobacco products that are relevant to assess human health risks. Arch. Toxicol. 92, 2145–2149. [DOI] [PMC free article] [PubMed] [Google Scholar]
- Mohammadghasemi F., Jahromi S. K., Hajizadeh H., Homafar M. A., Saadat N. (2012). The protective effects of exogenous melatonin on nicotine-induced changes in mouse ovarian follicles. J. Reprod. Infertil. 13, 143. [PMC free article] [PubMed] [Google Scholar]
- NACLAR. (2004). National Advisory Committee for Laboratory Animal Research: Guidelines on the Care and Use of Animals for Scientific Purposes Available at: https://www.nparks.gov.sg/-/media/avs/migrated-content/animals-and-pets/animal-health-and-veterinarians/naclar-guidelines.pdf. Accessed August 16, 2020.
- Nemmar A., Raza H., Subramaniyan D., John A., Elwasila M., Ali B. H., Adeghate E. (2012). Evaluation of the pulmonary effects of short-term nose-only cigarette smoke exposure in mice. Exp. Biol. Med. 237, 1449–1456. [DOI] [PubMed] [Google Scholar]
- Nikitin A. Y., Alcaraz A., Anver M. R., Bronson R. T., Cardiff R. D., Dixon D., Fraire A. E., Gabrielson E. W., Gunning W. T., Haines D. C., et al. (2004). Classification of proliferative pulmonary lesions of the mouse: Recommendations of the mouse models of human cancers consortium. Cancer Res. 64, 2307–2316. [DOI] [PubMed] [Google Scholar]
- Ochs M., Mühlfeld C. (2013). Quantitative microscopy of the lung: A problem-based approach. Part 1: Basic principles of lung stereology. Am. J. Physiol. Lung Cell. Mol. Physiol. 305, L15–22. [DOI] [PubMed] [Google Scholar]
- OECD. (1997). OECD Test Guideline 1: OECD series on principles of good laboratory practice and compliance monitoring. OECD Publishing, Paris. [PubMed]
- OECD. (2012). Guidance document 116 on the conduct and design of chronic toxicity and carcinogenicity studies, supporting test guidelines 451, 452 and 453. OECD Publishing, Paris. [Google Scholar]
- OECD. (2018. a). Guidance document on inhalation toxicity studies. Series on testing and assessment. OECD Guidance Document No 39. OECD Publishing, Paris.
- OECD. (2018. b). OECD test guideline 453: Combined chronic toxicity/carcinogenicity studies. OECD Publishing, Paris.
- Oleksiewicz U., Daskoulidou N., Liloglou T., Tasopoulou K., Bryan J., Gosney J. R., Field J. K., Xinarianos G. (2011). Neuroglobin and myoglobin in non-small cell lung cancer: Expression, regulation and prognosis. Lung Cancer 74, 411–418. [DOI] [PubMed] [Google Scholar]
- Ongwandee M., Sawanyapanich P. (2012). Influence of relative humidity and gaseous ammonia on the nicotine sorption to indoor materials. Indoor Air 22, 54–63. [DOI] [PubMed] [Google Scholar]
- Oviedo A., Lebrun S., Kogel U., Ho J., Tan W. T., Titz B., Leroy P., Vuillaume G., Bera M., Martin F., et al. (2016). Evaluation of the tobacco heating system 2.2. Part 6: 90-day OECD 413 rat inhalation study with systems toxicology endpoints demonstrates reduced exposure effects of a mentholated version compared with mentholated and non-mentholated cigarette smoke. Regul. Toxicol. Pharmacol. 81, S93–S122. [DOI] [PubMed] [Google Scholar]
- Paixão L. L., Gaspar-Reis R. P., Gonzalez G. P., Santos A. S., Santana A. C., Santos R. M., Spritzer P. M., Nascimento-Saba C. C. A. (2012). Cigarette smoke impairs granulosa cell proliferation and oocyte growth after exposure cessation in young Swiss mice: An experimental study. J. Ovarian Res. 5, 25. [DOI] [PMC free article] [PubMed] [Google Scholar]
- Petrick L., Destaillats H., Zouev I., Sabach S., Dubowski Y. (2010). Sorption, desorption, and surface oxidative fate of nicotine. Phys. Chem. Chem. Phys. 12, 10356–10364. [DOI] [PubMed] [Google Scholar]
- Phillips B. (2016). 90-Day OECD inhalation study to characterize toxicity of inhaled propylene glycol, glycerin, and nicotine aerosols in sprague-dawley rats. PMIRL-Singapore Study Report 15030.
- Phillips B., Esposito M., Verbeeck J., Boué S., Iskandar A., Vuillaume G., Leroy P., Krishnan S., Kogel U., Utan A., et al. (2015. a). Toxicity of aerosols of nicotine and pyruvic acid (separate and combined) in Sprague-Dawley rats in a 28-day OECD 412 inhalation study and assessment of systems toxicology. Inhal. Toxicol. 27, 405–431. [DOI] [PubMed] [Google Scholar]
- Phillips B., Szostak J., Titz B., Schlage W. K., Guedj E., Leroy P., Vuillaume G., Martin F., Buettner A., Elamin A., et al. (2019. a). A six-month systems toxicology inhalation/cessation study in ApoE−/− mice to investigate cardiovascular and respiratory exposure effects of modified risk tobacco products, CHTP 1.2 and THS 2.2, compared with conventional cigarettes. Food Chem. Toxicol. 126, 113–141. [DOI] [PubMed] [Google Scholar]
- Phillips B., Szostak J., Titz B., Schlage W. K., Guedj E., Leroy P., Vuillaume G., Martin F., Buettner A., Elamin A., et al. (2019. b). A six-month systems toxicology inhalation/cessation study in ApoE(-/-) mice to investigate cardiovascular and respiratory exposure effects of modified risk tobacco products, CHTP 1.2 and THS 2.2, compared with conventional cigarettes. Food Chem. Toxicol. 126, 113–141. [DOI] [PubMed] [Google Scholar]
- Phillips B., Titz B., Kogel U., Sharma D., Leroy P., Xiang Y., Vuillaume G., Lebrun S., Sciuscio D., Ho J., et al. (2017). Toxicity of the main electronic cigarette components, propylene glycol, glycerin, and nicotine, in Sprague-Dawley rats in a 90-day OECD inhalation study complemented by molecular endpoints. Food Chem. Toxicol. 109, 315–332. [DOI] [PubMed] [Google Scholar]
- Phillips B., Veljkovic E., Boue S., Schlage W. K., Vuillaume G., Martin F., Titz B., Leroy P., Buettner A., Elamin A., et al. (2016). An 8-month systems toxicology inhalation/cessation study in ApoE-/- mice to investigate cardiovascular and respiratory exposure effects of a candidate modified risk tobacco product, THS 2.2, compared with conventional cigarettes. Toxicol. Sci. 149, 411–432. [DOI] [PMC free article] [PubMed] [Google Scholar]
- Phillips B., Veljkovic E., Peck M. J., Buettner A., Elamin A., Guedj E., Vuillaume G., Ivanov N. V., Martin F., Boue S., et al. (2015. b). A 7-month cigarette smoke inhalation study in C57BL/6 mice demonstrates reduced lung inflammation and emphysema following smoking cessation or aerosol exposure from a prototypic modified risk tobacco product. Food Chem. Toxicol. 80, 328–345. [DOI] [PubMed] [Google Scholar]
- Pratte P., Cosandey S., Goujon Ginglinger C. (2017). Investigation of solid particles in the mainstream aerosol of the tobacco heating system THS2.2 and mainstream smoke of a 3R4F reference cigarette. Hum. Exp. Toxicol. 36, 1115–1120. [DOI] [PMC free article] [PubMed] [Google Scholar]
- Pratte P., Cosandey S., Goujon Ginglinger C. (2018). Innovative methodology based on thermo-denuder principle for the detection of combustion related solid particles or high boiling point droplets: Applications to cigarette and the tobacco heating system THS 2.2. J. Aerosol Sci. 120, 52–61. [Google Scholar]
- Prokopczyk B. Rosa J. G. Desai D. Amin S. Sohn O. S. Fiala E. S. El-Bayoumy K. (2000). Chemoprevention of lung tumorigenesis induced by a mixture of benzo( a )pyrene and 4-(methylnitrosamino)-1-(3-pyridyl)-1-butanone by the organoselenium compound 1,4-phenylenebis(methylene)selenocyanate. Cancer Lett. 161, 35–46. [DOI] [PubMed] [Google Scholar]
- Reagan-Shaw S., Nihal M., Ahmad N. (2008). Dose translation from animal to human studies revisited. FASEB J. 22, 659–661. [DOI] [PubMed] [Google Scholar]
- Reiche E. M. V., Nunes S. O. V., Morimoto H. K. (2004). Stress, depression, the immune system, and cancer. Lancet Oncol. 5, 617–625. [DOI] [PubMed] [Google Scholar]
- Renne R., Brix A., Harkema J., Herbert R., Kittel B., Lewis D., March T., Nagano K., Pino M., Rittinghausen S., et al. (2009). Proliferative and nonproliferative lesions of the rat and mouse respiratory tract. Toxicol. Pathol. 37, 5S–73S. [DOI] [PubMed] [Google Scholar]
- Rodgman A., Perfetti T. A. (2013). The Chemical Components of Tobacco and Tobacco Smoke. CRC Press, Boca Raton, FL. [Google Scholar]
- Roemer E., Schramke H., Weiler H., Buettner A., Kausche S., Weber S., Berges A., Stueber M., Muench M., Trelles-Sticken E., et al. (2012). Mainstream smoke chemistry and in vitro and in vivo toxicity of the reference cigarettes 3R4F and 2R4F. Beiträge Zur Tabakforschung International/Contributions to Tobacco Research 25, 316–335. [Google Scholar]
- Rubio-Navarro A., Carril M., Padro D., Guerrero-Hue M., Tarin C., Samaniego R., Cannata P., Cano A., Villalobos J. M., Sevillano A. M., et al. (2016). CD163-macrophages are involved in rhabdomyolysis-induced kidney injury and may be detected by MRI with targeted gold-coated iron oxide nanoparticles. Theranostics 6, 896–914. [DOI] [PMC free article] [PubMed] [Google Scholar]
- Sadeu J., Foster W. G. (2011). Effect of in vitro exposure to benzo [a] pyrene, a component of cigarette smoke, on folliculogenesis, steroidogenesis and oocyte nuclear maturation. Reprod. Toxicol. 31, 402–408. [DOI] [PubMed] [Google Scholar]
- Schaller J. P., Keller D., Poget L., Pratte P., Kaelin E., McHugh D., Cudazzo G., Smart D., Tricker A. R., Gautier L., et al. (2016. a). Evaluation of the tobacco heating system 2.2. Part 2: Chemical composition, genotoxicity, cytotoxicity, and physical properties of the aerosol. Regul. Toxicol. Pharmacol. 81, S27–S47. [DOI] [PubMed] [Google Scholar]
- Schaller J. P., Pijnenburg J. P., Ajithkumar A., Tricker A. R. (2016. b). Evaluation of the tobacco heating system 2.2. Part 3: Influence of the tobacco blend on the formation of harmful and potentially harmful constituents of the tobacco heating system 2.2 aerosol. Regul. Toxicol. Pharmacol. 81, S48–S58. [DOI] [PubMed] [Google Scholar]
- Scherle W. (1970). A simple method for volumetry of organs in quantitative stereology. Mikroskopie 26, 57–60. [PubMed] [Google Scholar]
- SciReq. Flexivent. Techniques and measurements. Available at: https://www.scireq.com/flexivent/techniques-and-measurements/. Accessed August 17, 2020.
- Shein M., Jeschke G. (2019). Comparison of free radical levels in the aerosol from conventional cigarettes, electronic cigarettes, and heat-not-burn tobacco products. Chem. Res. Toxicol. 32, 1289–1298. [DOI] [PMC free article] [PubMed] [Google Scholar]
- Sher R. B., Cox G. A., Mills K. D., Sundberg J. P. (2011). Rhabdomyosarcomas in aging A/J mice. PLoS One 6, e23498. [DOI] [PMC free article] [PubMed] [Google Scholar]
- Shoji R., Harata M. (1977). Abnormal urogenital organs occurring spontaneously in inbred ACI and kyoto-notched rats. Lab. Anim. 11, 247–249. [DOI] [PubMed] [Google Scholar]
- Singh S. V. Benson P. J. Hu X. Pal A. Xia H. Srivastava S. K. Awasthi S. Zaren H. A. Orchard J. L. Awasthi Y. C. (1998). Gender-related differences in susceptibility of A/J mouse to benzo[a]pyrene-induced pulmonary and forestomach tumorigenesis. Cancer Lett. 128, 197–204. [DOI] [PubMed] [Google Scholar]
- Smith M. R., Clark B., Ludicke F., Schaller J. P., Vanscheeuwijck P., Hoeng J., Peitsch M. C. (2016). Evaluation of the tobacco heating system 2.2. Part 1: Description of the system and the scientific assessment program. Regul. Toxicol. Pharmacol. 81, S17–S26. [DOI] [PubMed] [Google Scholar]
- Sokoloff L., Barile M. F. (1962). Obstructive genitourinary disease in male STR/1N mice. Am. J. Pathol. 41, 233. [PMC free article] [PubMed] [Google Scholar]
- Sopori M. (2002). Effects of cigarette smoke on the immune system. Nat. Rev. Immunol. 2, 372–377. [DOI] [PubMed] [Google Scholar]
- Stevens J. F., Maier C. S. (2008). Sources, metabolism, and biomolecular interactions relevant to human health and disease. Mol. Nutr. Food Res. 52, 7–25. [DOI] [PMC free article] [PubMed] [Google Scholar]
- Stinn W., Arts J. H., Buettner A., Duistermaat E., Janssens K., Kuper C. F., Haussmann H. J. (2010). Murine lung tumor response after exposure to cigarette mainstream smoke or its particulate and gas/vapor phase fractions. Toxicology 275, 10–20. [DOI] [PubMed] [Google Scholar]
- Stinn W., Berges A., Meurrens K., Buettner A., Gebel S., Lichtner R. B., Janssens K., Veljkovic E., Xiang Y., Roemer E., et al. (2013. a). Towards the validation of a lung tumorigenesis model with mainstream cigarette smoke inhalation using the A/J mouse. Toxicology 305, 49–64. [DOI] [PubMed] [Google Scholar]
- Stinn W., Buettner A., Weiler H., Friedrichs B., Luetjen S., van Overveld F., Meurrens K., Janssens K., Gebel S., Stabbert R., et al. (2013. b). Lung inflammatory effects, tumorigenesis, and emphysema development in a long-term inhalation study with cigarette mainstream smoke in mice. Toxicol. Sci. 131, 596–611. [DOI] [PMC free article] [PubMed] [Google Scholar]
- Stinn W., Teredesai A., Kuhl P., Knorr-Wittmann C., Kindt R., Coggins C., Haussmann H. J. (2005). Mechanisms involved in A/J mouse lung tumorigenesis induced by inhalation of an environmental tobacco smoke surrogate. Inhal. Toxicol. 17, 263–276. [DOI] [PubMed] [Google Scholar]
- Sundar I. K., Yao H., Huang Y., Lyda E., Sime P. J., Sellix M. T., Rahman I. (2014). Serotonin and corticosterone rhythms in mice exposed to cigarette smoke and in patients with COPD: Implication for COPD-associated neuropathogenesis. PloS One 9, e87999. [DOI] [PMC free article] [PubMed] [Google Scholar]
- Sundberg J. P., Berndt A., Sundberg B. A., Silva K. A., Kennedy V., Smith R. S., Cooper T. K., Schofield P. N. (2016). Approaches to investigating complex genetic traits in a large-scale inbred mouse aging study. Vet. Pathol. 53, 456–467. [DOI] [PMC free article] [PubMed] [Google Scholar]
- Takahashi H., Ogata H., Nishigaki R., Broide D. H., Karin M. (2010). Tobacco smoke promotes lung tumorigenesis by triggering IKKbeta- and JNK1-dependent inflammation. Cancer Cell 17, 89–97. [DOI] [PMC free article] [PubMed] [Google Scholar]
- Thorne D., Breheny D., Proctor C., Gaca M. (2018). Assessment of novel tobacco heating product THP1.0. Part 7: Comparative in vitro toxicological evaluation. Regul. Toxicol. Pharmacol. 93, 71–83. [DOI] [PubMed] [Google Scholar]
- Titz B., Sewer A., Luettich K., Wong E. T., Guedj E., Nury C., Xiang Y., Trivedi K., Vuillaume G., Leroy P., et al. (2020). Combined chronic toxicity and carcinogenicity of aerosol from a heated tobacco product. Part 4: Respiratory effects of exposure to aerosol from the candidate modified-risk tobacco product THS 2.2 in an 18-month systems toxicology study with A/J mice. Toxicol. Sci. doi: 10.1093/toxsci/kfaa132. [DOI] [PMC free article] [PubMed]
- Tuttle A. M., Stämpfli M., Foster W. G. (2009). Cigarette smoke causes follicle loss in mice ovaries at concentrations representative of human exposure. Hum. Reprod. 24, 1452–1459. [DOI] [PubMed] [Google Scholar]
- University of Kentucky Tobacco Research and Development Center: Reference Cigarettes. University of Kentucky. (2003). Available at: https://ctrp.uky.edu/products/gallery/Reference%2520Cigarettes. Accessed August 17, 2020.
- Vanscheeuwijck P. M., Teredesai A., Terpstra P. M., Verbeeck J., Kuhl P., Gerstenberg B., Gebel S., Carmines E. L. (2002). Evaluation of the potential effects of ingredients added to cigarettes. Part 4: Subchronic inhalation toxicity. Food Chem. Toxicol. 40, 113–131. [DOI] [PubMed] [Google Scholar]
- Wang Z. Y. Agarwal R. Khan W. A. Mukhtar H. (1992). Protection against benzo[ α ]pyrene- and N-nitrosodiethylamineinduced lung and forestomach tumorigenesis in A/J mice by water extracts of green tea and licorice. Carcinogenesis 13, 1491–1494. [DOI] [PubMed] [Google Scholar]
- Wenzel K., Geier C., Qadri F., Hubner N., Schulz H., Erdmann B., Gross V., Bauer D., Dechend R., Dietz R., et al. (2007). Dysfunction of dysferlin-deficient hearts. J. Mol. Med. 85, 1203–1214. [DOI] [PubMed] [Google Scholar]
- WHO. (2008). The scientific basis of tobacco product regulation. World Health Organ. Tech. Rep. Ser. 951, 1–277. [PubMed] [Google Scholar]
- Witschi H., Espiritu I., Dance S. T., Miller M. S. (2002). A mouse lung tumor model of tobacco smoke carcinogenesis. Toxicol. Sci. 68, 322–330. [DOI] [PubMed] [Google Scholar]
- Witschi H., Espiritu I., Uyeminami D., Suffia M., Pinkerton K. E. (2004). Lung tumor response in strain a mice exposed to tobacco smoke: Some dose-effect relationships. Inhal. Toxicol. 16, 27–32. [DOI] [PubMed] [Google Scholar]
- Wittenberg J. B., Wittenberg B. A. (2003). Myoglobin function reassessed. J. Exp. Biol. 206(Pt 12), 2011–2020. [DOI] [PubMed] [Google Scholar]
- Wong E. T., Kogel U., Veljkovic E., Martin F., Xiang Y., Boue S., Vuillaume G., Leroy P., Guedj E., Rodrigo G., et al. (2016). Evaluation of the tobacco heating system 2.2. Part 4: 90-day OECD 413 rat inhalation study with systems toxicology endpoints demonstrates reduced exposure effects compared with cigarette smoke. Regul. Toxicol. Pharmacol. 81, S59–S81. [DOI] [PubMed] [Google Scholar]
- Zanetti F., Sewer A., Mathis C., Iskandar A. R., Kostadinova R., Schlage W. K., Leroy P., Majeed S., Guedj E., Trivedi K., et al. (2016). Systems toxicology assessment of the biological impact of a candidate modified risk tobacco product on human organotypic oral epithelial cultures. Chem. Res. Toxicol. 29, 1252–1269. [DOI] [PubMed] [Google Scholar]
- Zheng L., Park J., Walls M., Tully M., Jannasch A., Cooper B., Shi R. (2013). Determination of urine 3-hpma, a stable acrolein metabolite in a rat model of spinal cord injury. J. Neurotrauma 30, 1334–1341. [DOI] [PMC free article] [PubMed] [Google Scholar]
- Zhou X., Zhuo X., Xie F., Kluetzman K., Shu Y. Z., Humphreys W. G., Ding X. (2010). Role of cyp2a5 in the clearance of nicotine and cotinine: Insights from studies on a cyp2a5-null mouse model. J. Pharmacol. Exp. Ther. 332, 578–587. [DOI] [PMC free article] [PubMed] [Google Scholar]
Associated Data
This section collects any data citations, data availability statements, or supplementary materials included in this article.