PLOS ONE logoLink to PLOS ONE
. 2020 Nov 11;15(11):e0241497. doi: 10.1371/journal.pone.0241497

On the treatment effect heterogeneity of antidepressants in major depression: A Bayesian meta-analysis and simulation study

Constantin Volkmann 1,*,#, Alexander Volkmann 2,#, Christian A Müller 1
Editor: Alan D Hutson3
PMCID: PMC7657525  PMID: 33175895

Abstract

Background

The average treatment effect of antidepressants in major depression was found to be about 2 points on the 17-item Hamilton Depression Rating Scale, which lies below clinical relevance. Here, we searched for evidence of a relevant treatment effect heterogeneity that could justify the usage of antidepressants despite their low average treatment effect.

Methods

Bayesian meta-analysis of 169 randomized, controlled trials including 58,687 patients. We considered the effect sizes log variability ratio (lnVR) and log coefficient of variation ratio (lnCVR) to analyze the difference in variability of active and placebo response. We used Bayesian random-effects meta-analyses (REMA) for lnVR and lnCVR and fitted a random-effects meta-regression (REMR) model to estimate the treatment effect variability between antidepressants and placebo.

Results

The variability ratio was found to be very close to 1 in the best fitting models (REMR: 95% highest density interval (HDI) [0.98, 1.02], REMA: 95% HDI [1.00, 1.02]). The between-study standard deviation τ under the REMA with respect to lnVR was found to be low (95% HDI [0.00, 0.02]). Simulations showed that a large treatment effect heterogeneity is only compatible with the data if a strong correlation between placebo response and individual treatment effect is assumed.

Conclusions

The published data from RCTs on antidepressants for the treatment of major depression is compatible with a near-constant treatment effect. Although it is impossible to rule out a substantial treatment effect heterogeneity, its existence seems rather unlikely. Since the average treatment effect of antidepressants falls short of clinical relevance, the current prescribing practice should be re-evaluated.

Introduction

Major depressive disorder is one of the most frequent psychiatric conditions and poses a major burden for individuals and society; it affects more than 300 million people worldwide and is ranked as the single largest contributor to disability [1]. The first-line treatment usually consists of psychotherapy and/or pharmacotherapy with antidepressant drugs [2, 3]. Within the last decades, the number of prescriptions of antidepressants has continuously increased in several regions of the world. A recent meta-analysis by Cipriani et al. comprising 522 randomized, controlled trials (RCTs) of 21 antidepressants in 116,477 participants reported that all antidepressants were more effective than placebo in reducing depressive symptoms [4]. However, the so-called average treatment effect, which measures the difference in mean outcomes between active and control group, was only about 2 points on the 17-item Hamilton Depression Rating Scale (HAMD-17) [5] in this dataset [6]. A reduction of 2 points on the HAMD scale is probably not detectable by the treating physician and of questionable clinical relevance. According to Leucht et al. [7], a reduction of up to 3 points on the HAMD corresponds to “no change” in the Clinical Global Impressions—Improvement Scale (CGI-I) and the assumed threshold of clinical significance is between 3 and 7 points [8, 9].

Treatment effect heterogeneity

Despite the small average treatment effect of antidepressants, it is commonly assumed that subpopulations of patients exist that have a clinically relevant benefit. However, a clinically relevant treatment effect heterogeneity, albeit widely believed and intuitively plausible, has not conclusively been shown to exist yet. The observed change in clinical symptomatology (the change or response score), which is highly variable, is the sum of different effects, such as placebo effect, regression to the mean, spontaneous remission and treatment effect [10, 11]. Hence, the true effect of an intervention cannot be observed in a single patient, as it would require the observation (and subtraction of) both potential outcomes–with and without the intervention. This Fig 1 illustrates the relationship between observed change, individual treatment effect and treatment effect heterogeneity.

Fig 1. Visualization of potential outcomes and treatment effect for a patient in an antidepressant trial.
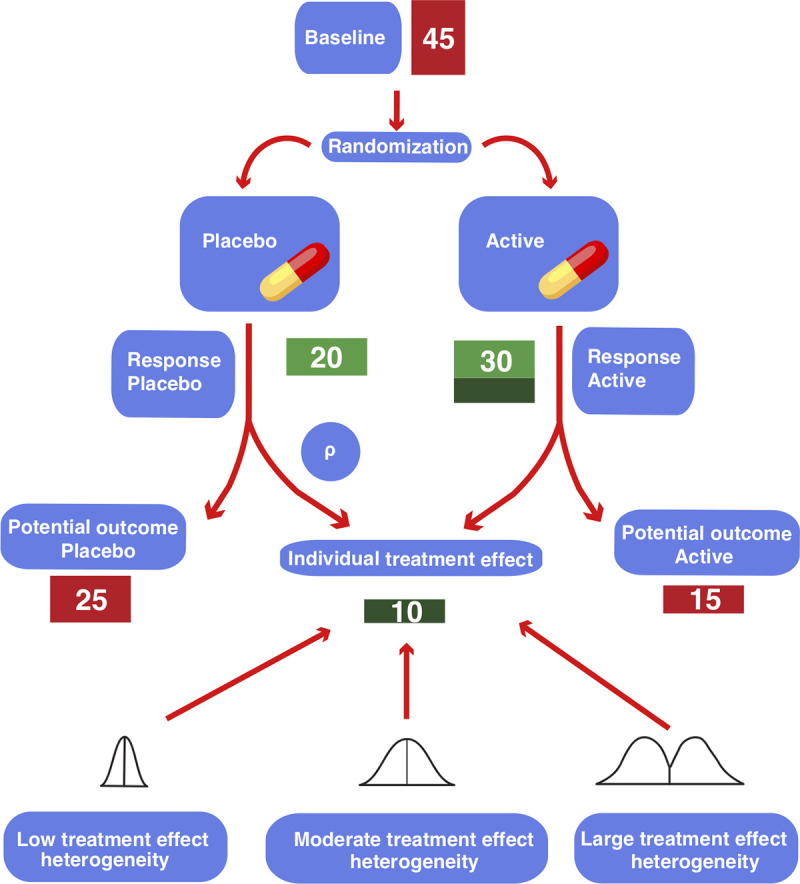
Fig 1

The patient is randomized to either the placebo or the active arm, corresponding to two hypothetical “potential outcomes” (Red scores). Only one outcome can be observed, as a patient cannot receive both interventions simultaneously. The difference between the two outcomes is the “individual treatment effect” of the intervention (Dark green score). The individual treatment effect is unobservable and can be imaged to be drawn from hypothetical distributions of the treatment effect. The variance of this distribution corresponds to the treatment effect heterogeneity. The factor ρ is the correlation between the placebo response and the individual treatment effect. All numbers signify depression severity on the HAMD-17 scale.

The variability ratio

In order to assess treatment effect heterogeneity from the data of parallel group trials, the comparison of outcome variances between the active and the control condition has been proposed [10]. Two different effect size statistics have been suggested to estimate the difference in variability between two groups [12]. The variability ratio (VR) is the quotient of the variances of the active and placebo groups, while the coefficient of variance ratio (CVR) corrects for differences in means between the groups. Here, an increase or a decrease in variance in the active group might be a signal of a varying individual treatment effect.

Following a recent publication by Winkelbeiner et al. [13], analyzing differences in variances in 52 randomized, placebo-controlled antipsychotic drug trials, this work aimed at estimating the degree of treatment effect heterogeneity of antidepressants using the open dataset of the largest meta-analysis of the efficacy of antidepressants in major depressive disorder. Three other research groups [1416] have addressed the same question of treatment effect heterogeneity of antidepressants using the same dataset.

However, all previous analyses did not sufficiently take into account the linear association between the logarithmic mean and logarithmic standard deviation (SD) of the underlying measuring scale when estimating the direct effect of antidepressants on outcome variability. The VR and the CVR effect sizes naively assume a slope coefficient of 0 and 1 on this association, respectively, and may thus yield biased results if the slope coefficient differs from the assumed one. Crucially, using the VR in this dataset suggests no evidence for treatment effect heterogeneity [14, 15], while using the CVR leads to the conclusion of a variable antidepressant treatment effect [16].

We reanalyzed the Cipriani dataset by implementing a Bayesian meta-regression that models the degree of linear association between lnMean and lnSD directly from the data and thus yields more accurate results. We illustrated the exact relationship between VR and CVR and their respective limitations and disentangled direct and indirect effect of antidepressants on outcome variability. We showed that the CVR is a suboptimal measure, as it makes strong assumptions that are not warranted in this dataset. Furthermore, we investigated the compatibility of the results with different degrees of treatment effect heterogeneity using simulations experiments. Using an analytically derived formula, we provided an upper bound on the treatment effect heterogeneity based on the VR estimate.

Methods

Statement of ethics

The authors have no ethical conflicts to disclose.

Data acquisition

We obtained the dataset of the meta-analysis by Cipriani et al. [4] from the Mendeley database (https://data.mendeley.com/datasets/83rthbp8ys/2). This study included 522 RCTs comparing 21 antidepressants with placebo or another active antidepressant as oral monotherapy for the acute treatment of adults (≥18 years old and of both sexes) with a primary diagnosis of major depressive disorder according to standard operationalized diagnostic criteria (Feighner criteria, Research Diagnostic Criteria, DSM-III, DSM-III-R, DSM-IV, DSM-5, and ICD-10). For further details on the inclusion criteria and study characteristics, see the original study. We did not attempt to obtain individual patient data but relied on summary data from the openly accessible dataset.

Data extraction and processing

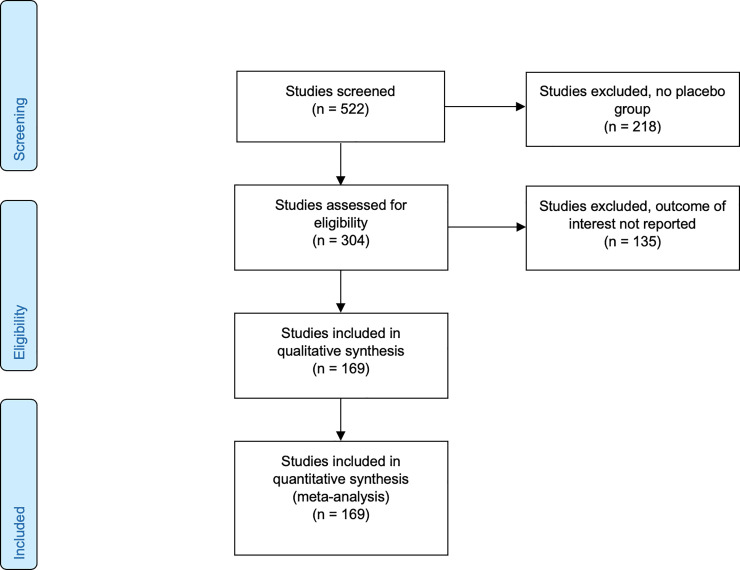
Of the total of 522 studies we kept the 304 that included a placebo arm. We excluded all studies for which the reported endpoint did not represent the change from baseline, leaving us with a total of 169 studies including 58,687 patients for the analysis (see PRISMA flow diagram, Fig 2). We extracted both the mean and the standard deviation of pre- and post-treatment outcome difference scores (the “response”). The studies included in the data set comprised 8 different depression scales, namely HAMD-17, HAMD-21, HAMD-24, HAMD unspecified, HAMD-29, HAMD-31, Montgomery–Åsberg Depression Rating Scale (MADRS) [17] and IDS-IVR-30 [18]. Studies with different treatment arms were aggregated according to the recommendation of the Cochrane Collaboration. In this manuscript, we define response as pre-post-difference of a given outcome scale.

Fig 2. PRISMA 2009 flow diagram.

Fig 2

Investigation of treatment effect heterogeneity

In the case of a constant treatment effect, the variances of the active and the placebo group are expected to be equal. Therefore, a large difference in variances in response to antidepressants and placebo may be regarded as evidence of treatment effect heterogeneity.

Two different effect size statistics have been suggested by Nakagawa et al. [12] to estimate the difference in variability of active and placebo response:

  • 1
    The log variability ratio
    lnVR=ln(SDaSDp)+12(na1)12(np1),,where:
    SD=standarddeviation,a=active,p=placebo
  • 2
    The log coefficient of variation ratio
    lnCVR=ln(CVaCVp)+12(na1)12(np1),where:CV=SDmean

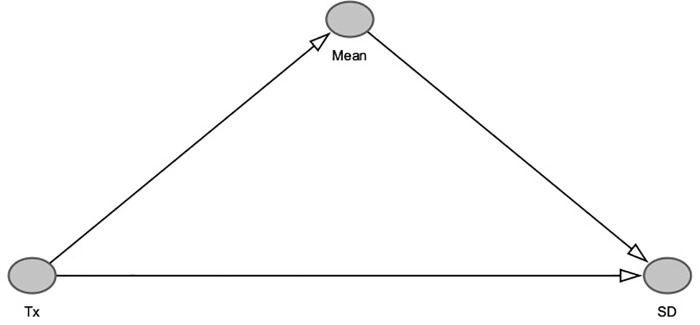
The VR measures the total effect (direct and indirect) of antidepressants on outcome variability. If the mean and standard deviation of the outcome scale are associated, the active treatment would have an indirect effect on the outcome variability mediated by its effect on the outcome mean. In order to estimate only the direct effect of the treatment on outcome variability, it is therefore necessary to control for the mean ~ SD relationship (Fig 3).

Fig 3. Causal graph depicting relationship between treatment, mean and SD.

Fig 3

The treatment Tx has a causal effect of around 2 Hamilton points on the mean of the study population. If we control for the mean ~ SD relationship when estimating the variability between treatment and control, we only measure the direct effect of treatment on variability, while no such control (as with the VR effect size) measures the total effect of the treatment on outcome variability.

The lnCVR controls for such an association but implicitly assumes a linear relationship between lnMean and lnSD with slope coefficient of 1. For clarification, consider a linear relationship between lnMean and lnSD across different studies with slope coefficient 1:

lnSD=const+lnMean

Then it follows that CV is constant across studies:

lnCV=ln(SDmean)=const

Therefore, the lnCVR can be represented by a linear function between lnVR and lnRR with slope coefficient 1:

lnCVR=constaconstp=α
lnVRlnRR=α
lnVR=α+1*lnRR

Conversely, the lnVR can be represented by a linear function between lnVR and lnRR with slope coefficient 0:

lnVR=α+0*lnRR

Where lnRR is defined as:

  • 3
    The log of the response ratio
    lnRR=ln(meanameanp),wheremeandenotesthemeanoftheresponsevariable

The lnCVR may therefore give biased results when estimating the direct effect, if the slope coefficient of this linear association differs from 1. Conversely, the lnVR effect size may yield biased results, if one is interested in the direct effect only and an lnMean ~ lnSD relationship exists. This is a relevant limitation of both effect sizes that has not been considered by previous analyses.

Linear association between lnMean and lnSD

The CVR effect size implicitly assumes a linear association between the logarithm of the mean response scores (lnMean) and the logarithm of their standard deviation (lnSD) with a slope coefficient of 1. In order to test this assumption, we investigated this association by using a varying intercept model, where the intercepts were allowed to vary between studies with different depression scales. Moreover, testing for a linear association between lnMean and lnSD helps assessing the validity of the exchangeability assumption of random-effects meta-analyses. If there is a strong influence of lnMean on lnSD, the lnVR meta-analysis may yield biased results [19].

Statistical analysis

All statistical analyses were carried out in the programming language Python (version 3.7) and the probabilistic programming language Stan (with pystan version 2.19.1.1 as a Python interface). The python code is available at: https://github.com/volkale/adv.

We used a Bayesian approach to fit all our models using weakly informative priors. Firstly, we used a Bayesian random-effects meta-analyses (REMA) for the two effect statistics lnVR and lnCVR. Secondly, we used a Bayesian random-effects meta-regression (REMR) to fit the lnVR effect statistic with the natural logarithm of the response ratio (lnRR) as a regressor. An additional complexity in our analysis, as compared to recent analyses [13, 20], came from the fact that our data set contained several different depression scales (several versions of the HAMD and the MADRS, see S1 Fig). For our analysis we made the assumption that these different scales are (locally) linearly transformable into each other. This assumption is well supported by the literature [21]. Fortunately, the lnVR and lnCVR effect statistics are invariant under linear transformations of the outcome scale.

Random-effects meta-analysis (REMA)

We applied a Bayesian random-effects meta-analysis in order to estimate the effect sizes lnVR and lnCVR. For the REMA, the following model was applied, where μ equals the underlying mean of the effect size. Finally, τ2 represents the between-study-variance.

ESiN(αi,SDi2)
αiN(μ,τ2)

We specified the following weakly-informative hyper-priors:

μCauchy(0,1)
τHalfCauchy(0,1)

Random-effects meta-regression (REMR)

This approach is a “contrast-based” version of the “arm-based” meta-analysis in Nakagawa et al. [12] which models the log of the standard deviation of the outcome directly in a multi-level meta-regression. The advantage of this model over the lnVR and lnCVR meta-analyses is that we are not forced to make rigid assumptions about the lnMean ~ lnSD association, as the strength of this relationship is estimated directly from the data. The REMR models this relationship as follows:

lnVR=α+β*lnRR

Note that the lnVR corresponds to a β coefficient set to 0, whereas the lnCVR corresponds to a β coefficient set to 1. In the REMR, the slope β can take any real value and is estimated from the data. The contrast-based approach takes care of the issue of the occurrence of different depression scales, as it considers relative differences between active and placebo arms within each study. Since the depression scales are linearly transformable into each other, those relative differences do not depend on the depression scale.

We used the following model, where lnVRi is the measured lnVR of study i and lnνi is the true value of lnVRi. αi is the study-specific direct effect, whereas μ denotes the meta-analytic direct effect. β is the slope coefficient of lnri (the true value of lnRRi), β*lnri thus equals the study-specific indirect effect.

lnVRiN(lnvi,s2lnVRi)
lnvi=αi+β*lnri
αiN(μ,τ2)
lnriN(0,2.52)
lnRRiN(lnri,s2lnRRi)

We specified the following weakly-informative hyper-priors:

μCauchy(0,1)
βCauchy(0,1)
τHalfCauchy(0,1)

Random-effects vs. fixed-effect model

When investigating the heterogeneity of a treatment effect, the choice between a random-effects and a fixed-effect approach has relevant consequences for the interpretation of the results. The random-effects model assumes that the treatment effect varies between populations and studies and hence estimates the average intervention effect [22]. It is a matter of interpretation, if we consider the between-study-variance to be a results of sampling error or a true variation of the effect. In the latter case, the between-study variance τ2 and not only the mean variability may be considered in order to estimate treatment effect heterogeneity.

Choice of priors

Since the number of studies in this meta-analysis was very large relative to the number of model parameters, we chose regularizing, minimally informative priors. In order to test the sensitivity of the results to the choice of prior, we repeated the main analysis (REMR) using an enthusiastic prior as suggested by Spiegelhalter et al. [23]. Specifically, we used a normal prior centered at eμ = 2 (eμ being the meta-analytic direct effect on the non-log scale) with a variance such that the prior probability of eμ being smaller than 1 was less than 5%. This can roughly be interpreted as expecting a VR of larger than 1 with 95% certainty and a mean estimate of 2 prior to seeing the data.

Model performance

In order to compare the performance of the different models applied, we used the so-called widely applicable information criterion (WAIC). This method estimates the pointwise prediction accuracy of fitted Bayesian models. Here, higher values of WAIC indicate a better out-of-sample predictive fit (“better” model). We refer to Vehtari et al. [24] for more details on WAIC.

Influence of baseline severity

Because baseline severity has been implied as a potential moderator on the treatment effect of antidepressants, we included it as a predictor in the meta-regression model. We expressed the baseline severity as a fraction of the respective maximum value, in order to account for the occurrence of different depression scales (S1 Table in S1 File). This yielded the model below, where BLi is the normalized baseline severity of study i and γ the slope coefficient for the influence of the baseline severity on outcome variability ratio.

lnvi=αi+β*lnri+γ*BLi

For this analysis, we excluded studies for which no baseline scores were available and those that used the scale “Hamilton unspecified”, leaving a total of 152 studies. The baseline severity scores were normalized according to their respective maximum values.

Subgroup analysis

In order to investigate the influence of the type of antidepressant of outcome variability, we conducted subgroup analyses applying the REMR model for the following antidepressant classes: SSRI (citalopram, escitalopram, fluoxetine, fluvoxamine, paroxetine and sertraline, 89 trials), SSNRI (desvenlafaxine, duloxetine, milnacipran, venlafaxine, 47 trials), tricyclics (amitriptyline, clomipramine, 11 trials) and atypicals/others (agomelatine, bupropion, mirtazapine, nefazodone, reboxetine, trazodone, vortioxetine, 60 trials).

Upper bound on the treatment effect heterogeneity

In order to investigate the compatibility of different assumptions regarding the treatment effect with the measured variability ratio, we used the following equation that was derived by A. Volkmann [25]:

v21=(SDte+ρ*SDp)2SDP2ρ2,wherete=individualtreatmenteffect

Simulation experiments

For each simulation, the response under placebo of 1000 patients was drawn from a right skewed distribution with mean and standard deviation of 8.8 and 7.7 points on the HAMD-17 scale (based on Cipriani data [4]), respectively. For each patient, an individual treatment effect was computed from a mixed Gaussian distribution with a standard deviation SDte, where the outcome under placebo and the individual treatment effect were required to be correlated by the correlation coefficient ρ. This yielded a potential outcome under placebo and a potential outcome under active treatment for every patient with a corresponding individual treatment effect (see Fig 1 for illustration). Note that only one of these two outcomes can be observed in a real experiment. Half of the patients were then randomly selected for treatment; the other half was assigned to placebo.

For a large treatment effect heterogeneity, the individual treatment effect was drawn from a distribution with an (arbitrarily chosen) standard deviation SDte = 6.5 HAMD-17. For a low treatment effect heterogeneity SDte was 1.5 HAMD-17 points.

Results

Study selection

We included 169 placebo-controlled studies that reported mean and standard deviation of change in depression scores. These studies included data on 58,687 patients treated with 21 different antidepressants.

Correlation between mean and standard deviation of depression scores

In order to test the model assumptions of the lnVR and lnCVR meta-analyses, we investigated the linear association between the logarithm of the mean response scores (lnMean) and the logarithm of their standard deviation (lnSD). Fitting a varying intercept model with lnMean as independent variable and lnSD as dependent variable, we got a posterior mean for the slope coefficient of 0.10 with a 95% HDI (highest density interval) interval of [0.04, 0.16]. Fig 4 depicts the linear regression for each depression scale individually. We remark that simply computing the correlation of the two quantities without paying attention to the correct weighting and the different scales in the data would yield an overestimated slope coefficient of 0.25 (see S2 Table in S1 File). These results imply that the lnCVR likely produces biased results, as it assumes a slope coefficient of 1 on this association. The SD will therefore be underestimated in the group with the larger mean (In our case in the antidepressant group). When estimating the direct effect, the lnVR will overestimate the SD in this group, but to a lesser degree, as the estimated slope coefficient of 0.1 is relatively close to 0, which is the slope coefficient assumed by the lnVR.

Fig 4. Linear association between lnMean and lnSD.
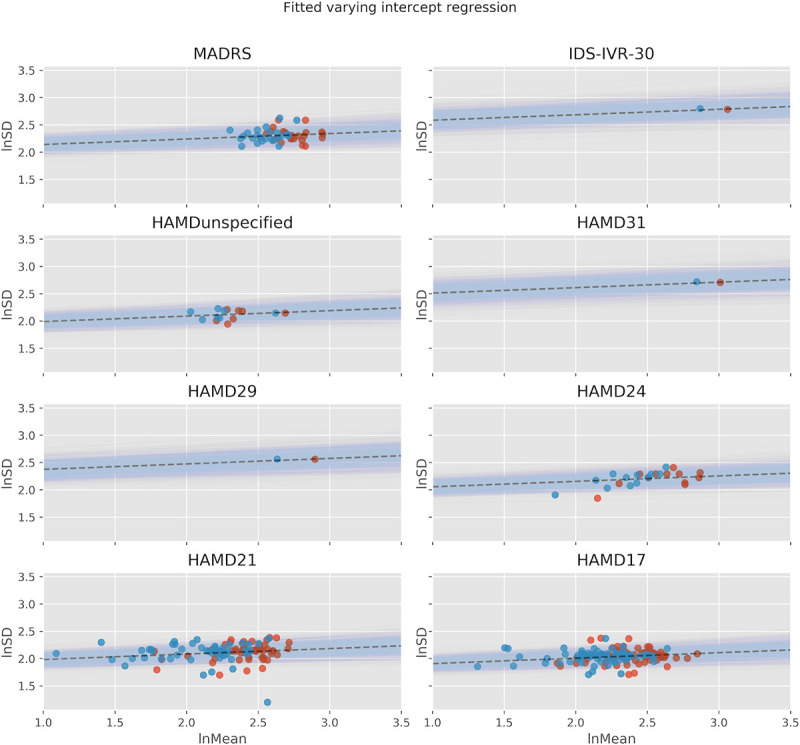
Fig 4

Linear association between lnMean and lnSD using a varying intercept model, where the intercepts were allowed to vary between studies with different depression scales. Red dots represent active groups, blue dots represent placebo groups.

Log variability ratio (lnVR) and log coefficient of variation (lnCVR) models

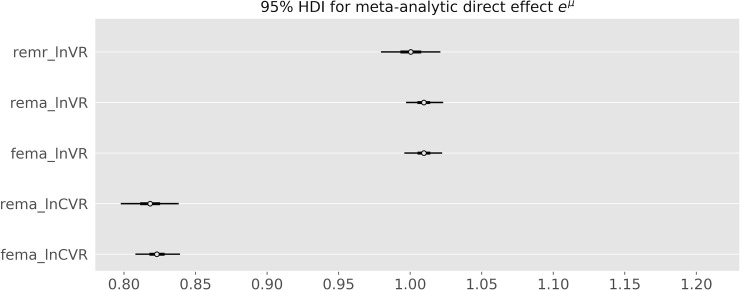
In order to estimate the difference in variability between antidepressant and placebo response, we modelled the lnVR effect size using a Bayesian random effects model as heterogeneity between studies may be expected. The posterior mean estimate for the variability ratio was 1.01, with the 95% highest posterior density (HDI) interval ranging from 1.00 to 1.02. The lnCVR REMA showed a reduction in the coefficient of variation in the active versus the placebo group (posterior mean estimate for CVR: 0.82, 95% HDI [0.80,0.84]). As predicted, it underestimates the variance in the active group.

Random-effects meta-regression

Finally, we implemented a Bayesian random effects meta-regression (REMR) that incorporates the strength of the lnMean ~ lnSD relationship directly from the data. The Bayesian shrinkage model is depicted in S2 Fig. Fitting this model, we obtained posterior statistics for the μ and β coefficients (see S3 Table in S1 File and Fig 5). The posterior mean estimate for eμ was 1.00 (95% HDI [0.98,1.02]) and that for β 0.04 (95% HDI [-0.03,0.12]), where we can (roughly, up to measurement error and study-specific variation) interpret the coefficients as follows:

VReμ*RRβ(lnVRμ+β*lnRR)

Fig 5. Posterior credible intervals for total effect, direct effect and indirect effect as determined by the REMR.
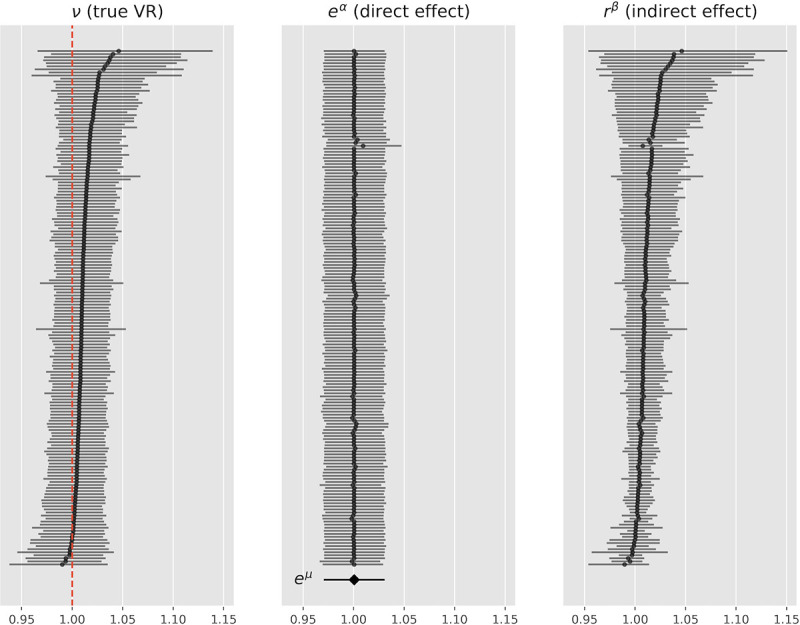
Fig 5

eα represents the study-specific direct effect, RRβ the study-specific indirect effect, eμ is the meta-analytic mean of the direct effect.

Note that the lnVR REMA corresponds to a lnVR REMR with a β coefficient set to 0, whereas the lnCVR REMA corresponds to a lnVR REMR with a β coefficient set to 1. The REMR model learns the β coefficient and its posterior mean is equal to 0.04 [-0.03, 0.12] suggesting that the lnVR REMA is a more appropriate model than the lnCVR REMA when measuring the direct effect on outcome variability. Fig 6 shows the estimates for eμ for the different models.

Fig 6. Posterior credible intervals for the eμ parameter for the different models.

Fig 6

REMA: random-effects meta-analysis. FEMA: fixed-effects meta-analysis. REMR: random-effects meta-regression. The lnCVR underestimates the variability in the active group, while the results are very similar for the REMR and the lnVR meta-analysis.

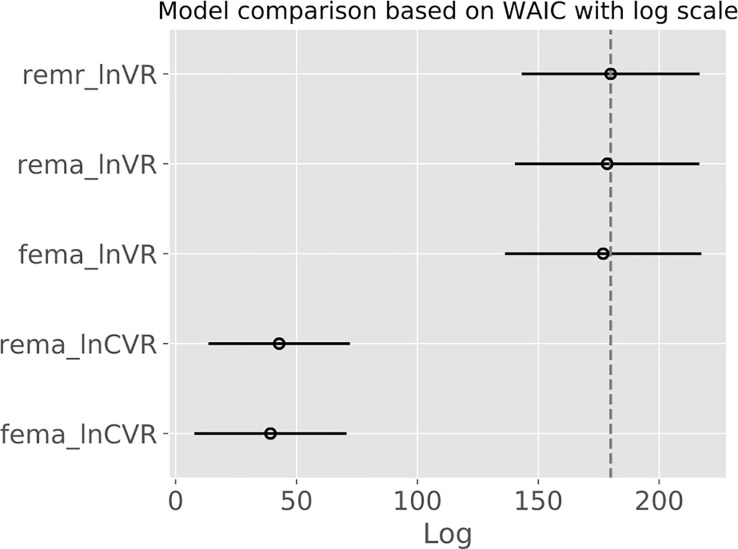
We observed that the lnVR REMA and the lnVR REMR outperformed the lnCVR REMA with respect to the WAIC, while the lnVR REMA and the lnVR REMR showed comparable performance. Fig 7 shows the logWAIC for the different models. S4 Table in S1 File depicts the detailed results.

Fig 7. Widely applicable information criterion (WAIC) depicted on a logarithmic scale.

Fig 7

Higher values signify a better predictive fit of the underlying model. Bars indicate standard errors. REMA: random-effects meta-analysis. FEMA: fixed-effects meta-analysis. REMR: random-effects meta-regression.

Between-study heterogeneity

The between-study standard deviation τ under the REMA was found to be low for lnVR (95% HDI [0.00,0.02]). Indeed, applying a fixed effects model instead of the REMA for the purpose of sensitivity analysis yielded similar results for the overall mean estimate of lnVR. Heterogeneity was higher for lnCVR (95% HDI for τ [0.05,0.12]).

Influence of baseline severity

We included the baseline severity as a predictor in the meta-regression model, in order to estimate its influence on outcome variability (Fig 8). The posterior interval for its regression coefficient γ in the meta-regression was -0.01 (95% HDI [-0.21,0.20], S5 Table in S1 File), suggesting no clear influence of baseline depression severity on outcome variability. The interpretation of the parameter γ is as follows, where BL denotes the baseline severity:

VReμ*RRβ*(eBL)γ(lnVRμ+β*lnRR+γ*BL).

Fig 8. Influence of baseline severity on outcome variability.
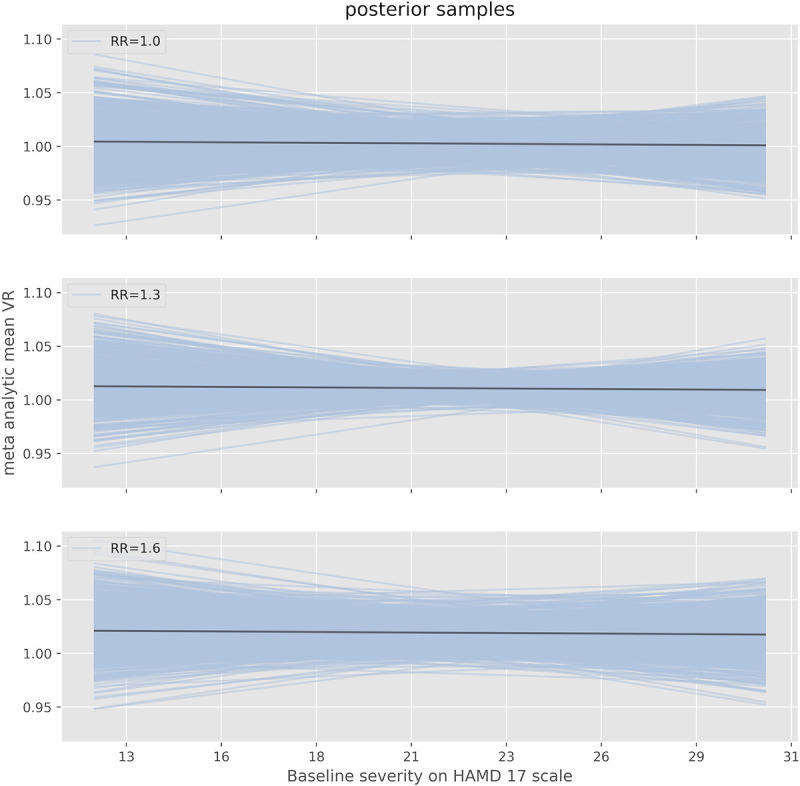
Fig 8

Estimated VR of antidepressants versus placebo as a function of baseline severity on the HAMD17-scale as determined by the REMR. Depicted are the mean estimates and 95% HDIs for three different values of the response ratio (mean response active versus mean response placebo). The meta-analytic mean of RR is around 1.22 in the Cipriani data set.

Subgroup analysis

In search of treatment effect heterogeneity of individual antidepressant classes, we repeated the main analysis (REMR) for each class. The meta-analytic direct effect was not credibly different from 1 for any of the antidepressant classes (Fig 9). For atypicals, SSRI and SSNRI, it was credibly near 1 (95% HDI [0.96, 1.02], [0.97, 1.05] and [0.96, 1.05], respectively). For tricyclics the mean estimate of the direct effect on variability was 0.91 but with a very wide posterior interval (95% HDI [0.60,1.28]), making this estimate very uncertain.

Fig 9. VR for different antidepressant classes.
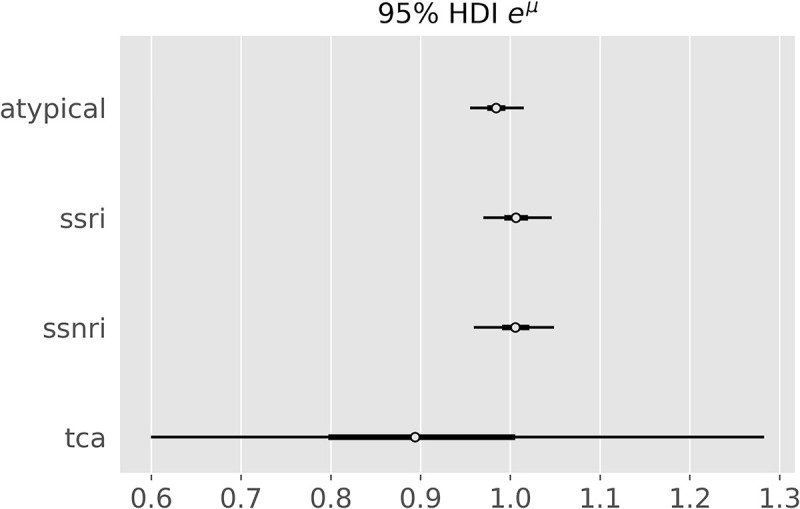
Fig 9

Posterior credible intervals for the eμ parameter for different antidepressant classes as determined by the random-effect meta-regression.

Sensitivity analysis

Using an enthusiastic prior in the main analysis did not alter the results (eμ = 1.00 (95% HDI [0.98,1.02])).

Upper bound on treatment effect heterogeneity

Using inequation 5 from the methods section, we derived an upper bound on the treatment effect heterogeneity. Using the Cipriani et al. dataset, we can estimate SDp (SD of placebo response) to be equal to around 7.66 on the HAMD-17 scale. From our main analysis we have that the upper bound of the 95% HDI of the posterior distribution of VR (more accurately eμ) is 1.02. This implies the following inequality:

  • 4

    SDtx7.66*((0.04+ρ2)ρ)

Which distributions of the treatment effect are possible for a VR 1.02?

Based on formula 6, Table 1 depicts different magnitudes of treatment effect heterogeneity compatible with an average treatment effect of 2.0 HAMD17 points and a VR of 1.02.

Table 1. Upper bound on treatment effect heterogeneity compatible with the results.

Any distribution Normal distribution Dichotomous response
ρ SDte (HAMD17) % of patients with TE > 7 HAMD17 Responder TE (HAMD17) % Responders
-1.0 15.5 37.3 9.7 20.5
-0.8 12.4 34.4 8.2 24.3
-0.6 9.4 29.8 6.7 29.8
-0.4 6.5 22.1 5.2 38.1
-0.2 3.7 8.9 3.9 51.9
0.0 1.5 0.1 2.8 72.2
0.2 0.6 0.0 2.3 86.2
0.4 0.4 0.0 2.2 91.6
0.6 0.3 0.0 2.1 94.1
0.8 0.2 0.0 2.1 95.5
1.0 0.2 0.0 2.1 96.3

Assuming a VR of 1.02, a SDp of 7.66 points (based on Cipriani [10]) and different correlation coefficients ρ between the response under placebo and the treatment effect. Left column (“any distribution”): Upper bounds for the standard deviation of the treatment effect. Mid column: Percentage of patients with TE greater than 7 HAMD17 points, when assuming a normal distribution of the TE with mean 2.0. Right column (“dichotomous response”): Patients are either “non-responders” with a treatment effect of 0, or "responders” with the responder treatment effect. For a given correlation coefficient ρ, there is one possible solution for the treatment effect (TE).

The left column (“any distribution”) of the table depicts the upper bound for the standard deviation of the treatment effect, without any assumptions regarding the shape of its distribution. The mid column shows the respective percentage of patients with a treatment effect greater than 7 HAMD points when assuming a normally distributed treatment effect. The right column assumes a dichotomous treatment effect (“responder”, “non-responder”). Here, “non-responders” are assumed to have a treatment effect of 0 (placebo response = antidepressant response), whereas “responders” have a fixed treatment effect > 0. The percentage of “responders” and their respective “responder treatment effect” depend upon the intra-individual correlation ρ between the potential outcome placebo response and individual treatment effect.

These results show that, contrary to intuition, a variability ratio of 1.02 is (theoretically) compatible with a standard deviation of the treatment effect between 0 and 15.5 points on the HAMD-17 scale. Conversely, a reduction in the variability in the treatment group is compatible with a substantial treatment effect heterogeneity if response under placebo and individual treatment effect are negatively associated (see simulations in S5 and S6 Figs).

Simulations

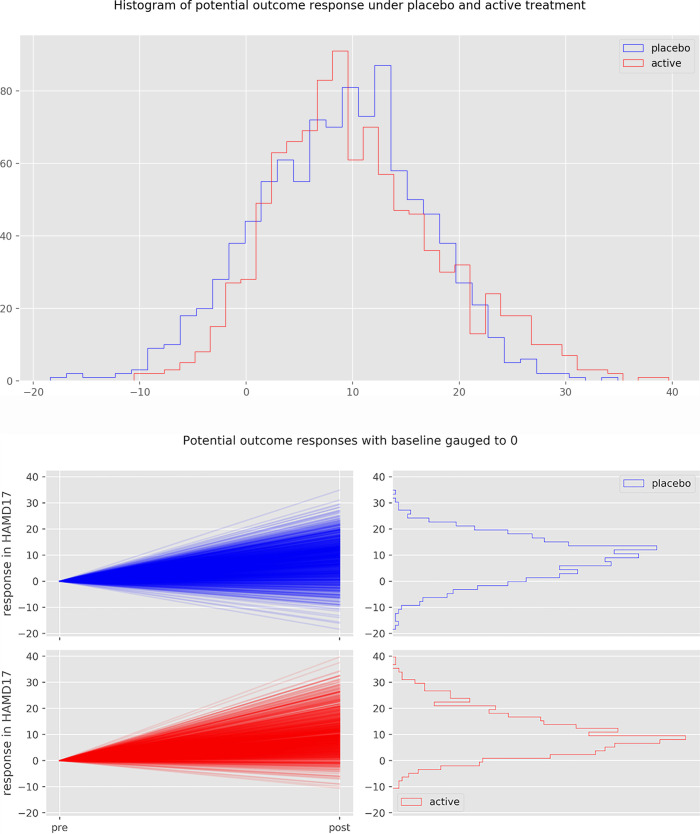
We conducted simulation experiments in order to illustrate the compatibility of a VR of 1.02 with different degrees of treatment effect heterogeneity. For a large TEH with SDte = 6.5 HAMD-17, the response under placebo and the individual treatment effect have to be negatively correlated by the correlation factor ρ = - 0.4, in order for the VR to credibly remain at or below 1.02 (see Table 1). Fig 10 depicts the change scores of 1000 patients under placebo (blue) and under active treatment (red) for SDte = 6.5 and ρ = - 0.4. Fig 11 shows the magnitude of the individual treatment effect of 100 individuals of this simulation.

Fig 10. Change score of 1000 simulated patients.

Fig 10

Boxplot (a) of change score under placebo (blue) and under active treatment (red) for ρ = - 0.4, SDte = 6.35 HAMD-17 points and VR = 1.02. (b) depicts pre-post change for each individual patient, gauged to 0. Note, that in this particular simulation, the SDte is not exactly equal to 6.5, as all simulations contain random processes.

Fig 11. Potential outcomes and individual treatment effect of 100 simulated patients.
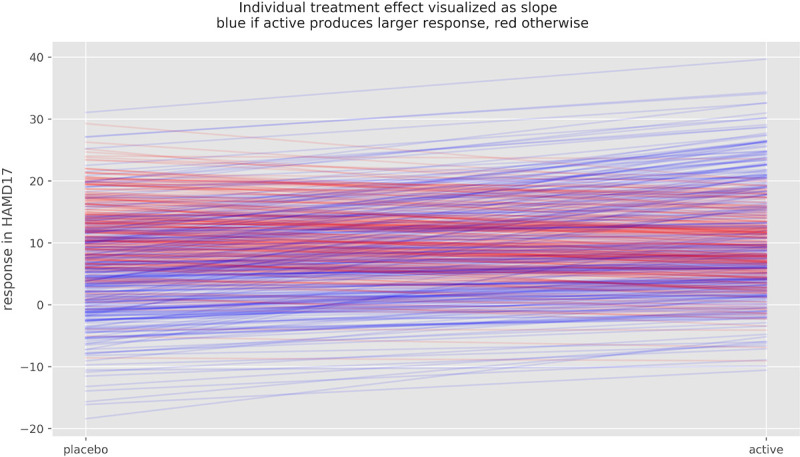
Fig 11

Potential outcome under placebo and under active treatment of 100 simulated patients, ρ = - 0.4, SDTE = 6.35 and VR = 1.2. Slopes represent individual treatment effect, which varies substantially in this simulation. Blue lines indicated improvement under active treatment, red lines deterioration.

Note that patients that would remain unchanged under placebo (response close to 0) have a larger benefit from active medication (higher density of blue slopes) than patients that would have improved under placebo. For some patients to benefit substantially, however, other patients have to be harmed by the medication (red slopes). Without such a correlation, a TEH of this magnitude would yield a VR of around 1.3.

For the VR to be credibly lower than 1.02 and the response under placebo and the individual treatment effect to be uncorrelated (ρ = 0), TEH has to be low. S3 and S4 Figs depict the results of a simulated experiment with SDte = 1.5 points on the HAMD-17 scale (derived from Table 1). A VR closer to 1 would yield an even smaller treatment effect heterogeneity.

Discussion

Antidepressants are a first-line treatment for patients with major depressive disorder and are widely prescribed around the world. Despite their widespread use, it remains unclear how many and which patients benefit from this medication. In a recent re-analysis [6] of a highly cited network meta-analysis [4], the average treatment effect of antidepressants was found to be about 2 points on the HAMD-17 scale, which is almost undetectable by clinicians [7] and lies below the assumed minimally clinically relevant effect [8, 9]. While this does not exclude the possibility of subgroups of patients that have a meaningful benefit, substantial differences in the individual treatment effect of antidepressants have not been shown to exist yet.

In search for evidence of benefiting subgroups, this work aimed to estimate the treatment effect heterogeneity of antidepressants in the treatment of major depressive disorder using a large dataset of a recent network meta-analysis [4]. To this end, we applied the effect size statistics lnVR and lnCVR suggested by Nakagawa et al. [12], using a Bayesian random-effects meta-analytical approach (REMA) and fitted a multi-level meta-regression (REMR) model to estimate the treatment effect variability between antidepressants and placebo.

Both the lnVR REMR and the lnVR REMA, which were found to outperform the lnCVR REMA, showed that the variability ratio was very close to 1 (REMR: 95% HDI [0.98, 1.02], REMA: 95% HDI [1.00, 1.02]), compatible with a near-constant effect of antidepressants on depression severity.

Subgroup and sensitivity analyses

We repeated the analyses for different antidepressant classes (SSRI, SSNRI, tricyclics and atypicals) but did not detect clear evidence for treatment effect heterogeneity for any of the groups. The estimates for SSRI, SSNRI and atypicals were relatively certain, while the VR for tricyclics yielded a wide credible interval with a mean estimate of 0.91 (95% HDI [0.60,1.28]), not clearly suggestive of treatment effect heterogeneity.

Furthermore, we could not detect a relevant influence of baseline severity on outcome variability. Hence, even for severely depressed patients we found no evidence of subgroups that have substantial benefit. This is in line with more recent analyses [26, 27] that could not confirm the previously assumed influence of baseline severity on antidepressant efficacy [28, 29]. In order to test the robustness of our finding, we repeated the main analysis using a more optimistic prior, which did not alter the result.

Methodological aspects

Other research groups have addressed the same research question [1416] using the same dataset but have not considered important methodological aspects regarding the lnVR and lnCVR effect sizes which demanded further inquiry.

When estimating the direct effect of antidepressants on outcome variability, the correlation between the mean and standard deviation of the underlying measuring scale has to be taken into account. In other words, how much of the difference in (logarithmic) variances is explained by the difference in (logarithmic) means rather than directly by the treatment. The lnVR and the lnCVR effect sizes naively assume a slope coefficient of 0 and 1 on this association, respectively. Both may thus give biased results, if the true slope coefficient differs from the one assumed.

By applying a varying intercept model taking into account the occurrence of different depression scales we could show that the correlation between (logarithmic) mean and (logarithmic) standard deviation is of a small magnitude (slope coefficient = 0.10), indicating that the lnVR is a more appropriate measure as opposed to the lnCVR in this data set. The superiority of the lnVR over the lnCVR was confirmed by the WAIC. Our work adds accuracy to the existing literature, as we implemented a generalized meta-regression model (REMR) that incorporates the slope coefficient for the correlation between lnMean and lnSD directly from the data. This allowed us to disentangle the direct and indirect effect of antidepressants on outcome variability.

Another important aspect that has not sufficiently been taken into account by previous analyses is the occurrence of different depression scales. Naively regressing over all depression scales may create a spurious correlation that is due to different means and SDs of these scales, rather than a true lnMean ~ lnSD relationship. Indeed, a regression over all depression scales yielded a slope coefficient of 0.25, which is 2.5 x as large as our estimate.

We addressed this issue by applying a contrast-based approach in the REMR. Here, each antidepressant arm is compared to the respective placebo arm of the same study before data pooling, thus resolving the issue of different depression scales across studies.

Upper bound for the treatment effect heterogeneity

Based on a recently derived inequation [25], we were able to established a direct relationship between VR and treatment effect heterogeneity. We demonstrated that a VR of 1.02 (the upper bound of the 95% HDI interval of the REMR) is theoretically compatible with a standard deviation of the treatment effect between 0 and 15.5 HAMD-17 points. This translates into a maximum of 37% of patients with an individual treatment effect of more than 7 points when assuming a normally distributed treatment effect. Such a large treatment effect heterogeneity would require the treatment effect and the response under placebo of a patient to be strongly and negatively correlated. In absence of such correlation, the treatment effect heterogeneity would be negligibly small (SDte = 1.5 HAMD-17 points).

How should these results be interpreted?

The VR is a measure that can potentially detect evidence for subgroups that benefit more than average from an intervention. A VR that differs substantially from 1 is evidence of such subgroups, while a VR near 1 is compatible with both a small and a large treatment effect heterogeneity. So how should a VR of 1 (95% HDI [0.98,1.02]) be interpreted? For this, consider the following illustration:

  • Hypothesis 1 (H1). The treatment effect heterogeneity is close to 0 (e.g. 99% of patients have an individual treatment effect of 1 to 3 HAMD points).

  • Hypothesis 2 (H2). The treatment effect heterogeneity is greater than in H1.

There are now three possibilities:

  1. H1 is true and VR ≈ 1 (very close to 1, e.g. 0.98 to 1.02)

  2. H2 is true and VR ≈ 1

  3. H2 is true and VR ≠ 1 (not very close to 1)

Our results indicate that VR ≈ 1. We can thus rule out the third possibility. From a Bayesian perspective, the probability of H1 being true increases, while that of H2 being true decreases.

In order for H2 to be true and the VR being close to 1, strong assumptions regarding the correlation between the placebo response and the individual treatment effect of antidepressants are necessary. Specifically, those patients whose depression severity would remain unchanged under placebo would need to have the strongest antidepressant medication effect. In the case of no such correlation, the treatment effect heterogeneity of antidepressants is likely low. However, this correlation cannot be determined using summary statistics of randomized controlled trial, as the inter-individual correlation of placebo-response and individual treatment effect does not equal the correlation of sample mean response and average treatment effect across studies. The direction of association may even be reversed, a phenomenon called Simpson's paradox.

Limitations

A limitation of this work is that we did not conduct an independent literature search and that we did not use individual patient data which we did not have access to. All results are conditional on the model assumptions. However, prior sensitivity analysis and subgroup analyses did not alter the results. Other limitations were discussed by Munkholm et al. [15]. They include the short duration of trials, as a varying treatment effect may only become apparent after a longer period of time, and psychometrical limitations of the depression scales.

Conclusion

By applying a multiple level Bayesian regression model and simulations, this work could show that the published data on antidepressants in the treatment of major depression is compatible with a near-constant treatment effect, which is also the simplest explanation for the observed data. Although is not possible to rule out a substantial treatment effect heterogeneity using summary data from RCTs, we could show that a substantial treatment effect heterogeneity is only compatible with the published data under strong assumptions that seem rather unlikely. Until the existence of benefiting subgroups has been demonstrated prospectively, the average treatment effect is the best estimator for the individual treatment effect. Since the average treatment effect of antidepressants probably falls short of clinical relevance, the current prescribing practice in the treatment of major depression should be critically re-evaluated.

Supporting information

S1 Checklist. PRISMA 2009 checklist.

(DOC)

S2 Checklist

(XLSX)

S1 Fig

(TIFF)

S2 Fig

(TIFF)

S3 Fig

(TIFF)

S4 Fig

(TIFF)

S5 Fig

(TIFF)

S6 Fig

(TIFF)

S1 Data

(XLSX)

S1 File

(DOCX)

Data Availability

The data underlying the results presented in the study are available from: https://data.mendeley.com/datasets/83rthbp8ys/2

Funding Statement

We acknowledge support from the German Research Foundation (DFG) and the Open Access Publication Fund of Charité – Universitätsmedizin Berlin.

References

  • 1.WHO. Depression and Other Common Mental Disorders: Global Health Estimates. https://apps.who.int/iris/bitstream/handle/10665/254610/WHO-MSD-MER-2017.2-eng.pdf.
  • 2.DGPPN. S3-Leitlinie und Nationale VersorgungsLeitlinie (NVL) Unipolare Depression, 2. Auflage. 2015. https://www.leitlinien.de/mdb/downloads/nvl/depression/depression-2aufl-vers5-lang.pdf.
  • 3.NICE. Depression in adults: recognition and management. 2009. https://www.nice.org.uk/guidance/cg90/chapter/1-Guidance#treatment-choice-based-on-depression-subtypes-and-personal-characteristics. [PubMed]
  • 4.Cipriani A, Furukawa TA, Salanti G, Chaimani A, Atkinson LZ, Ogawa Y, et al. Comparative efficacy and acceptability of 21 antidepressant drugs for the acute treatment of adults with major depressive disorder: a systematic review and network meta-analysis. Lancet [Internet]. 2018. April 7;391(10128):1357–66. Available from: 10.1016/S0140-6736(17)32802-7 [DOI] [PMC free article] [PubMed] [Google Scholar]
  • 5.Hamilton M. Development of a rating scale for primary depressive illness. Br J Soc Clin Psychol. 1967. December;6(4):278–96. 10.1111/j.2044-8260.1967.tb00530.x [DOI] [PubMed] [Google Scholar]
  • 6.Munkholm K, Paludan-Müller AS, Boesen K. Considering the methodological limitations in the evidence base of antidepressants for depression: a reanalysis of a network meta-analysis. BMJ Open [Internet]. 2019. June 1;9(6):e024886 Available from: http://bmjopen.bmj.com/content/9/6/e024886.abstract 10.1136/bmjopen-2018-024886 [DOI] [PMC free article] [PubMed] [Google Scholar]
  • 7.Leucht S, Fennema H, Engel R, Kaspers-Janssen M, Lepping P, Szegedi A. What does the HAMD mean? J Affect Disord. 2013. June;148(2–3):243–8. 10.1016/j.jad.2012.12.001 [DOI] [PubMed] [Google Scholar]
  • 8.National Institute for Health and Clinical Excellence. Depression: the NICE guideline on the treatment and management of depression in adults. Updated edition 2018. Leicester: British Psychological Society; 2010 [Internet]. Leicester (UK); 2010. Available from: https://www.ncbi.nlm.nih.gov/pubmed/22132433 [Google Scholar]
  • 9.Moncrieff J, Kirsch I. Empirically derived criteria cast doubt on the clinical significance of antidepressant-placebo differences. Contemp Clin Trials. 2015. July;43:60–2. 10.1016/j.cct.2015.05.005 [DOI] [PubMed] [Google Scholar]
  • 10.Senn S. Mastering variation: variance components and personalised medicine. Stat Med. 2016. March;35(7):966–77. 10.1002/sim.6739 [DOI] [PMC free article] [PubMed] [Google Scholar]
  • 11.Senn S. Statistical pitfalls of personalized medicine. Vol. 563, Nature. England; 2018. p. 619–21. 10.1038/d41586-018-07535-2 [DOI] [PubMed] [Google Scholar]
  • 12.Nakagawa S, Poulin R, Mengersen K, Reinhold K, Engqvist L, Lagisz M, et al. Meta-analysis of variation: ecological and evolutionary applications and beyond. Methods Ecol Evol [Internet]. 2015. February 1;6(2):143–52. Available from: 10.1111/2041-210X.12309 [DOI] [Google Scholar]
  • 13.Winkelbeiner S, Leucht S, Kane JM, Homan P. Evaluation of Differences in Individual Treatment Response in Schizophrenia Spectrum Disorders: A Meta-analysis. JAMA psychiatry. 2019. June;76(10):1063–73. 10.1001/jamapsychiatry.2019.1530 [DOI] [PMC free article] [PubMed] [Google Scholar]
  • 14.Plöderl M, Hengartner MP. What are the chances for personalised treatment with antidepressants? Detection of patient-by-treatment interaction with a variance ratio meta-analysis. BMJ Open [Internet]. 2019. December 1;9(12):e034816 Available from: http://bmjopen.bmj.com/content/9/12/e034816.abstract 10.1136/bmjopen-2019-034816 [DOI] [PMC free article] [PubMed] [Google Scholar]
  • 15.Munkholm K, Winkelbeiner S, Homan P. Individual response to antidepressants for depression in adults-a meta-analysis and simulation study. PLoS One [Internet]. 2020. August 27;15(8):e0237950 Available from: 10.1371/journal.pone.0237950 [DOI] [PMC free article] [PubMed] [Google Scholar]
  • 16.Maslej MM, Furukawa TA, Cipriani A, Andrews PW, Mulsant BH. Individual Differences in Response to Antidepressants: A Meta-analysis of Placebo-Controlled Randomized Clinical Trials. JAMA psychiatry. 2020. February;77(6):1–12. [DOI] [PMC free article] [PubMed] [Google Scholar] [Retracted]
  • 17.Montgomery SA, Asberg M. A new depression scale designed to be sensitive to change. Br J Psychiatry. 1979. April;134:382–9. 10.1192/bjp.134.4.382 [DOI] [PubMed] [Google Scholar]
  • 18.Rush AJ, Trivedi MH, Carmody TJ, Ibrahim HM, Markowitz JC, Keitner GI, et al. Self-Reported Depressive Symptom Measures: Sensitivity to Detecting Change in a Randomized, Controlled Trial of Chronically Depressed, Nonpsychotic Outpatients. Neuropsychopharmacology [Internet]. 2005;30(2):405–16. Available from: 10.1038/sj.npp.1300614 [DOI] [PubMed] [Google Scholar]
  • 19.Higgins JPT, Thompson SG, Spiegelhalter DJ. A re-evaluation of random-effects meta-analysis. J R Stat Soc Ser A Stat Soc [Internet]. 2009. January;172(1):137–59. Available from: https://pubmed.ncbi.nlm.nih.gov/19381330 [DOI] [PMC free article] [PubMed] [Google Scholar]
  • 20.McCutcheon RA, Pillinger T, Mizuno Y, Montgomery A, Pandian H, Vano L, et al. The efficacy and heterogeneity of antipsychotic response in schizophrenia: A meta-analysis. Mol Psychiatry. 2019. August; 10.1038/s41380-019-0502-5 [DOI] [PMC free article] [PubMed] [Google Scholar]
  • 21.Leucht S, Fennema H, Engel RR, Kaspers-Janssen M, Szegedi A. Translating the HAM-D into the MADRS and vice versa with equipercentile linking. J Affect Disord. 2018. January;226:326–31. 10.1016/j.jad.2017.09.042 [DOI] [PubMed] [Google Scholar]
  • 22.Deeks J, Higgins J, Altman D. Chapter 10: Analysing data and undertaking meta-analyses. In: Higgins JPT, Thomas J, Chandler J, Cumpston M, Li T, Page MJ, Welch VA(editors). Cochrane Handbook for Systematic Reviews of Interventions version 6. www.training.cochrane.org/handbook. [Google Scholar]
  • 23.Spiegelhalter DJ, Freedman LS, Parmar MKB. Bayesian Approaches to Randomized Trials. J R Stat Soc Ser A (Statistics Soc [Internet]. 1994. September 11;157(3):357–416. Available from: http://www.jstor.org/stable/2983527 [Google Scholar]
  • 24.Vehtari A, Gelman A, Gabry J. Practical Bayesian Model Evaluation Using Leave-One-Out Cross-Validation and WAIC. Stat Comput. 2016;275:1413–1432. [Google Scholar]
  • 25.Volkmann A. On the Relationship between Treatment Effect Heterogeneity and the Variability Ratio Effect Size Statistic. arXiv. 2020 Jun 21. [Google Scholar]
  • 26.Rabinowitz J, Werbeloff N, Mandel FS, Menard F, Marangell L, Kapur S. Initial depression severity and response to antidepressants v. placebo: patient-level data analysis from 34 randomised controlled trials. Br J Psychiatry. 2016. Nov;209(5):427–8. [DOI] [PubMed] [Google Scholar]
  • 27.Furukawa TA, Maruo K, Noma H, Tanaka S, Imai H, Shinohara K, et al. Initial severity of major depression and efficacy of new generation antidepressants: individual participant data meta-analysis. Acta Psychiatr Scand [Internet]. 2018. June 1;137(6):450–8. Available from: 10.1111/acps.12886 [DOI] [PubMed] [Google Scholar]
  • 28.Kirsch I, Deacon BJ, Huedo-Medina TB, Scoboria A, Moore TJ, Johnson BT. Initial Severity and Antidepressant Benefits: A Meta-Analysis of Data Submitted to the Food and Drug Administration. PLOS Med [Internet]. 2008. February 26;5(2):e45 Available from: 10.1371/journal.pmed.0050045 [DOI] [PMC free article] [PubMed] [Google Scholar]
  • 29.Fournier JC, DeRubeis RJ, Hollon SD, Dimidjian S, Amsterdam JD, Shelton RC, et al. Antidepressant Drug Effects and Depression Severity: A Patient-Level Meta-analysis. JAMA [Internet]. 2010. January 6;303(1):47–53. Available from: 10.1001/jama.2009.1943 [DOI] [PMC free article] [PubMed] [Google Scholar]

Decision Letter 0

Alan D Hutson

Transfer Alert

This paper was transferred from another journal. As a result, its full editorial history (including decision letters, peer reviews and author responses) may not be present.

14 Jul 2020

PONE-D-20-11332

On the treatment effect heterogeneity of antidepressants in major depression. A Bayesian meta-analysis

PLOS ONE

Dear Dr. Volkmann,

Thank you for submitting your manuscript to PLOS ONE. After careful consideration, we feel that it has merit but does not fully meet PLOS ONE’s publication criteria as it currently stands. Therefore, we invite you to submit a revised version of the manuscript that addresses the points raised during the review process.

Carefully attend to the reviewers' thoughtful and extensive comments.  The both found this work interesting and worthwhile.

Please submit your revised manuscript by Aug 28 2020 11:59PM. If you will need more time than this to complete your revisions, please reply to this message or contact the journal office at plosone@plos.org. When you're ready to submit your revision, log on to https://www.editorialmanager.com/pone/ and select the 'Submissions Needing Revision' folder to locate your manuscript file.

Please include the following items when submitting your revised manuscript:

  • A rebuttal letter that responds to each point raised by the academic editor and reviewer(s). You should upload this letter as a separate file labeled 'Response to Reviewers'.

  • A marked-up copy of your manuscript that highlights changes made to the original version. You should upload this as a separate file labeled 'Revised Manuscript with Track Changes'.

  • An unmarked version of your revised paper without tracked changes. You should upload this as a separate file labeled 'Manuscript'.

If you would like to make changes to your financial disclosure, please include your updated statement in your cover letter. Guidelines for resubmitting your figure files are available below the reviewer comments at the end of this letter.

If applicable, we recommend that you deposit your laboratory protocols in protocols.io to enhance the reproducibility of your results. Protocols.io assigns your protocol its own identifier (DOI) so that it can be cited independently in the future. For instructions see: http://journals.plos.org/plosone/s/submission-guidelines#loc-laboratory-protocols

We look forward to receiving your revised manuscript.

Kind regards,

Alan D Hutson

Academic Editor

PLOS ONE

Journal requirements:

When submitting your revision, we need you to address these additional requirements.

1. Please ensure that your manuscript meets PLOS ONE's style requirements, including those for file naming. The PLOS ONE style templates can be found at

https://journals.plos.org/plosone/s/file?id=wjVg/PLOSOne_formatting_sample_main_body.pdf and

https://journals.plos.org/plosone/s/file?id=ba62/PLOSOne_formatting_sample_title_authors_affiliations.pdf

:

2. Thank you for inclduing your competing interests statement; "I have read the journal's policy and the authors of this manuscript have the following competing interests: CAM received consulting fees from Silence Therapeutics, outside the submitted work. The other authors declare no competing interest."

Please confirm that this does not alter your adherence to all PLOS ONE policies on sharing data and materials, by including the following statement: "This does not alter our adherence to  PLOS ONE policies on sharing data and materials.” (as detailed online in our guide for authors http://journals.plos.org/plosone/s/competing-interests).  If there are restrictions on sharing of data and/or materials, please state these. Please note that we cannot proceed with consideration of your article until this information has been declared.

Please include your updated Competing Interests statement in your cover letter; we will change the online submission form on your behalf.

Please know it is PLOS ONE policy for corresponding authors to declare, on behalf of all authors, all potential competing interests for the purposes of transparency. PLOS defines a competing interest as anything that interferes with, or could reasonably be perceived as interfering with, the full and objective presentation, peer review, editorial decision-making, or publication of research or non-research articles submitted to one of the journals. Competing interests can be financial or non-financial, professional, or personal. Competing interests can arise in relationship to an organization or another person. Please follow this link to our website for more details on competing interests: http://journals.plos.org/plosone/s/competing-interests

3. Please include captions for your Supporting Information files at the end of your manuscript, and update any in-text citations to match accordingly. Please see our Supporting Information guidelines for more information: http://journals.plos.org/plosone/s/supporting-information.

[Note: HTML markup is below. Please do not edit.]

Reviewers' comments:

Reviewer's Responses to Questions

Comments to the Author

1. Is the manuscript technically sound, and do the data support the conclusions?

The manuscript must describe a technically sound piece of scientific research with data that supports the conclusions. Experiments must have been conducted rigorously, with appropriate controls, replication, and sample sizes. The conclusions must be drawn appropriately based on the data presented.

Reviewer #1: Yes

Reviewer #2: Yes

**********

2. Has the statistical analysis been performed appropriately and rigorously?

Reviewer #1: Yes

Reviewer #2: I Don't Know

**********

3. Have the authors made all data underlying the findings in their manuscript fully available?

The PLOS Data policy requires authors to make all data underlying the findings described in their manuscript fully available without restriction, with rare exception (please refer to the Data Availability Statement in the manuscript PDF file). The data should be provided as part of the manuscript or its supporting information, or deposited to a public repository. For example, in addition to summary statistics, the data points behind means, medians and variance measures should be available. If there are restrictions on publicly sharing data—e.g. participant privacy or use of data from a third party—those must be specified.

Reviewer #1: Yes

Reviewer #2: No

**********

4. Is the manuscript presented in an intelligible fashion and written in standard English?

PLOS ONE does not copyedit accepted manuscripts, so the language in submitted articles must be clear, correct, and unambiguous. Any typographical or grammatical errors should be corrected at revision, so please note any specific errors here.

Reviewer #1: Yes

Reviewer #2: Yes

**********

5. Review Comments to the Author

Please use the space provided to explain your answers to the questions above. You may also include additional comments for the author, including concerns about dual publication, research ethics, or publication ethics. (Please upload your review as an attachment if it exceeds 20,000 characters)

Reviewer #1: This is a very interesting paper. The aim is important and worthwhile investigating (although not that novel - other meta-analyses have quantified heterogeneity in these studies) and the methods used are appropriate and state of the art. I will focus on methods and reporting. The abstract is well-written and balanced. Code is freely available on github, which is great.

1) what is the evidence on the weakly-informed priors used? why these and not others? how sensitive is the key findings (practically zero heterogeneity) to the selection of priors?

2) page 10, the correlation section, I don't quite follow. perhaps restructure a bit? Basically the correlation betwen mean and SD needs to be low and its computed for each effect size type, and the one with the lowest correlation is selected? if that's the case, then readers will get lost a bit. the authors start by stating a comparison is performed and then it is not mentioned again. Or do they mean they just measure the correlation to model it and not introduce bias? or both?

3) Some aspects of the paper are tiring, e.g. explaining relatively aspects of meta-analyses on page 21 (fixed vs random) just provide a reference. You end up with a massive document that seems to be preaching to expert methodologists (Which is fine) but also novice meta-analysts! What is your readership? Can't have both.

4) Unless i've missed it, I'd have expected much more to be done with comparisons of heterogeneity estimates from other studies e.g. the Cipriani Lancet(?) paper. how do they compare, why are they different if they are etc. That should be a whole paragraph in the discussion. that would be much more useful than an explanation of random and fixed effect models. There is a sentence on page 18 referencing 2 studies, but it seems very little considering the whole premise of the paper is this.

Reviewer #2: The authors take on an important task of addressing one of the common assumptions permeating the field by using a large set of clinical trial data to investigate treatment heterogeneity. These analyses are potentially quite important and potentially innovative, but the background and introduction, in particular, could benefit from a more objective vantage that truly appreciates and integrates the breadth of this literature rather than arbitrarily selecting certain references for rhetorical purposes. I happen to agree with the authors that the effects of antidepressants are exaggerated and that compelling evidence for variables that moderate response to identify subgroups more likely to benefit (beyond severity of depression) is lacking. Thus, even though the authors findings and argument does not challenge my scientific viewpoint, there were several areas where the presentation and discussion displayed bias to make some point. This potentially undermines the credibility of what otherwise could be an important work so I’ve tried to point out where possible.

Critical point: References 34 and 35 appear to take on the same aims as this paper and analyze the same dataset. This was not reported until the discussion. This should be made crystal clear in the introduction and background and the authors have to make a case for why a third such analysis is needed to the reader. The value of the paper hinges on the authors ability to do that authentically and any overlap should be acknowledged.

Other points:

1) Introduction, paragraph 1, 1st sentence. “Depression” is not necessarily a disorder. Do the authors intend to focus on major depressive disorder as the title suggests?

2) I do not agree with the comment that antidepressants are broadly debated as an effective treatment. While some may indeed debate this, it seems the broader debate is more about how effective antidepressants are and whether and for what groups this crosses a threshold of clinical significance.

3) The HamD threshold of 3 has also been articulated in the UK NICE guidelines.

4) While I don’t disagree that the 50% improvement threshold is arbitrary, it is a very common a priori defined primary outcome for many trials. This may be worth noting as otherwise it implies the prior meta-analysis picked some arbitrary threshold.

5) Can you really claim as the methods do that this study includes “all RCTs”? Please clarify.

6) Please specify whether or not the authors made any attempt to get individual level data from

7) The authors and editor may want to consider whether the PRISMA diagram should be relegated to a supplementary figure. I think it is critically important and should not be relegated to a supplement. It may be helpful to have more detail about why certain studies were excluded. For how many was it due to not using the specific depression rating scales and for how many for not including continuous data.

8) Could the authors clarify whether they used study measures of effect size and variability from prior reports or if these were recalculated from individual level data for each study?

9) Other meta-analyses have found that antidepressants separate more from placebo the more severe the baseline symptoms. Did the authors look to see if their variability ratio differed by baseline severity of symptoms?

10) Discussion, I agree that 2 points is likely undetectable but “the minimally clinically relevant effect of 7 points” is not well justified. The paper cited makes this distinction based only on a very crude CGI scale, which ironically is almost always dichotomized for analyses, the very thing the authors argue against in their introduction.

11) Discussion. The authors state “These findings are in line with those of two recently published meta-analyses of antidepressants using the same dataset (34, 35).” Rather than leave the reader to look at both of these references, it would behoove the authors to explain what these analyses found and what the authors did that was different. Why was doing another analysis of the same dataset justified? What are these two studies just being cited now and not discussed in the background? (see critical point above)

12) It is very difficult to reviewer the figures with the descriptions buried elsewhere in the text. Even with the description, which I understand, I cannot tell at all what Figure 1 is trying to communicate. Why are some boxes red and some green? Why are they different sizes? How do we determine the treatment effect heterogeneity from a single patient example?

**********

6. PLOS authors have the option to publish the peer review history of their article (what does this mean?). If published, this will include your full peer review and any attached files.

If you choose “no”, your identity will remain anonymous but your review may still be made public.

Do you want your identity to be public for this peer review? For information about this choice, including consent withdrawal, please see our Privacy Policy.

Reviewer #1: No

Reviewer #2: No

[NOTE: If reviewer comments were submitted as an attachment file, they will be attached to this email and accessible via the submission site. Please log into your account, locate the manuscript record, and check for the action link "View Attachments". If this link does not appear, there are no attachment files.]

While revising your submission, please upload your figure files to the Preflight Analysis and Conversion Engine (PACE) digital diagnostic tool, https://pacev2.apexcovantage.com/. PACE helps ensure that figures meet PLOS requirements. To use PACE, you must first register as a user. Registration is free. Then, login and navigate to the UPLOAD tab, where you will find detailed instructions on how to use the tool. If you encounter any issues or have any questions when using PACE, please email PLOS at figures@plos.org. Please note that Supporting Information files do not need this step.

PLoS One. 2020 Nov 11;15(11):e0241497. doi: 10.1371/journal.pone.0241497.r002

Author response to Decision Letter 0


18 Sep 2020

Dear Reviewers,

First of all, we would like to thank you for your highly valuable input. We appreciate that you made the effort to understand our reasoning and methodology. Before answering your comments point by point, we would like to try to explain what differentiates our paper from previous analyses.

We believe that other published analyses (Plöderl, Maslej, Munkholm) did not consider important methodological issues when comparing the variability between antidepressants and placebo in the treatment of major depression.

Crucially, other publications did not take the linear relationship between lnMean and lnSD into account appropriately when estimating the direct effect of antidepressants on outcome variability. The CVR effect size implicitly assumes a slope coefficient of 1 on this relationship. If this assumptions are violated, this effect size yields a biased result.

The paper by Maslej et al. in JAMA Psychiatry applied the CVR effect size and erroneously concluded that there is evidence for treatment effect heterogeneity. We sent a letter to the journal pointing out the problem with the CVR effect size and the occurrence of different scales (https://www.researchgate.net/publication/342083346_Commentary_on_Maslej_et_al_No_evidence_of_individual_differences_in_response_to_antidepressants).The authors have acknowledged our reasoning and have subsequently retracted their paper from JAMA Psychiatry (https://jamanetwork.com/journals/jamapsychiatry/fullarticle/2767242).

We implemented a meta-regression model that integrates the true slope coefficient directly from the data and is thus more accurate. Furthermore, it allows us to disentangle direct and indirect effect (via the differences in means) of antidepressants on outcome variability.

All other groups have used a frequentist approach, which merely fails to reject a null hypothesis of equal variance of antidepressants and placebo. In contrast, we applied a Bayesian approach, which allowed us to quantify the range of plausible values for the VR (given the model assumptions).

Moreover, we demonstrated the exact relationship between the VR and the treatment effect heterogeneity, which has not been done by other publications.

Reviewer #1: This is a very interesting paper. The aim is important and worthwhile investigating (although not that novel - other meta-analyses have quantified heterogeneity in these studies) and the methods used are appropriate and state of the art. I will focus on methods and reporting. The abstract is well-written and balanced. Code is freely available on github, which is great.

1) what is the evidence on the weakly-informed priors used? why these and not others? how sensitive is the key findings (practically zero heterogeneity) to the selection of priors?

Response:

Thank you for this relevant point. As the amount of data is very large, we used minimally (almost non-) informative, regularizing priors. For example, for the μ parameter in the REMR model we used a Cauchy (0,1) prior.

We agree that it is appropriate to test the influence of different priors. We have therefore conducted a sensitivity analysis using an optimistic normal prior, centering the mean at 2 (suggesting a 100% increased variance in the antidepressant group) with a 5% probability of VR below 1. This did not alter the results.

2) page 10, the correlation section, I don't quite follow. perhaps restructure a bit? Basically the correlation betwen mean and SD needs to be low and its computed for each effect size type, and the one with the lowest correlation is selected? if that's the case, then readers will get lost a bit. the authors start by stating a comparison is performed and then it is not mentioned again. Or do they mean they just measure the correlation to model it and not introduce bias? or both?

Response:

Thank you for bringing up this point, which is a crucial point in our analysis, distinguishing it from previous analyses. We have tried to make it clearer in the paper (see page 8).

We can think of the problem this way:

If we want to estimate the direct effect of antidepressants on outcome variability,

If we want to know how much of the difference in variability between two groups (AD and Pbo) is due to the treatment, we need to assess how much of the difference in SDs is explained by the difference in means, such that we don’t falsely attribute it to the treatment variable. If we control for the differences in means, we can get the direct effect of ADs on outcome variability (see new figure 3).

The CVR effect size controls for the difference in means but makes rigid assumptions on the relationship between lnMean and lnSD, implicitly assuming a slope coefficient of 1 on this relationship. If this assumption is violated, the CVR gives a biased result.

In the first part of the paper, we regress the lnMean and lnSD in order to test the assumptions of both the VR and the CVR. If the slope coefficient is near 0, the VR would be more appropriate. If the slope coefficient is near 1, the CVR would be the better fit.

Our meta regression model (REMR) directly integrates the slope coefficient into the model and is therefore more appropriate/exact.

To answer your last point. Does the correlation need to be low? No, but the assumed correlation should be similar to the real one.

The “true” slope coefficient is around 0.1, the CVR assumes a slope of 1 and is thus far off and hence not an appropriate effect size.

3) Some aspects of the paper are tiring, e.g. explaining relatively aspects of meta-analyses on page 21 (fixed vs random) just provide a reference. You end up with a massive document that seems to be preaching to expert methodologists (Which is fine) but also novice meta-analysts! What is your readership? Can't have both.

Response:

We have tried to shorten parts of the paper that seemed too long/tiring. Specifically, we moved several paragraphs to the methods section (e.g. random vs. fixed effects) and deleted others.

We agree that we mix highly technical language with a language directed at a readership of clinicians. As we regard the methodology to be the strength of our paper, distinguishing it from previous analyses, we have decided to focus on this.

4) Unless i've missed it, I'd have expected much more to be done with comparisons of heterogeneity estimates from other studies e.g. the Cipriani Lancet(?) paper. how do they compare, why are they different if they are etc. That should be a whole paragraph in the discussion. that would be much more useful than an explanation of random and fixed effect models. There is a sentence on page 18 referencing 2 studies, but it seems very little considering the whole premise of the paper is this.

Response:

We have added a more detailed discussion of previous analyses and what distinguishes our paper from these. First in the introduction and secondly in the discussion (under Methodological aspects).

As pointed out above, other publications did not consider methodological issues with the VR/CVR effect size and did not take into account the occurrence of different depression scales. Furthermore, we applied a Bayesian approach, which allowed us to quantify the range of plausible values for the VR (as mentioned above).

Reviewer #2: The authors take on an important task of addressing one of the common assumptions permeating the field by using a large set of clinical trial data to investigate treatment heterogeneity. These analyses are potentially quite important and potentially innovative, but the background and introduction, in particular, could benefit from a more objective vantage that truly appreciates and integrates the breadth of this literature rather than arbitrarily selecting certain references for rhetorical purposes. I happen to agree with the authors that the effects of antidepressants are exaggerated and that compelling evidence for variables that moderate response to identify subgroups more likely to benefit (beyond severity of depression) is lacking. Thus, even though the authors findings and argument does not challenge my scientific viewpoint, there were several areas where the presentation and discussion displayed bias to make some point. This potentially undermines the credibility of what otherwise could be an important work so I’ve tried to point out where possible.

Critical point: References 34 and 35 appear to take on the same aims as this paper and analyze the same dataset. This was not reported until the discussion. This should be made crystal clear in the introduction and background and the authors have to make a case for why a third such analysis is needed to the reader. The value of the paper hinges on the authors ability to do that authentically and any overlap should be acknowledged.

Response:

We have shortened the general discussion on the efficacy of antidepressants and have focused on the methodological aspect of the VR/CVR. We tried to remove remarks from the introduction that could be considered biased or one-sided. We have included a more detailed discussion of previous/simultaneous analyses on this research question in the introduction and in the discussion section (see Methodological aspects). Please also see our introductory remarks that point out what distinguishes our analysis from other works.

Other points:

1) Introduction, paragraph 1, 1st sentence. “Depression” is not necessarily a disorder. Do the authors intend to focus on major depressive disorder as the title suggests?

Response:

We have replaced the term depression with major depressive disorder/major depression.

2) I do not agree with the comment that antidepressants are broadly debated as an effective treatment. While some may indeed debate this, it seems the broader debate is more about how effective antidepressants are and whether and for what groups this crosses a threshold of clinical significance.

Response:

We have adjusted the language here and have deleted the sentence referring to said debate.

3) The HamD threshold of 3 has also been articulated in the UK NICE guidelines.

Response:

We agree with the reviewer that different thresholds have been suggested and have included this one in our discussion of clinical significance.

4) While I don’t disagree that the 50% improvement threshold is arbitrary, it is a very common a priori defined primary outcome for many trials. This may be worth noting as otherwise it implies the prior meta-analysis picked some arbitrary threshold.

Response:

We have deleted this passage in order to shorten the introduction.

5) Can you really claim as the methods do that this study includes “all RCTs”? Please clarify.

Response:

We have deleted the word “all”. The word all was referring to all RCTs identified by the Cipriani group.

6) Please specify whether or not the authors made any attempt to get individual level data from

Response:

We have not tried to get individual patient data, as we wanted to focus on summary data (mean, SD).

7) The authors and editor may want to consider whether the PRISMA diagram should be relegated to a supplementary figure. I think it is critically important and should not be relegated to a supplement. It may be helpful to have more detail about why certain studies were excluded. For how many was it due to not using the specific depression rating scales and for how many for not including continuous data.

Response:

We have included all RCTs from the Cipriani dataset with a placebo arm that reported change scores. For the main analyses, we have not excluded any studies based on their depression scale. We have moved the PRISMA flow chart to the main file.

8) Could the authors clarify whether they used study measures of effect size and variability from prior reports or if these were recalculated from individual level data for each study?

Response:

We have not recalculated these measures from individual patient data, which we had no access to. We have used the study measures of mean and SD that are publicly available here: https://data.mendeley.com/datasets/83rthbp8ys/2

9) Other meta-analyses have found that antidepressants separate more from placebo the more severe the baseline symptoms. Did the authors look to see if their variability ratio differed by baseline severity of symptoms?

Response:

We have included an additional analysis (page 16), adding the baseline severity as a predictor into the meta-regression model. This variable did not seem to have a detectable influence on outcome variability.

To our knowledge there are 5 analyses investigating the influence of baseline severity on the antidepressant treatment effect. The 3 newest and 2 largest analyses could not confirm this association, which therefore remains uncertain.

Analyses reporting such an association:

Kirsch I, Deacon BJ, Huedo-Medina TB, Scoboria A, Moore TJ, et al. (2008) Initial Severity and Antidepressant Benefits: A Meta-Analysis of Data Submitted to the Food and Drug Administration. PLOS Medicine 5(2): e45.

5,133 patients from 35 trials, reporting an influence of baseline severity on treatment effect.

Fournier JC, DeRubeis RJ, Hollon SD, et al. Antidepressant drug effects and depression severity: a patient-level meta-analysis. JAMA. 2010;303(1):47-53. doi:10.1001/jama.2009.1943

718 patients from 6 studies.

Newer studies could not confirm this effect and did not find an influence of baseline severity on treatment effect:

Furukawa, T. A., Maruo, K., Noma, H., Tanaka, S., Imai, H., Shinohara, K., . . . Cipriani, A. (2018). Initial severity of major depression and efficacy of new generation antidepressants: individual participant data meta-analysis. Acta Psychiatr Scand, 137(6), 450-458. doi:10.1111/acps.12886

2464 patients from 4 studies

Rabinowitz, J., Werbeloff, N., Mandel, F. S., Menard, F., Marangell, L., & Kapur, S. (2016). Initial depression severity and response to antidepressants v. placebo: patient-level data analysis from 34 randomised controlled trials. Br J Psychiatry, 209(5), 427-428. doi:10.1192/bjp.bp.115.173906

10.737 patients from 34 studies

Gibbons RD, Hur K, Brown CH, Davis JM, Mann JJ. Benefits from antidepressants: synthesis of 6-week patient-level outcomes from double-blind placebo-controlled randomized trials of fluoxetine and venlafaxine. Arch Gen Psychiatry. 2012;69(6):572-579. doi:10.1001/archgenpsychiatry.2011.2044

8.477 patients from 37 studies

We have also included a subgroup analysis analyzing different antidepressant classes individually.

10) Discussion, I agree that 2 points is likely undetectable but “the minimally clinically relevant effect of 7 points” is not well justified. The paper cited makes this distinction based only on a very crude CGI scale, which ironically is almost always dichotomized for analyses, the very thing the authors argue against in their introduction.

Response:

Trying to answer the question of clinical significance inherently involves a dichotomous response, which is indeed an issue difficult to overcome. We agree that the CGI is a discrete measure and therefore also prone to similar problems. It can therefore merely serve as a reference point, not a strict cut-off. It does have 7 levels, which may be slightly better than dichotomizing (yes/no).

We have included 3 points based on the NICE guidelines as another possible threshold for clinical significance, as you suggested above.

11) Discussion. The authors state “These findings are in line with those of two recently published meta-analyses of antidepressants using the same dataset (34, 35).” Rather than leave the reader to look at both of these references, it would behoove the authors to explain what these analyses found and what the authors did that was different. Why was doing another analysis of the same dataset justified? What are these two studies just being cited now and not discussed in the background? (see critical point above)

Response:

As mentioned in the introductory remarks, we have included a detailed discussion of previous analyses and what distinguishes our paper from them.

12) It is very difficult to reviewer the figures with the descriptions buried elsewhere in the text. Even with the description, which I understand, I cannot tell at all what Figure 1 is trying to communicate. Why are some boxes red and some green? Why are they different sizes? How do we determine the treatment effect heterogeneity from a single patient example?

Response:

In figure 1 we have tried to communicate the epistemological problem of determining the true effect of an intervention and the treatment effect heterogeneity. The causal effect of a treatment is the difference between two hypothetical worlds, which are depicted in the figure: A world in which the patient receives the treatment and one in which he doesn’t.

As only one of both can occur, we can never know the true effect for a single patient.

We felt that it is important to conceptualize this problem in order to clarify what the treatment effect means (the difference between these worlds, rather than the observed change), as this understanding is crucial for understanding the concept of treatment effect heterogeneity, which signifies how strongly this causal effect varies among different individuals.

We have slightly adapted the description of the figure, hoping that it is now a bit clearer. The boxes represent the remaining depression severity (red) and the improved depression severity (green).

If the editor or reviewers feel that this figure is not helpful or confusing, we could discard it, too.

6. PLOS authors have the option to publish the peer review history of their article (what does this mean?). If published, this will include your full peer review and any attached files.

If you choose “no”, your identity will remain anonymous but your review may still be made public.

Do you want your identity to be public for this peer review? For information about this choice, including consent withdrawal, please see our Privacy Policy.

Reviewer #1: No

Reviewer #2: No

Decision Letter 1

Alan D Hutson

2 Oct 2020

PONE-D-20-11332R1

On the treatment effect heterogeneity of antidepressants in major depression. A Bayesian meta-analysis and simulation study

PLOS ONE

Dear Dr. Volkmann,

Thank you for submitting your manuscript to PLOS ONE. After careful consideration, we feel that it has merit but does not fully meet PLOS ONE’s publication criteria as it currently stands. Therefore, we invite you to submit a revised version of the manuscript that addresses the points raised during the review process.

==============================

ACADEMIC EDITOR:There are still two key points from reviewer 2 that need to be addressed.  These appear to be readily fixable. 

==============================

Please submit your revised manuscript by Nov 16 2020 11:59PM. If you will need more time than this to complete your revisions, please reply to this message or contact the journal office at plosone@plos.org. When you're ready to submit your revision, log on to https://www.editorialmanager.com/pone/ and select the 'Submissions Needing Revision' folder to locate your manuscript file.

Please include the following items when submitting your revised manuscript:

  • A rebuttal letter that responds to each point raised by the academic editor and reviewer(s). You should upload this letter as a separate file labeled 'Response to Reviewers'.

  • A marked-up copy of your manuscript that highlights changes made to the original version. You should upload this as a separate file labeled 'Revised Manuscript with Track Changes'.

  • An unmarked version of your revised paper without tracked changes. You should upload this as a separate file labeled 'Manuscript'.

If you would like to make changes to your financial disclosure, please include your updated statement in your cover letter. Guidelines for resubmitting your figure files are available below the reviewer comments at the end of this letter.

If applicable, we recommend that you deposit your laboratory protocols in protocols.io to enhance the reproducibility of your results. Protocols.io assigns your protocol its own identifier (DOI) so that it can be cited independently in the future. For instructions see: http://journals.plos.org/plosone/s/submission-guidelines#loc-laboratory-protocols

We look forward to receiving your revised manuscript.

Kind regards,

Alan D Hutson

Academic Editor

PLOS ONE

[Note: HTML markup is below. Please do not edit.]

Reviewers' comments:

Reviewer's Responses to Questions

Comments to the Author

1. If the authors have adequately addressed your comments raised in a previous round of review and you feel that this manuscript is now acceptable for publication, you may indicate that here to bypass the “Comments to the Author” section, enter your conflict of interest statement in the “Confidential to Editor” section, and submit your "Accept" recommendation.

Reviewer #1: All comments have been addressed

Reviewer #2: (No Response)

**********

2. Is the manuscript technically sound, and do the data support the conclusions?

The manuscript must describe a technically sound piece of scientific research with data that supports the conclusions. Experiments must have been conducted rigorously, with appropriate controls, replication, and sample sizes. The conclusions must be drawn appropriately based on the data presented.

Reviewer #1: Yes

Reviewer #2: Yes

**********

3. Has the statistical analysis been performed appropriately and rigorously?

Reviewer #1: Yes

Reviewer #2: Yes

**********

4. Have the authors made all data underlying the findings in their manuscript fully available?

The PLOS Data policy requires authors to make all data underlying the findings described in their manuscript fully available without restriction, with rare exception (please refer to the Data Availability Statement in the manuscript PDF file). The data should be provided as part of the manuscript or its supporting information, or deposited to a public repository. For example, in addition to summary statistics, the data points behind means, medians and variance measures should be available. If there are restrictions on publicly sharing data—e.g. participant privacy or use of data from a third party—those must be specified.

Reviewer #1: Yes

Reviewer #2: Yes

**********

5. Is the manuscript presented in an intelligible fashion and written in standard English?

PLOS ONE does not copyedit accepted manuscripts, so the language in submitted articles must be clear, correct, and unambiguous. Any typographical or grammatical errors should be corrected at revision, so please note any specific errors here.

Reviewer #1: Yes

Reviewer #2: No

**********

6. Review Comments to the Author

Please use the space provided to explain your answers to the questions above. You may also include additional comments for the author, including concerns about dual publication, research ethics, or publication ethics. (Please upload your review as an attachment if it exceeds 20,000 characters)

Reviewer #1: I am happy with the authors' responses and the resulting changes to the document. I hope the process has improved the paper.

Reviewer #2: After reading the response to review, it didn't seem the introduction made clear that prior analyses (and what analyses) used the exact same dataset. This was my most critical point, highlighted as “critical point” in the review. It should be explicitly clear to the reader throughout that two prior analyses used this same dataset and that you are using the same dataset and it should be directly reported how these analyses are different, not indirectly by describing them as if they were studies from separate samples. Be direct and clear about what they did not do and what you are now doing. In addition to this, in the final paragraph of the introduction, you should state that the present study is using the same sample as those prior studies.

Please be sure specify in the manuscript for the reader that you did not make any attempt to get individual level data and that the effect sizes were from not recalculated from individual level data. The limitations do also make this clear.

Figure 1 is now more clear.

**********

7. PLOS authors have the option to publish the peer review history of their article (what does this mean?). If published, this will include your full peer review and any attached files.

If you choose “no”, your identity will remain anonymous but your review may still be made public.

Do you want your identity to be public for this peer review? For information about this choice, including consent withdrawal, please see our Privacy Policy.

Reviewer #1: No

Reviewer #2: No

[NOTE: If reviewer comments were submitted as an attachment file, they will be attached to this email and accessible via the submission site. Please log into your account, locate the manuscript record, and check for the action link "View Attachments". If this link does not appear, there are no attachment files.]

While revising your submission, please upload your figure files to the Preflight Analysis and Conversion Engine (PACE) digital diagnostic tool, https://pacev2.apexcovantage.com/. PACE helps ensure that figures meet PLOS requirements. To use PACE, you must first register as a user. Registration is free. Then, login and navigate to the UPLOAD tab, where you will find detailed instructions on how to use the tool. If you encounter any issues or have any questions when using PACE, please email PLOS at figures@plos.org. Please note that Supporting Information files do not need this step.

PLoS One. 2020 Nov 11;15(11):e0241497. doi: 10.1371/journal.pone.0241497.r004

Author response to Decision Letter 1


5 Oct 2020

Dear Reviewers,

thank you for your comments.

Please consider the last part of the introduction beginning at line 109. We have tried to make it as clear as possible that we reanalyzed a previously analyzed dataset. We have furthermore added a passage explaining the difference of our analysis to the previous ones. See the passage here:

"Three other research groups (14–16) have addressed the same question of treatment effect heterogeneity of antidepressants using the same dataset.

However, all previous analyses did not sufficiently take into account the linear association between the logarithmic mean and logarithmic standard deviation (SD) of the underlying measuring scale when estimating the direct effect of antidepressants on outcome variability. The VR and the CVR effect sizes naively assume a slope coefficient of 0 and 1 on this association, respectively, and may thus yield biased results if the slope coefficient differs from the assumed one. Crucially, using the VR in this dataset suggests no evidence for treatment effect heterogeneity (14,15), while using the CVR leads to the conclusion of a variable antidepressant treatment effect (16).

We reanalyzed the Cipriani dataset by implementing a Bayesian meta-regression that models the degree of linear association between lnMean and lnSD directly from the data and thus yields more accurate results. We illustrated the exact relationship between VR and CVR and their respective limitations and disentangled direct and indirect effect of antidepressants on outcome variability. We showed that the CVR is a suboptimal measure, as it makes strong assumptions that are not warranted in this dataset. Furthermore, we investigated the compatibility of the results with different degrees of treatment effect heterogeneity using simulations experiments. Using an analytically derived formula, we provided an upper bound on the treatment effect heterogeneity based on the VR estimate."

We have further added this sentence in the methods section: “We did not attempt to obtain individual patient data but relied on summary data from the openly accessible dataset.”, in order to stress that we used summary data. This is reiterated in the limitations section.

Best regards,

Constantin Volkmann

(corresponding author)

Attachment

Submitted filename: CoverLetterRevision_.docx

Decision Letter 2

Alan D Hutson

16 Oct 2020

On the treatment effect heterogeneity of antidepressants in major depression. A Bayesian meta-analysis and simulation study

PONE-D-20-11332R2

Dear Dr. Volkmann,

We’re pleased to inform you that your manuscript has been judged scientifically suitable for publication and will be formally accepted for publication once it meets all outstanding technical requirements.

Within one week, you’ll receive an e-mail detailing the required amendments. When these have been addressed, you’ll receive a formal acceptance letter and your manuscript will be scheduled for publication.

An invoice for payment will follow shortly after the formal acceptance. To ensure an efficient process, please log into Editorial Manager at http://www.editorialmanager.com/pone/, click the 'Update My Information' link at the top of the page, and double check that your user information is up-to-date. If you have any billing related questions, please contact our Author Billing department directly at authorbilling@plos.org.

If your institution or institutions have a press office, please notify them about your upcoming paper to help maximize its impact. If they’ll be preparing press materials, please inform our press team as soon as possible -- no later than 48 hours after receiving the formal acceptance. Your manuscript will remain under strict press embargo until 2 pm Eastern Time on the date of publication. For more information, please contact onepress@plos.org.

Kind regards,

Alan D Hutson

Academic Editor

PLOS ONE

Additional Editor Comments (optional):

Reviewers' comments:

Reviewer's Responses to Questions

Comments to the Author

1. If the authors have adequately addressed your comments raised in a previous round of review and you feel that this manuscript is now acceptable for publication, you may indicate that here to bypass the “Comments to the Author” section, enter your conflict of interest statement in the “Confidential to Editor” section, and submit your "Accept" recommendation.

Reviewer #1: All comments have been addressed

Reviewer #2: All comments have been addressed

**********

2. Is the manuscript technically sound, and do the data support the conclusions?

The manuscript must describe a technically sound piece of scientific research with data that supports the conclusions. Experiments must have been conducted rigorously, with appropriate controls, replication, and sample sizes. The conclusions must be drawn appropriately based on the data presented.

Reviewer #1: Yes

Reviewer #2: Yes

**********

3. Has the statistical analysis been performed appropriately and rigorously?

Reviewer #1: Yes

Reviewer #2: I Don't Know

**********

4. Have the authors made all data underlying the findings in their manuscript fully available?

The PLOS Data policy requires authors to make all data underlying the findings described in their manuscript fully available without restriction, with rare exception (please refer to the Data Availability Statement in the manuscript PDF file). The data should be provided as part of the manuscript or its supporting information, or deposited to a public repository. For example, in addition to summary statistics, the data points behind means, medians and variance measures should be available. If there are restrictions on publicly sharing data—e.g. participant privacy or use of data from a third party—those must be specified.

Reviewer #1: Yes

Reviewer #2: Yes

**********

5. Is the manuscript presented in an intelligible fashion and written in standard English?

PLOS ONE does not copyedit accepted manuscripts, so the language in submitted articles must be clear, correct, and unambiguous. Any typographical or grammatical errors should be corrected at revision, so please note any specific errors here.

Reviewer #1: Yes

Reviewer #2: Yes

**********

6. Review Comments to the Author

Please use the space provided to explain your answers to the questions above. You may also include additional comments for the author, including concerns about dual publication, research ethics, or publication ethics. (Please upload your review as an attachment if it exceeds 20,000 characters)

Reviewer #1: I am happy with the authors' responses and the resulting changes to the document. I hope the process has improved the paper.

Reviewer #2: (No Response)

**********

7. PLOS authors have the option to publish the peer review history of their article (what does this mean?). If published, this will include your full peer review and any attached files.

If you choose “no”, your identity will remain anonymous but your review may still be made public.

Do you want your identity to be public for this peer review? For information about this choice, including consent withdrawal, please see our Privacy Policy.

Reviewer #1: No

Reviewer #2: No

Acceptance letter

Alan D Hutson

26 Oct 2020

PONE-D-20-11332R2

On the treatment effect heterogeneity of antidepressants in major depression. A Bayesian meta-analysis and simulation study

Dear Dr. Volkmann:

I'm pleased to inform you that your manuscript has been deemed suitable for publication in PLOS ONE. Congratulations! Your manuscript is now with our production department.

If your institution or institutions have a press office, please let them know about your upcoming paper now to help maximize its impact. If they'll be preparing press materials, please inform our press team within the next 48 hours. Your manuscript will remain under strict press embargo until 2 pm Eastern Time on the date of publication. For more information please contact onepress@plos.org.

If we can help with anything else, please email us at plosone@plos.org.

Thank you for submitting your work to PLOS ONE and supporting open access.

Kind regards,

PLOS ONE Editorial Office Staff

on behalf of

Dr. Alan D Hutson

Academic Editor

PLOS ONE

Associated Data

    This section collects any data citations, data availability statements, or supplementary materials included in this article.

    Supplementary Materials

    S1 Checklist. PRISMA 2009 checklist.

    (DOC)

    S2 Checklist

    (XLSX)

    S1 Fig

    (TIFF)

    S2 Fig

    (TIFF)

    S3 Fig

    (TIFF)

    S4 Fig

    (TIFF)

    S5 Fig

    (TIFF)

    S6 Fig

    (TIFF)

    S1 Data

    (XLSX)

    S1 File

    (DOCX)

    Attachment

    Submitted filename: CoverLetterRevision_.docx

    Data Availability Statement

    The data underlying the results presented in the study are available from: https://data.mendeley.com/datasets/83rthbp8ys/2


    Articles from PLoS ONE are provided here courtesy of PLOS

    RESOURCES