Abstract
BACKGROUND AND PURPOSE: Transcranial color-coded duplex sonography (TCCS) allows the noninvasive, easily reproducible measurement of midline dislocation (MLD) of the third ventricle in space-occupying stroke, even in critically ill patients. However, the method has been validated only in a small number of subjects. The aim of this study was to test the method under clinical conditions.
METHODS: In 61 prospectively recruited patients (mean age, 62 ± 15 years) with supratentorial ischemic infarction or intracranial hemorrhage, the sonographic measurement of MLD was compared with cranial CT data in a 12-hour time window. Subgroup analysis was also undertaken for comparing TCCS and cranial CT measurements within a 3-hour time window.
RESULTS: One hundred twenty-two data pairs of TCCS and cranial CT MLD measurements were correlated within the 12-hour time window. TCCS and cranial CT measurements of MLD correlated both in the total patient group and in the different subgroups with coefficients of over 0.9. The 2-SD confidence interval of the difference between the TCCS measurements and the respective means of both methods in the total patient collective was ±1.78 mm.
CONCLUSION: TCCS provides a noninvasive, easily reproducible and reliable method for monitoring MLD of the third ventricle in stroke patients. It is particularly suitable for critically ill patients who are not fit for transportation.
The mortality of patients with stroke due to occlusion of the middle cerebral artery (MCA) varies from 5% to 40% (1, 2). Progressive postischemic brain edema is the main cause of death in these patients, as raised intracranial pressure leads to increasing dislocation of midline structures and subsequently to axial brain stem herniation (3–5). In the subgroup of patients with so called “malignant” MCA stroke (ie, an MCA stroke with rapidly progressive postischemic brain edema refractory to conservative therapeutic interventions), mortality reaches 80% (6). The results of several open, prospective studies indicate that decompressive craniotomy may decrease mortality in malignant MCA stroke to 50% (7–9). Although the degree of midline dislocation (MLD) correlates with the deterioration of the level of consciousness (10), clinical criteria alone provide only limited help for deciding on early decompressive craniotomy, because signs of brain stem herniation appear late in the course of progressive space-occupying brain edema. Furthermore, patients may be artificially ventilated, making their neurologic status hard to assess. Pullicino and coworkers (5) correlated survival figures with MLD data of serial cranial CT performed within 48 hours of symptom onset in 118 patients with ischemic stroke. In that study, a dislocation of the epiphyses gland of 4 mm or more within 48 hours correlated with a low 14-day probability of survival with a specificity of 89% and a sensitivity of 46%. In a study by our own group on 16 patients with occlusion of the MCA (11), all patients with MLD of the third ventricle of 4 mm or greater within 32 hours after stroke onset died of brain stem herniation, apart from one patient who underwent decompressive craniotomy; all other patients survived.
Since cranial CT potentially requires the transportation of critically ill patients, TCCS is a much more suitable and indeed ideal bedside method for monitoring purposes. TCCS enables noninvasive imaging of the brain parenchyma and ventricular system, and of the dislocation of the third ventricle in stroke patients in particular (12–14).
The aim of this study was to assess the accuracy of TCCS measurements of the third ventricle MLD in comparison with cranial CT data in a routine intensive care or stroke unit setting in patients with ischemic stroke or intracerebral hematoma. Furthermore, we tested whether correlation of TCCS and cranial CT measurements of MLD is dependent on the type of stroke, since the hyperechogenicity of blood in TCCS imaging may influence the accuracy of the measurements.
Methods
Patients
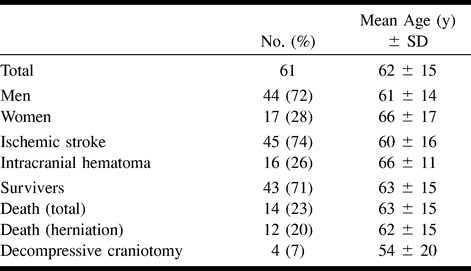
The MLD of the third ventricle was measured by TCCS in 61 patients with ischemic stroke or intracerebral hematoma (mean age, 62 ± 15 years; range, 28–91 years). Additional patient information is given in Table 1A and B. The patients were studied prospectively between December 1996 and December 1998. Inclusion criteria were a maximal time interval of 12 hours between stroke onset and admission, with a clearly defined time of symptom onset. To include patients with potentially large cerebral lesions, a maximal Scandinavian stroke scale score of 2 for arm or leg motor power or a maximal score of 4 for the level of consciousness was required. Those patients with spontaneous resolution of symptoms within 24 hours or with focal neurologic deficits due to a migraine attack or with Todd's paralysis due to seizures were excluded retrospectively at the conclusion of the study.
TABLE 1A:
Distribution of patients according to age, sex, type of stroke, and outcome
Sonographic measurements were obtained by four sonographers with sufficient experience with the method. Cranial CT scans were routinely obtained in the department of neuroradiology. Since this study was observational in character, the timing of cranial CT scans was based solely on the decision of the treating neurologist independent of the sonographers. Sonographers were blinded to the cranial CT results. At a given point in time, sonographic measurements were performed once; 20 patients were monitored twice, nine patients three times, six patients four times, and one patient five times. Since it was not possible to blind the sonographer to the patients' clinical deterioration or improvement or to the diagnosis of ischemic stroke versus intracerebral hematoma, because blood appears echogenic on the B-mode scan, the majority of patients were examined by the same individual.
The sonographic MLD measurements were compared with the cranial CT data. Within a time window of 12 hours (mean, 4.4 ± 2.7 hours) or 3 hours (mean, 2.1 ± 0.8 hours), 122 or 50 cranial CT and TCCS data pairs were correlated, respectively. Ninety-six TCCS/cranial CT data pairs were obtained within a 12-hour time window of transcranial sonography and cranial CT for patients with ischemic stroke (26 for patients with supratentorial intracerebral hematoma). The study was conducted according to the institution's ethical guidelines.
Sonographic MLD Measurements
Transcranial color-coded duplex sonography was performed in the usual fashion with a 2.5- or 2.0-MHz transducer (Hewlett Packard Sonos 2000 or 2500) insonating in a transverse plane through the temporal acoustic bone window. Sonographic measurement of MLD of the third ventricle was performed according to the method described by Seidel and coworkers (14): after identifying the arteries of the circle of Willis, the depth of the insonation window was adjusted (usually 16 cm) so that the mesencephalon in the center of the brain and the contralateral skull became visible. From this position, the transducer was tilted upward by 10°, from which the third ventricle could easily be identified by its hyperechogenic double reflex (Fig 1A and B), surrounded by the hypoechogenic thalamic complex and the hyperechogenic pineal gland dorsal to the ventricle. By constructing a perpendicular line from the origin of the ultrasound beam to the middle of the double reflex (ie, the distance between the external tabula of the temporal bone to the middle of the third ventricle), the unilateral distance to the third ventricle could be measured (distance A). This was repeated for the contralateral side (distance B). MLD of the third ventricle was calculated according to the formula MLD = (A − B)/2.
fig 1.
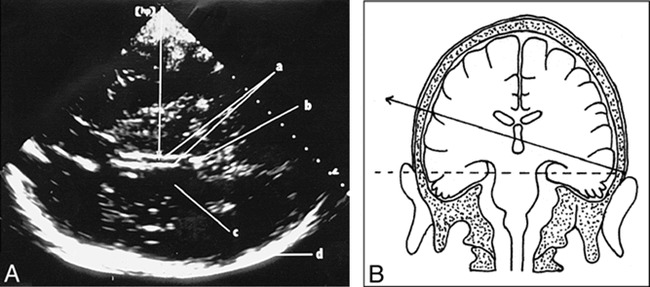
A, Axial transtemporal TCCS shows the third ventricle (a) as hyperechogenic double reflex, the pineal region (b), the hypoechogenic thalamus (c), and the contralateral scull (d). Arrow indicates the principle of the measurement of the distance from the center of the ultrasound beam to the middle of the third ventricle. Half the difference of this distance, measured from both sides, gives the sonographic MLD of the third ventricle.
B, Schematic drawing illustrates the placement and angulation of the ultrasound transducer.
Cranial CT
The sonographically measured MLD of the third ventricle was compared with the cranial CT data. All cranial CT scans (Siemens Somatotom HiQ or Somatotom plus S) were obtained in the usual orbitomeatal projection with a section thickness of 4 to 8 mm. MLD of the third ventricle was calculated in a fashion analogous to that for TCCS by measuring the distance between the external tabula of the skull bone to the middle of the third ventricle on both sides using the previously stated formula.
Statistical Evaluation
The software package Turbo Statistik 3.0 was used for statistical evaluation, and a linear regression analysis was used for comparing TCCS and cranial CT MLD measurements. As a second step, data were then analyzed according to a method described by Bland and Altman (15) (ie, the difference between the sonographic and CT MLD (DTCCS→cranial CT) was related to the respective mean of both measurements) to exclude any systematic bias of the data. The hypothesis that the DTCCS→cranial CT values were normally distributed could not be rejected. Therefore, confidence intervals (CI) of 2 SD were calculated according to the formula CI = mean (DTCCS→cranial CT) ± 1.96 √(ΣD2TCCS→cranial CTi)/n) (15). Student's t-test was used for comparing the different groups. To compare correlation coefficients of the different groups, a method described by Thöni (16) was employed. The following subgroups were defined for further analysis: TCCS/cranial CT time window of 12 hours or less; TCCS/cranial CT time window of 3 hours or less; ischemic supratentorial stroke; supratentorial hematoma; MLD greater than 4 mm; and MLD 4 mm or less.
Results
The results of linear regression analysis of the whole patient collective and the different subgroups are summarized in Table 2. For the whole collective (Fig 2) as well as for the different subgroups, the TCCS/cranial CT correlation coefficients were greater than 0.9. No statistically significant differences for the TCCS/cranial CT correlation within the different subgroups or between the whole collective were found.
TABLE 2:
Correlation coefficients of the TCCS midline dislocation (MLD) compared with cranial CT MLD of the third ventricle
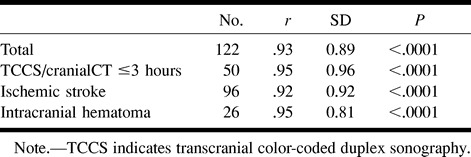
fig 2.
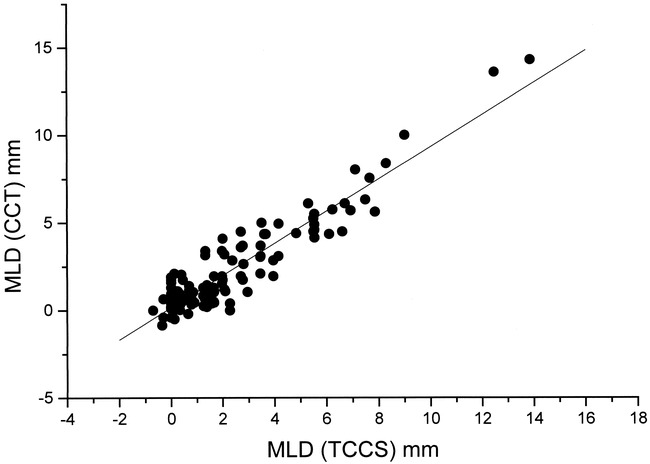
Linear regression analysis of TCCS MLD (x-axis) measurements related to the cranial CT (CCT) MLD (y-axis) measurements (r = .93, SD = 0.89; P < .0001; n = 122)
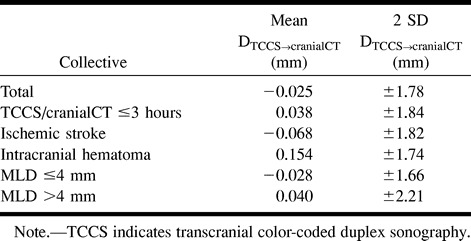
Bland-Altman diagrams of the whole collective (Fig 3) and of the subgroups did not show any systematic bias. No statistical difference in the DTCCS→cranial CT values among the different groups was evident. The 2 SD confidence intervals are summarized in Table 3.
fig 3.
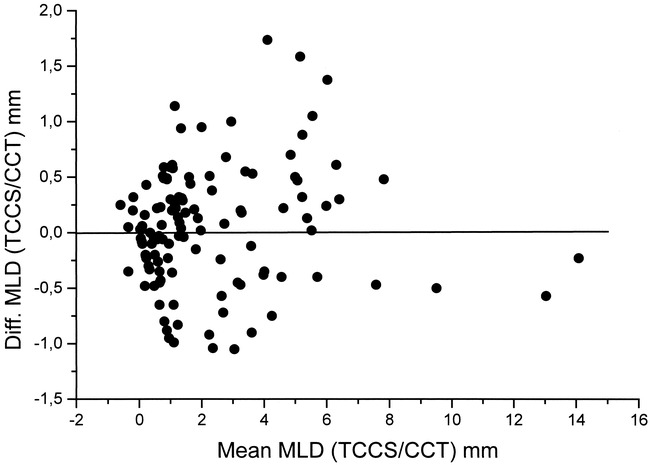
Bland-Altman diagram shows the mean of the TCCS/cranial CT (CCT) MLD measurement pairs (x-axis) related to the difference between the TCCS MLD (y-axis) and repective CCT
The mean MLD by cranial CT was 2.15 ± 2.6 mm, whereas the mean MLD by TCCS was 2.18 ± 2.5 mm. No statistically significant difference was observed. This was also the case when comparing MLDs of the 4 mm or less subgroup (cranial CT MLD: mean, 0.99 ± 1.0 mm; TCCS MLD: mean, 1.03 ± 0.9 mm; n = 93) and the greater than 4 mm subgroup (cranial CT MLD: mean, 6.04 ± 2.7 mm; TCCS MLD: mean, 5.96 ± 2.7 mm; n = 28).
Discussion
One-dimensional echoencephalography was used in the 1940s and 1950s to assess MLD of the third ventricle (17). Since the method lacked any imaging functions, it soon became redundant after the introduction of CT and MR imaging. In the 1980s, further development of ultrasound technology led to the clinical application of TCCS, which allowed the correct spatial imaging of intracranial arteries (18) and veins (19), as well as parenchymal structures (11), including the ventricular system (12, 13). TCCS is now a routine method in the assessment of stroke and is especially useful for examining critically ill patients who are not fit for transportation.
Although the degree of dislocation of midline structures correlates with the deterioration of consciousness (10), clinical criteria alone provide only limited help for deciding on a suitable time for decompressive craniotomy, since signs of brain stem herniation appear late in the course of the development of space-occupying brain edema. Furthermore, these patients are often artificially ventilated, and their neurologic state cannot be adequately assessed.
Studies using cranial CT parameters (midline shift of the pineal gland or the septum pellucidum) that were not correlated with the time of stroke onset were not able to identify a predictive value concerning survival (8). However, Pullicino and coworkers (5), who correlated serial cranial CT scans in 118 stroke victims with the time of onset of symptoms, found that an MLD of 4 mm or greater within 48 hours predicted a low 14-day survival probability, with a specificity of 89% and a sensitivity of 46%. In a study by our own group (11), an MLD of the third ventricle of greater than 4 mm within 32 hours of stroke onset predicted death due to brain herniation in all but one of 16 patients with acute occlusion of the MCA in whom MLD was measured on serial sonograms. That single patient in the group of patients with rapidly progressive space-occupying brain edema survived after decompressive craniotomy.
The aim of the present study was to validate and assess the practicability of sonographic MLD measurement of the third ventricle in patients admitted to the intensive care unit with stroke. The methodology was originally described by Seidel and coworkers in 1996 (14). In that study, a reproducibility of sonographic MLD measurements corresponding to 0.3 ± 0.2 mm was reached in 10 healthy volunteers, which is close to the spatial resolution of modern TCCS systems. Twenty-seven TCCS/cranial CT data pairs were correlated in only 18 patients with ischemic stroke, constituting a correlation of r = .87.
In this study, 122 TCCS/cranial CT data pairs were evaluated. Correlation coefficients of greater than 0.9 for sonographic and cranial CT MLD of the third ventricle were found for the whole patient collective and the different subgroups. Based on these results, sonographic MLD measurement provides an additional means to follow-up stroke patients that is reliable and noninvasive. Our findings show that the method is suitable for routine clinical use.
No significant differences in the accuracy of the method were found in comparing ischemic stroke and intracerebral hematoma, although about half our patients had an additional ventricular hemorrhage that might have complicated the identification of the typical double reflex of the third ventricle (this is because fresh blood gives a hyperechogenic sonographic signal).
The 2 SD CI for the subgroup with an MLD of 4 mm or less (−1.69 to +1.63 mm) was smaller than that for the group with an MLD of more than 4 mm (−2.25 to +2.17 mm), although a statistically significant difference could not be detected. Considering potential routine clinical applications of the method, this difference is not of major importance, since the 2 SD CI widens at an MLD of more than 6 mm. A systematic bias of the sonographic MLD measurements could not be observed in the Bland-Altman diagrams.
Conclusion
Our results show that transcranial color-coded duplex sonography is a noninvasive, easily reproducible, and reliable method for the follow-up of midline distortion due to space-occupying edema in stroke patients.
TABLE 1B:
Distribution of patients according to appearance of the stroke on CT scans
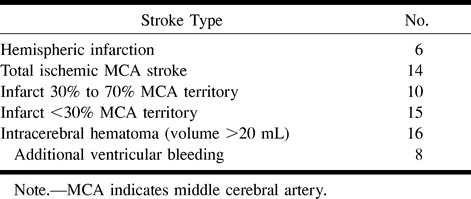
TABLE 3:
Mean and 2 SD confidence intervals of the differences between TCCS and cranial CT midline dislocation (MLD) and the means of the TCCS and cranial CT MLD
Footnotes
Presented at the meeting of the Arbeitsgemeinschaft Neurologische Intensivmedizin (Neurological Intensive Care Medicine Study Group), Karlsruhe, Germany, January 1999; and, in part, at the 8th European Stroke Conference, Venice, Italy, April 1999.
Address reprint requests to Erwin Stolz, MD, Department of Neurology, Justus-Liebig-University, Am Steg 14, D-35385 Germany.
References
- 1.Kaste M, Waltimo O. Prognosis of patients with middle cerebral artery occlusion. . Stroke 1976;7:482-485 [DOI] [PubMed] [Google Scholar]
- 2.Moulin DF, Lo R, Chiang J, Barnett HJM. Prognosis in middle cerebral artery occlusion. . Stroke 1985;16:282-284 [DOI] [PubMed] [Google Scholar]
- 3.Frank JI. Large hemispheric infarction, deterioration, and intracranial pressure. . Neurology 1995;45:1286-1290 [DOI] [PubMed] [Google Scholar]
- 4.Heinsius T, Bogousslavsky J, Van Melle G. Large infarcts in the middle cerebral artery territory: etiology and outcome patterns. . Neurology 1998;50:341-350 [DOI] [PubMed] [Google Scholar]
- 5.Pullicino PM, Alexandrov AV, Shelton JA, Alexandrova NA, Smurawska LT, Nowwis JW. Mass effect and death from severe acute stroke. . Neurology 1997;49:1090-1095 [DOI] [PubMed] [Google Scholar]
- 6.Hacke W, Schwab S, Horn M, Spranger M, De Georgia M, von Kummer R. Malignant middle cerebral artery territory infarction: clinical course and prognostic signs. . Arch Neurol 1996;53:309-315 [DOI] [PubMed] [Google Scholar]
- 7.Konzdiola D, Fazl M. Functional recovery after decompressive craniectomy for cerebral infarction. . Neurosurgery 1988;23:143-147 [DOI] [PubMed] [Google Scholar]
- 8.Rieke K, Schwab S, Krieger D,, et al. Decompressive surgery in space-occupying hemispheric infarction: results of an open, prospective trial. . Crit Care Med 1995;23:1576-1587 [DOI] [PubMed] [Google Scholar]
- 9.Schwab S, Steiner T, Aschoff A,, et al. Early hemicraniectomy in patients with complete middle cerebral artery infarction. . Stroke 1998;29:1888-1893 [DOI] [PubMed] [Google Scholar]
- 10.Ropper AH. Lateral displacement of the brain and level of consciousness in patients with an acute hemispherical mass. . N Engl J Med 1986;314:953-958 [DOI] [PubMed] [Google Scholar]
- 11.Gerriets T, Stolz E, Modrau B, Fiss I, Seidel G, Kaps M. Sonographic evaluation of midline shift in hemispheric infarction predicts outcome. . Neurology 1999;52:45-49 [DOI] [PubMed] [Google Scholar]
- 12.Seidel G, Kaps M, Gerriets T. Potential and limitation of transcranial color-coded sonography in stroke patients. . Stroke 1995;26:2061-2066 [DOI] [PubMed] [Google Scholar]
- 13.Seidel G, Kaps M, Gerriets T, Hutzelmann A. Evaluation of the ventricular system in adults by transcranial duplex sonography. . J Neuroimaging 1995;5:105-108 [DOI] [PubMed] [Google Scholar]
- 14.Seidel G, Gerriets T, Kaps M, Missler U. Dislocation of the third ventricle due to space-occupying stroke evaluated by transcranial duplex sonography. . J Neuroimaging 1996;6:227-230 [DOI] [PubMed] [Google Scholar]
- 15.Bland JM, Altman DG. Statistical methods ensuring agreement between two methods of clinical measurement. . Lancet 1986;1:307-310 [PubMed] [Google Scholar]
- 16.Thöni H. Testing the difference between two coefficients of correlation. . Biometric J 1977;19:355-359 [Google Scholar]
- 17.De Vlieger M, Ridder J II. Use of echoencephalography. . Neurology 1959;9:216-223 [DOI] [PubMed] [Google Scholar]
- 18.Kaps M. Extra- und intrakranielle Farbduplexsonographie. . Berlin: Springer; 1994;
- 19.Stolz E, Kaps M, Dorndorf W. Assessment of intracranial venous hemodynamics in normals and patients with cerebral venous thrombosis. . Stroke 1999;30:70-75 [DOI] [PubMed] [Google Scholar]


