

Abstract
BACKGROUND AND PURPOSE: Early diagnosis of perfusion deficits in patients with acute stroke could guide treatment decisions and improve prognosis. We investigated the sensitivity of perfusion CT studies using parametric time-to-peak maps to assess ischemic brain tissue with respect to early infarct signs on native CT scans.
METHODS: First-pass, single-section perfusion CT was performed in 20 patients who presented with symptoms of acute stroke within 6 hours of onset. Initial CT perfusion studies were compared with follow-up studies within 30 hours in 10 patients. A manual, region of interest (ROI)-based, local evaluation procedure was performed to determine delayed time-to-peak values and diminished peak amplitudes. In addition, time-to-peak parameter maps were processed off-line from the dynamic CT data sets to identify areas of perfusion deficits, which were expressed as hemispheric lesion areas (HLAs). Evolution of the ischemic regions was assessed by comparing the HLA on the initial and follow-up studies as well as on the native CT scan of the follow-up studies.
RESULTS: Diagnostic time-to-peak maps were generated in 19 of 20 initial and in nine of 10 follow-up perfusion CT studies. The initial time-to-peak map showed perfusion deficits in 14 of 20 patients. Hemispheric territorial infarcts were diagnosed with a sensitivity of 93%. Perfusion deficits in two patients with brain stem infarctions and three patients with lacunar strokes were missed. Follow-up time-to-peak maps showed the extent of reperfusion after various therapeutic strategies.
CONCLUSION: Perfusion CT is potentially useful for detecting cerebral perfusion deficits in acute ischemic stroke before morphologic changes are observable on native CT scans. Compared with a locally restricted ROI-based evaluation, time-to-peak maps provide sensitive, global indications of malperfused brain areas, facilitate lesion localization, and allow assessment of the evolution of the infarction during follow-up.
Intravenous thrombolysis is an effective treatment within the first 3 hours after stroke onset (1, 2). A subgroup analysis of the European Cooperative Acute Stroke Study (ECASS) I (3) has suggested that the therapeutic window may be prolonged by up to 6 hours. Thrombolysis, however, carries a risk of hemorrhagic complications, and treatment should be restricted to patients with acute perfusion deficits. Information about vessel occlusion is not only difficult to obtain within the first few hours after onset but does not give information on the functional significance of the vessel obstruction. Detection of malperfused tissue and assessment of collateral blood flow are important and may contribute to patient management. Consequently, diagnostic techniques that reveal the extent of the initial perfusion deficit would be helpful to guide therapeutic decisions. One of the limitations of conventional unenhanced CT is that early ischemic signs are difficult to detect in a clinical setting, as was shown, for instance, by the ECASS I investigators (3); but perhaps of equal importance is that it provides no direct information about perfusion.
Recent studies have aimed to define the value of new diagnostic tools for the definition of stroke mechanisms as well as for the assessment of malperfused brain tissue. MR imaging techniques, such as diffusion and perfusion MR imaging, make it possible to define tissue at risk (4). Nonetheless, these techniques usually require powerful gradient systems and echo-planar imaging capabilities, which are still not commonly available on current clinical scanners. Positron emission tomography yields insight into stroke physiology and has demonstrated that a decrease of cerebral blood flow (CBF) with a concomitant increase in oxygen extraction fraction represents a marker for penumbral tissue (5). Single-photon emission tomography has proved useful for distinguishing between stroke and transient ischemic attack (6). None of the nuclear medicine techniques, however, is widely available; and there is certainly a need for an easily applicable technique that reveals early perfusion deficits in patients with acute ischemic stroke.
In the industrialized countries, CT is performed in patients with acute stroke to exclude intracerebral hemorrhage and to determine early infarct signs (7). Dynamic, first-pass perfusion CT is a single-section technique that measures tissue perfusion semiquantitatively on the basis of the indicator-dilution method (8, 9). It uses the bolus tracking principle, which allows one to determine several parameters of tissue perfusion (10–12). Contrast agent is rapidly infused during continuous acquisition of CT scans with a temporal resolution on the order of 1 second. Perfusion CT can be easily added to routine CT examinations with little increase in scan time. Other methods for diagnosis and treatment of acute stroke include, for example, CT angiography (13–16) and xenon-enhanced CT (17–19), which provide additional information with respect to vessel occlusion and CBF. These methods, too, can be easily added to a conventional CT examination. Although a larger volume can be covered with CT angiography, parametric assessment of the parenchymal perfusion is hampered owing to the lack of bolus tracking, and no conclusion can be drawn as to the functionality of a calculated occlusion. Furthermore, to extract information on vessel occlusion, application of sophisticated and extensive postprocessing techniques, such as volume rendering of the 3D data set, is necessary. Xenon-CT is a low-cost, rapid method for quantitatively evaluating local CBF. It requires additional equipment, which, however, can be incorporated into most CT scanners at relatively little expense. A disadvantage of the method is the side effect of the xenon gas, which may alter sensation in some patients and may cause nausea and motion artifacts. Dynamic perfusion CT, on the other hand, is a simple procedure that does not require special equipment. Acquisition of data on a faster time scale, although limited to a single section, facilitates tracking of the bolus in the brain.
We used perfusion CT in the assessment of patients with acute ischemic stroke who presented within 6 hours of stroke onset to evaluate the sensitivity of this single-section method for the detection of perfusion deficits on parametric time-to-peak maps. Early follow-up measurements were performed in a subgroup of patients to monitor the effects of recanalizing therapeutic strategies or to assess spontaneous vessel recanalization.
Methods
Patients
Twenty patients (12 women and eight men; 52 to 85 years old; mean age, 67 years) with acute stroke symptoms were enrolled in this prospective study. Perfusion CT was performed within 6 hours after stroke onset (mean, 166 minutes; range, 36 to 360 minutes). Informed consent was obtained prior to perfusion CT. Ten of the 20 patients who had symptom onset within 3 hours of presentation received an identical follow-up examination 18 to 30 hours after the initial study, with the same section location and position (native and perfusion CT). This follow-up perfusion CT study was based on the observation that the blood-brain barrier is not yet seriously disturbed within 24 hours of stroke onset (20). A successful series of two scans (one initial, one follow-up) was obtained in eight patients; in two patients, one of the scans (one initial, one follow-up) had to be discarded owing to motion artifacts.
Imaging Protocol
Eighteen native axial scans (120 kV, 500 mAs) were acquired in the orbitomeatal orientation (head-first, supine orientation) using a slip-ring CT scanner (Somatom Plus S, Siemens Medical Systems, Erlangen, Germany) with a 5-mm section thickness and a table feed of 8 mm. Single-section perfusion CT scans (thickness, 10 mm; image matrix, 512 × 512) were obtained immediately after the native CT study in a standardized section position covering the basal ganglia, the thalamus, and parts of the anterior, middle, and posterior arterial territories (ACA, MCA, and PCA, respectively). Nonionic contrast agent (60 mL Ultravist 300, Schering, Berlin, Germany) was administered with a constant flow rate of10 mL/s via the antecubital vein by using a power injector. As soon as the injection started, raw data were acquired by rotating the X-ray tube continuously while keeping the table stationary. Each 360° rotation (120 kV, 165 mA) took 1 second, and the total acquisition time was 40 seconds. From this data set, a series of images with a time interval of 1 second was reconstructed, corresponding to 40 images.
Data Processing
A manual evaluation of the dynamic perfusion scan, based on 14 circular ROIs placed in standardized brain regions, was performed using the commercial CT software to obtain immediate information on perfusion delays (Fig 1). The first noncontrast image was used as a baseline reference. Baseline-corrected enhancement-versus-time curves of the ROIs were plotted and visually inspected for differences in the peak amplitude and time-to-peak values between the diseased and healthy hemisphere. A difference in the time-to-peak values of 4 or more seconds in combination with a concomitant reduced peak value relative to the contralateral hemisphere in at least one of the seven ROIs was considered an acute perfusion deficit (21, 22). The results of this evaluation were immediately made available to the stroke neurologist for clinical decision making.
fig 1.
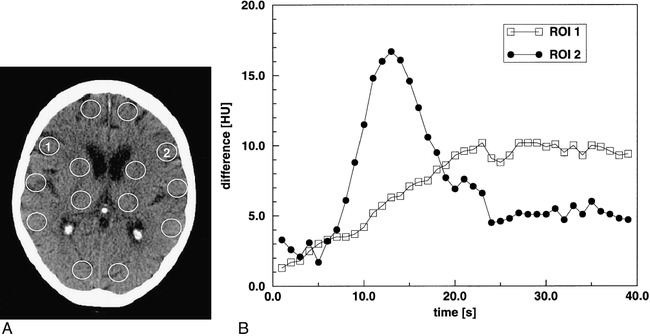
Patient 6.
A, Initial native CT scan shows standardized circular ROIs, which were manually placed in both hemispheres in the vascular territories of the ACA, MCA, PCA, the basal ganglia region, and the thalamus.
B, Enhancement-versus-time curves of ROIs 1 and 2 located symmetrically in the anterior vascular territory of the MCA in the ischemic and healthy areas, respectively. Note the strong enhancement peak indicating the passage of the compact contrast bolus in the normal area (ROI 2). Conversely, the time course of the contralateral ROI (ROI 1) shows a markedly delayed and slow enhancement, indicating hypoperfusion.
The perfusion raw data set was also processed off-line on an external workstation using a commercially available software package (MRVision 1.5, MRVision; Menlo Park, CA). Images were manually segmented to separate brain parenchyma from the skull, ventricles, and background. For noise reduction, the CT scans were smoothed by a 2D spatial filtering operation in which each pixel value was replaced by the mean of the 3 × 3 neighboring pixels. The enhancement-versus-time curves were fitted pixel-by-pixel to a polynomial function of the fifth order. The time-to-peak value, which represents the time from the start of the contrast agent injection to the maximum enhancement value, was determined and displayed as a time-to-peak parameter map by means of a pseudocolor table. Maps were created by using the same scale, ranging from 5 to 40 seconds, to allow a better intra- and interindividual comparison of patients.
Time-to-peak is a simple and robust parameter that is related to blood flow (11). It represents a parameter of tissue perfusion that may provide evidence of affected brain areas. More sophisticated evaluation procedures based on the indicator-dilution method allow the extraction of important physiologic parameters, such as regional cerebral blood volume (rCBV), regional cerebral blood flow (rCBF), or regional mean transit time (rMTT) (11). There are, however, several intricate mathematical steps involved in the quantitative calculation of these parameters, such as integration of concentration-time curves or deconvolution with the arterial input function, which requires an intra-arterial line, that may ultimately lead to results that are susceptible to noise. Usually, a gamma variate analysis is performed using nonlinear regression to calculate rCBV and to eliminate contamination due to recirculation of the contrast agent. Conversely, time-to-peak does not require such a numerical analysis, while not providing absolute blood flow values.
The time-to-peak parameter maps were inspected visually, and areas revealing obvious perfusion deficits were outlined manually using the graphical tools in the software package. The size of these regions on both initial and follow-up time-to-peak maps and the size of the hypodensities observed on the native follow-up CT scans were each reported as a percentage of the total hemispheric area and were expressed as hemispheric lesion areas (HLAs).
To assess the therapeutic response, HLA values on the initial time-to-peak maps were compared with HLA values on the follow-up perfusion CT study as well as with the hypodense area observed on the native, follow-up CT examination. Owing to the small sample size involved, no detailed statistical analysis was performed. Nevertheless, the therapeutic intervention was considered successful if the HLA on the follow-up time-to-peak map and on the native follow-up CT scan were smaller than that on the initial time-to-peak map. In addition, the mean time-to-peak values of the ischemic and contralateral unaffected brain areas were determined using manually drawn ROIs on the maps and averaging the time curves of all pixels within these ROIs. The ROI outlining the lesion on the time-to-peak map was copied and mirrored to evaluate the corresponding size-matched region of the contralateral hemisphere.
Interpretation of the initial native CT scans was done independently and retrospectively by two investigators. Sensitivity and inter-rater reliability for the detection of early infarct signs were determined.
Results
Table 1 summarizes the clinical data of the patients and provides a description of the observed patterns in the time-to-peak maps. In all, 30 dynamic CT studies (20 initial, 10 follow-up) were performed. Two dynamic CT studies (one initial and one follow-up) were excluded from further data evaluation because of severe motion artifacts. The clinical diagnosis of acute ischemic stroke was confirmed in all patients on the basis of routine follow-up CT or MR imaging findings. One patient suffered from a mild allergic reaction (erythema) caused by the contrast agent and two patients with urticaria required subsequent treatment.
TABLE 1:
Clinical data of patients

ROI-Based Data Evaluation
Figure 1A shows the locations of the circular ROIs that were processed as enhancement-versus-time curves for the instant diagnosis of perfusion deficits by using the built-in scanner software. The enhancement-versus-time curves (Fig 1B) of ROIs 1 and 2, located symmetrically in the anterior part of the MCA territory, reveal perfusion differences between the ischemic and the contralateral normal brain area.
The criteria used to define a perfusion deficit were based on a difference in the time-to-peak value of 4 or more seconds and a simultaneously reduced peak value as compared with the contralateral hemisphere in at least one of the seven ROIs. By applying these criteria, 12 of 20 patients were determined to have malperfusion on the initial study; a sensitivity of 60%. One data set in a patient with a territorial infarct could not be processed owing to motion artifacts. Two incomplete territorial infarcts were missed. Three cases of lacunar infarctions and two cases of basilar thrombosis were also not detected using the ROI evaluation. After exclusion of patients with lacunar syndromes, the sensitivity for the detection of perfusion deficits was 80%.
Data Evaluation Based on Time-to-Peak Maps
The time-to-peak maps depicted perfusion deficits in all patients with territorial infarction in the MCA, ACA, or PCA (n = 14, see Table 1). Studies in one patient with a territorial infarction could not be evaluated because of motion artifacts. In two of these 15 patients (cases 13 and 14), small additional perfusion abnormalities were detected on time-to-peak maps that were missed in the ROI evaluation (see above), corresponding to a sensitivity of 93% (14/15). In two other patients (cases 5 and 12), both the ROI evaluation and the mapping missed a basilar artery thrombosis and a top of the basilar artery syndrome; these findings were made only during follow-up on the native CT scans. The same held true for patients 3, 15, and 20, who had lacunar infarcts with a diameter of less than 1 cm. Representative CT scans and time-to-peak maps are displayed in Figure 2.
fig 2.
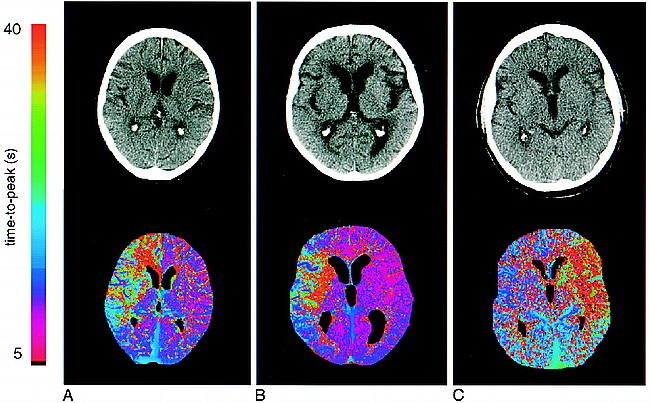
Initial native CT scans and corresponding time-to-peak parameter maps. The maps are color-coded with values ranging from 5 to 40 seconds.
A, Patient 6: 62-year-old woman who presented 40 minutes after onset of left hemiparesis. The CT scan is normal. Note the clear demarcation of the diseased area in the right hemisphere, corresponding to the right ACA and MCA territories, including the basal ganglia on the parameter map.
B, Patient 17: 77-year-old woman who presented 40 minutes after onset of somnolence and left hemiparesis. The native CT scan is normal. The parameter map shows an area of delayed perfusion in the territory of the right MCA.
C, Patient 1: 60-year-old man who had a normal CT scan 2.8 hours after onset. The time-to-peak map depicts a large perfusion deficit in the left MCA territory, including the basal ganglia.
Figure 3 shows the findings in a patient who was followed up with perfusion CT within 30 hours of stroke onset. The initial native CT scan (Fig 3A) reveals subtle, early CT signs of cerebral ischemia in the left hemisphere. The time-to-peak map clearly delineates the extent of the affected brain area and corresponds to the hypodensity seen on the follow-up CT scan (Fig 3B). The follow-up time-to-peak map shows tissue reperfusion.
fig 3.

Patient 10: initial and follow-up examinations.
A, 2 hours 50 minutes after onset.
B, 30 hours after onset, during therapy with heparin. The patient suffered from a large infarct in the left hemisphere with global aphasia and right hemiparesis. The first native CT scan (A) reveals only discrete cortical hypodensity and effacement of cortical sulci in the ischemic hemisphere. In contrast, the time-to-peak map clearly shows the extent of the affected brain area, which corresponds strongly to the hypodensity seen on the CT scan in the follow-up study (B). The time-to-peak map shows tissue reperfusion 30 hours later. A large MCA infarction developed despite recanalization.
HLA values were determined from the initial and follow-up time-to-peak maps as well as from the native CT scan of the follow-up study. Table 2 summarizes the results obtained in this subgroup of patients. In patients who did not receive intravenous thrombolysis with rt-PA (n = 3), the HLA value on the native follow-up CT scans corresponded roughly to the HLA value on the initial time-to-peak maps. The time-to-peak maps of the follow-up examination revealed partial reperfusion in two of these three patients, as indicated by the lower HLA values (cases 4 and 10).
TABLE 2:
Clinical data and hemispheric lesion areas (HLA) during initial and follow-up scans
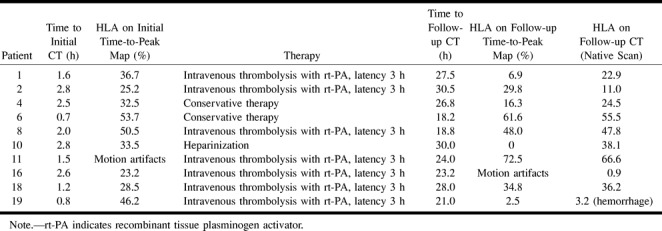
In the seven patients treated with rt-PA, two (cases 8 and 18) had similar HLA values both on the time-to-peak maps and on the native follow-up CT scan. This suggests that treatment was not followed by recanalization. Four patients (cases 1, 2, 16, and 19) showed marked reduction in the HLA value on the native follow-up CT scan as compared with the initial time-to-peak map, which was also observed on the follow-up time-to-peak maps. The scans in patient 11 could not be evaluated because of motion artifacts (see Table 2).
The mean time-to-peak values were determined as described in the Methods section and averaged over 14 patients with territorial infarcts seen on the initial time-to-peak maps. Note that the areas of the corresponding ROIs were different among patients. Mean values of 16.0 ± 5.6 seconds (mean ± SD) and 22.8 ± 5.8 seconds were obtained for the corresponding healthy and ischemic ROIs, respectively. The averaged values over eight patients with a perfusion deficit on the follow-up studies were 14.1 ± 7.0 seconds and 26.7 ± 9.8 seconds, respectively. Two patients were not included owing to complete reperfusion (case 10) or motion artifacts (case 16). Although the averages for the normal and affected hemispheres have overlapping values, the relatively close correspondence of both the initial and follow-up mean values of the healthy hemisphere (16.0 ± 5.6 seconds versus 14.1 ± 7.0 seconds) demonstrate the robustness of the perfusion CT method. The rather large mean difference in time-to-peak of 6.8 ± 2.4 seconds between the initial affected and nonischemic ROIs reflects the clear differentiation between normal perfused and malperfused regions despite the limited sample size of 14 patients. On the other hand, this parameter, although quite sensitive to malperfusion, does not allow a differentiation of the severity of the perfusion deficit.
To investigate the potential of the time-to-peak evaluation further, the initial native CT scans were interpreted with respect to early infarct signs by two independent raters. In the 15 patients with territorial infarction, the first observer detected early signs in four cases and the second observer in six cases. This corresponds to an inter-rater reliability of 67%.
Discussion
CT is an important tool for the differential diagnosis of acute ischemic infarction from intracerebral hemorrhage. Within the first hours after stroke onset, however, the sensitivity to infarction of native CT is low and ischemic signs are not readily recognized outside of specialized centers (7, 12, 23–28). The interobserver reliability in our series was 67% and compares well with previous studies that assessed the reliability of detection of early CT hypoattenuation (29). These evaluations reveal the inherent difficulty in correctly detecting and diagnosing early ischemic CT signs. Moreover, CT does not yield information about the extent and severity of the perfusion deficit. The therapeutic window after stroke onset is crucial, since intravenous thrombolysis has only proved to be effective and safe within the narrow interval of 3 hours (1). The findings in another study, the ECASS I (3), have suggested that a subset of patients can benefit from treatment up to 6 hours after symptom onset. Nevertheless, it seems obvious that only patients with acute vessel obstruction and perfusion deficits will benefit from recanalization therapy. Therefore, there is a strong demand for a diagnostic imaging technique that depicts perfusion deficits before infarct demarcation is visible on conventional CT studies.
We have shown that dynamic, first-pass perfusion CT detects functional abnormalities before morphologic changes are visible. We found a sensitivity of 93% for patients suffering from supratentorial territorial infarcts. Parameter maps based on a robust indicator of malperfusion, such as time-to-peak, partially depict the location and extent of the ischemic brain region. Time-to-peak maps yield images of a whole section and facilitate visual comparison of malperfused regions between initial and follow-up studies. In contrast, an ROI-based evaluation, although providing immediate information, is limited to a small number of regions. It is not only observer-dependent, and consequently prone to misinterpretation, but also lacks good reproducibility among follow-up scans. Small areas of affected brain tissue may be missed by using only the ROI approach. Although the parameter maps were calculated retrospectively and were not used as a prospective diagnostic tool, it is, in principle, no obstacle to integrate the calculation of the maps into the initial clinical evaluation.
One major drawback of the method is the limitation to single-section measurements. Ideally, a multisection acquisition that covers a larger volume of the brain would be desirable. Although a single-section technique is certainly capable of localizing the infarction, it is not able to show the extent of the infarction in all three spatial dimensions. If the infarcted area is small, it is possible to miss a territorial infarction involving the ACA, MCA, or PCA. Nevertheless, compared with a local ROI-based evaluation in which the setting of a finite number of ROIs is highly user-dependent, the calculation of a global parameter map should be valuable for detecting even small infarcts.
Technical limitations make it difficult to cover a large brain volume with multisection CT. Perfusion CT studies require repetitive scanning of the same brain section, which leads to higher radiation exposure of the selected section relative to the native scan. To partly compensate for this higher radiation exposure, we reduced the tube current from 250 mA to 165 mA in the dynamic scan. Another way to reduce the dose would be to acquire fewer data during the dynamic scan by sacrificing temporal resolution or by shortening the overall measurement time. It is anticipated that the time-to-peak parameter should still yield reasonable maps by increasing, for instance, the time for a full revolution of the tube from 1 to 2 seconds.
One further problem is related to potential hypersensitivity to contrast medium, which may not be known at the time of the examination. In the current study, three patients experienced mild side effects caused by the contrast agent. On the other hand, these potential shortcomings of the method have to be balanced with the benefits associated with the possibility of assessing tissue perfusion and of initiating appropriate pharmacotherapy.
Early follow-up CT scans are necessary to rule out potential hemorrhagic complications after thrombolysis and to determine the extent of the infarction. Discrepancies between initially large perfusion deficits seen on the time-to-peak maps and a comparably smaller HLA on the follow-up CT scan may indicate that the HLA of the initial time-to-peak map involves “tissue at risk.” It has been shown that successful recanalization is a statistically significant prognostic indicator (30). In our study, follow-up investigations with time-to-peak maps proved to be a useful tool for determining spontaneous or treatment-induced recanalization and the effect of recanalization on tissue recovery. Whereas the native follow-up CT scans delineate the infarcted tissue and indicate its space-occupying effects, the perfusion maps give an overview of hypoperfused areas located within the section, although they do not yield information about the viability of the tissue.
In contrast to physiologic parameters, such as rCBV, rCBF, or rMTT, the time-to-peak parameter is easy to extract and robust. It indicates the local arrival of the contrast bolus and is thus connected to local blood flow (11). The former parameters depend on higher-order curve fitting, numerical integration of concentration-time curves, and/or deconvolution with the arterial input function, respectively. In a recent perfusion-weighted dynamic susceptibility contrast MR imaging study in patients with a unilateral occlusion of the internal carotid artery, it was reported that time-to-peak maps provided the best picture of the affected region. On the other hand, interpretation of rCBV and rCBF maps was difficult owing to problems of curve fitting in the infarcted areas (31).
One alternative methodology is stable xenon-CT, which provides rapidly accessible information on CBF and has proved to be useful for the management of acute stroke (32, 33). Its main advantage is the ability to image several brain levels before and during inhalation of stable xenon for several minutes and to calculate quantitatively CBF by using the Kety-Schmidt equation. Because a regional blood-tissue partition coefficient is obtained, the method allows one to quantitate CBF information, which, in turn, makes it possible to define the volume of irreversibly ischemic tissue based on thresholding the flow data. Thus, it is possible to define the lesion area that is lost before the patient begins therapy, which may have important implications for the type and window of therapeutic intervention. It has been shown that stable xenon-CT improves the sensitivity and specificity for the detection of acute stroke (17, 32, 33). Disadvantages of the method are related to possible various side effects, which may lead to an unpleasant experience for the patient, and the additional costs of add-on equipment to standard CT scanners.
As demonstrated, time-to-peak mapping is valuable for the assessment of acute stroke during initial and early follow-up examinations. In comparison with early infarct signs, the method proved to be more sensitive in the detection of abnormalities. The obtained sensitivity of 93% is in accordance with the results reported by other groups. For example, König et al (12), in a similar study of 32 patients with acute stroke, reported a sensitivity of 89% (25 of 28 patients with proved infarct). An important component of the method, however, is the administration of a compact bolus to achieve clear delineation of the infarcted areas on the time-to-peak maps. Although the quality of the bolus depends on many physiologic parameters when applying an intravenous injection, a flow rate of 10 mL/s appears sufficient, based on our experience, to obtain rather narrowly distributed time-to-peak values in the healthy hemisphere. For example, we obtained averaged values of 16.0 ± 5.6 seconds and 14.1 ± 7.0 seconds on initial and follow-up studies, respectively (see Results). The existence of such a relatively stable value makes it easier to detect and monitor perfusion abnormalities in the ischemic hemisphere, which are reflected in delayed time-to-peak values. The reason for the robustness of the time-to-peak parameter may be that only enhancement data from a short period of time are used.
Single-section time-to-peak mapping is certainly not able to characterize the mechanisms of acute ischemic lesions completely. MR techniques, in particular diffusion-weighted MR imaging combined with perfusion imaging, are generally superior to CT in distinguishing areas of reversible ischemia from infarct cores (4, 20, 34–40). On the other hand, the main advantage of perfusion CT, currently, is the greater availability of scanners and the short scan times.
Conclusion
Time-to-peak mapping obtained from perfusion CT data facilitates the detection of acute cerebral ischemia before morphologic changes are visible on CT scans. The method is easy to implement and represents a useful adjunct to conventional CT examinations; moreover, it yields diagnostic results within a few minutes and may guide treatment decisions. Although limited to a single section, time-to-peak maps are valuable for the assessment of acute stroke during initial and early follow-up examinations. Follow-up studies provide information on the response to thrombolytic therapy.
Footnotes
Supported by a grant from the BMBF (Project 815711) to J.R. and J.R.R.
Address reprint requests to Jürgen R. Reichenbach, PhD, Institute for Diagnostic and Interventional Radiology, Section of Magnetic Resonance Tomography, Friedrich-Schiller-University Jena, Bachstrasse 18, D-07743 Jena, Germany.
References
- 1. The National Institute for Neurological Disorders and Stroke, rt-PA Stroke Study Group Tissue plasminogen activator for acute ischemic stroke. N Engl J Med 1995;333:1581-1587 [DOI] [PubMed] [Google Scholar]
- 2.Koroshetz WJ, Moskowitz MA, Emerging treatment for stroke in humans. Trends Pharmacol Sci 1996;17:227-233 [DOI] [PubMed] [Google Scholar]
- 3.Hacke W, Kaste M, Fieschi C, et al. Intravenous thrombolysis with recombinant tissue plasminogen activator for acute hemispheric stroke: the European Cooperative Acute Stroke Study (ECASS). JAMA 1995;274:1017-1025 [PubMed] [Google Scholar]
- 4.Sorensen AG, Buonanno FS, Gonzalez RG, et al. Hyperacute stroke: evaluation with combined multisection diffusion-weighted and hemodynamically weighted echo-planar imaging. Radiology 1996;199:391-401 [DOI] [PubMed] [Google Scholar]
- 5.Marchal G, Serrati C, Rioux P, et al. PET imaging of cerebral perfusion and oxygen consumption in acute ischaemic stroke: relation to outcome. Lancet 1993;341:925-927 [DOI] [PubMed] [Google Scholar]
- 6.Berrouschot J, Barthel H, Hesse S, Koster J, Knapp WH, Schneider D, Differentiation between transient ischemic attack and ischemic stroke within the first six hours after onset of symptoms by using 99mTc-ECD-SPECT. J Cereb Blood Flow Metab 1998;18:921-929 [DOI] [PubMed] [Google Scholar]
- 7.von Kummer R, Meyding-Lamade U, Forsting M, et al. Sensitivity and prognostic value of early CT in occlusion of the middle cerebral artery trunk. AJNR Am J Neuroradiol 1994;15:9-15 [PMC free article] [PubMed] [Google Scholar]
- 8.Axel L, Cerebral blood flow determination by rapid-sequence computed tomography: a theoretical analysis. Radiology 1980;137:679-686 [DOI] [PubMed] [Google Scholar]
- 9.Axel L, Tissue mean transit time from dynamic computed tomography by a simple deconvolution technique. Invest Radiol 1983;18:94-99 [DOI] [PubMed] [Google Scholar]
- 10.Zierler KL, Theoretical basis of indicator-dilution methods for measuring flow and volume. Circ Res 1962;10:393-407 [Google Scholar]
- 11.Lassen NA, Perl W, Tracer Kinetic Methods in Medical Physiology.. New York: Raven; 1979:1–186
- 12.König M, Klotz E, Luka B, Venderink DJ, Spittler JF, Heuser L, Perfusion CT of the brain: diagnostic approach for early detection of ischemic stroke. Radiology 1998;209:85-93 [DOI] [PubMed] [Google Scholar]
- 13.Wildermuth S, Knauth M, Brandt T, Winter R, Sartor K, Hacke W, Role of CT angiography in patient selection for thrombolytic therapy in acute hemispheric stroke. Stroke 1998;29:935-938 [DOI] [PubMed] [Google Scholar]
- 14.Shrier DA, Tanaka H, Numaguchi Y, et al. CT angiography in the evaluation of acute stroke. AJNR Am J Neuroradiol 1997;18:1011-1020 [PMC free article] [PubMed] [Google Scholar]
- 15.Knauth M, von Kummer R, Jansen O, Hähnel S, Dörfler A, Sartor K, Potential of CT angiography in acute ischemic stroke. AJNR Am J Neuroradiol 1997;18:1001-1010 [PMC free article] [PubMed] [Google Scholar]
- 16.Na DG, Byun HS, Li KH, et al. Acute occlusion of the middle cerebral artery: early evaluation with triphasic helical CT-preliminary results. Radiology 1998;207:113-122 [DOI] [PubMed] [Google Scholar]
- 17.Kaufmann AM, Firlik AD, Fukui MB, Wechsler LR, Jungries CA, Yonas H, Ischemic core and penumbra in human stroke. Stroke 1999;30:93-99 [DOI] [PubMed] [Google Scholar]
- 18.Levy EI, Scarrow AM, Kanal E, Rubin G, Yonas H, Kirby L, Reversible ischemia determined by xenon-enhanced CT after 90 minutes of complete basilar artery occlusion. AJNR Am J Neuroradiol 1998;19:1943-1946 [PMC free article] [PubMed] [Google Scholar]
- 19.Yonas H, Pindzola RR, Johnson DW, Xenon/computed tomography cerebral blood flow and its use in clinical management. Neurosurg Clin N Am 1996;7:605-616 [PubMed] [Google Scholar]
- 20.Röther J, Gückel F, Neff W, Schwartz A, Hennerici M, Assessment of regional cerebral blood volume in acute human stroke by use of single-slice dynamic susceptibility contrast-enhanced magnetic resonance imaging. Stroke 1996;27:1088-1093 [DOI] [PubMed] [Google Scholar]
- 21.Shih TTF, Huang KM, Acute stroke: detection of changes in cerebral perfusion with dynamic CT scanning. Radiology 1988;169:469-474 [DOI] [PubMed] [Google Scholar]
- 22.Rozeik Chr, Kotterer O, Wieschen A, Deininger HK, Dynamic cranial CT for ischaemic cerebral lesions. Fortschr Röntgenstr 1993;158:355-361 [DOI] [PubMed] [Google Scholar]
- 23.Bryan RN, Levy LM, Whitlow WD, Killian JM, Preziosi TJ, Rosario JA, Diagnosis of acute cerebral infarction: comparison of CT and MR imaging. AJNR Am J Neuroradiol 1991;12:611-620 [PMC free article] [PubMed] [Google Scholar]
- 24.Yuh WT, Crain MR, Loes DJ, Greene GM, Ryals TJ, Sato Y, MR imaging of cerebral ischemia: findings in the first 24 hours. AJNR Am J Neuroradiol 1991;12:621-629 [PMC free article] [PubMed] [Google Scholar]
- 25.Hamberg LM, Hunter GJ, Halpern EF, Hoop B, Gazelle GS, Wolf GL, Quantitative, high resolution measurement of cerebral vascular physiology with slip-ring CT. AJNR Am J Neuroradiol 1996;17:639-650 [PMC free article] [PubMed] [Google Scholar]
- 26.Muizelaar JP, Fatouros PP, Schröder ML, A new method for quantitative regional cerebral blood volume measurements using computed tomography. Stroke 1997;28:1998-2005 [DOI] [PubMed] [Google Scholar]
- 27.Manelfe C, Cognard C, Laval C, Loubes-Lacroix F, Sévely A, Berry I, Intracranial vascular involvement of brain pathologies and venous occlusions. Eur Radiol 1998;8:1106-1115 [DOI] [PubMed] [Google Scholar]
- 28.Hunter GJ, Hamberg LM, Ponzo JA, et al. Assessment of cerebral perfusion and arterial anatomy in hyperacute stroke with three-dimensional functional CT: early clinical results. AJNR Am J Neuroradiol 1998;19:29-37 [PMC free article] [PubMed] [Google Scholar]
- 29.Marks MP, Holmgren EB, Fox AJ, Patel S, von Kummer R, Froehlich J, Evaluation of early computed tomographic findings in acute ischemic stroke. Stroke 1999;30:389-392 [DOI] [PubMed] [Google Scholar]
- 30.Kucinski T, Koch C, Grzyska U, Freitag HJ, Krömer H, Zeumer H, The predictive value of early CT and angiography for fatal hemispheric swelling in acute stroke. AJNR Am J Neuroradiol 1998;19:839-846 [PMC free article] [PubMed] [Google Scholar]
- 31.Kluytmans M, van der Grond J, Folkers PJM, Mali WPThM, Viergever MA, Differentiation of gray matter and white matter perfusion in patients with unilateral internal carotid artery occlusion. J Magn Reson Imaging 1998;8:767-774 [DOI] [PubMed] [Google Scholar]
- 32.Firlik AD, Kaufmann AM, Wechsler LR, Firlik KS, Fukui MB, Yonas H, Quantitative cerebral blood flow determinations in acute ischemic stroke: relationship to computed tomography and angiography. Stroke 1997;28:2208-2213 [DOI] [PubMed] [Google Scholar]
- 33.Firlik AD, Rubin G, Yonas H, Wechsler , Relation between cerebral blood flow and neurologic deficit resolution in acute ischemic stroke. Neurology 1998;51:177-182 [DOI] [PubMed] [Google Scholar]
- 34.De Crespigny AJ, Marks MP, Enzmann DR, Moseley ME, Navigated diffusion imaging of normal and ischemic human brain. Magn Reson Med 1995;33:720-728 [DOI] [PubMed] [Google Scholar]
- 35.Warach S, Chien D, Li W, Ronthal M, Edelman RR, Fast magnetic resonance diffusion-weighted imaging of acute stroke. Neurology 1992;42:1717-1723 [DOI] [PubMed] [Google Scholar]
- 36.Le Bihan D, Breton E, Lallemand D, Grenier P, Cabanis E, Laval-Jeantet M, MR imaging of intravoxel incoherent motions: application to diffusion and perfusion in neurologic disorders. Radiology 1986;161:401-407 [DOI] [PubMed] [Google Scholar]
- 37.Moseley ME, Cohen Y, Mintorovitch J, et al. Early detection of regional cerebral ischemia in cats: comparison of diffusion- and T2-weighted MRI and spectroscopy. Magn Reson Med 1990;14:330-346 [DOI] [PubMed] [Google Scholar]
- 38.Kucharczyk J, Vexler Z, Roberts T, et al. Echo-planar perfusion-sensitive MR imaging of acute cerebral ischemia. Radiology 1993;188:711-717 [DOI] [PubMed] [Google Scholar]
- 39.Lövblad KO, Laubach HJ, Baird AE, et al. Clinical experience with diffusion-weighted MR in patients with acute stroke. AJNR Am J Neuroradiol 1998;19:1061-1066 [PMC free article] [PubMed] [Google Scholar]
- 40.Flacke S, Keller E, Hartmann A, et al. Improved diagnosis of early cerebral infarct by the combined use of diffusion and perfusion imaging. Fortschr Röntgenstr 1998;168:493-501 [DOI] [PubMed] [Google Scholar]