Abstract
BACKGROUND AND PURPOSE: Magnetization-transfer imaging is a technique that could provide indirect evidence of the characteristics of multiple sclerosis (MS) lesions. The purpose of this work was to study the evolution of MS lesions on T1-weighted MR images over time and to investigate changes in magnetization-transfer ratio (MTR) values of MS lesions with different initial appearances on contrast-enhanced T1-weighted images.
METHODS: Eleven patients with relapsing-remitting MS were studied with MR imaging. The MTRs were calculated for 47 lesions that had been classified according to their appearance on contrast-enhanced T1-weighted images. Each patient was examined at four time points over a 1-year period. The MTR changes observed in the selected lesions were compared with their initial T1-weighted appearance.
RESULTS: The lowest MTR values were initially found in hypointense nonenhancing lesions and in ring-enhancing lesions, with both types showing a hypointense center. Changes in MTR values were more dynamic and reversible in ring-enhancing than in hypointense nonenhancing plaques. Nodular-enhancing lesions had slightly lower initial MTRs than did isointense nonenhancing lesions.
CONCLUSION: The absence or presence of contrast uptake may indicate a different pathologic basis for hypointense MS lesions on T1-weighted MR images. These differences should be kept in mind when considering T1 lesion load as a surrogate marker of disability in MS.
In recent years, MR imaging has had a major impact on understanding and managing multiple sclerosis (MS), with an established role as an aid to its diagnosis and as a surrogate marker of drug efficacy in treatment trials (1–3). Despite the remarkable sensitivity of MR imaging to the pathologic lesions of MS (4–6), only modest correlations between disability and conventional MR imaging parameters, in particular T2 lesion load, have been found (7–10). This weak correlation is partially influenced by the low pathologic specificity of T2-weighted abnormalities, raising the possibility that this technique provides a poor reflection of the processes in MS that contribute most to persistent conduction impairment and clinical dysfunction, such as severe demyelination and axonal damage.
New MR imaging techniques considered as specific markers of demyelination and axonal degeneration, such as hypointense T1 lesion load and magnetization-transfer ratios (MTRs), have correlated more strongly with disability than have conventional T2 lesion load (8, 11, 12), and may improve the role of MR imaging in evaluating drug efficacy in treatment trials (3). Results from these two MR techniques correlate strongly with each other (13–15), suggesting that they provide similar pathologic information. A recent postmortem MR imaging study has shown that the degree of hypointensity of MS lesions on T1-weighted images correlates histopathologically with matrix destruction, including decrease in axonal density (16), indicating that hypointense lesions correspond to severe and irreversible tissue destruction. The MTR can be used to quantify the integrity of myelinated white matter, and has been reported to decrease greatly with severe demyelination and axonal loss (17, 18). Although T1-weighted hypointensity and decreased MTR probably reflect the same histopathologic substrate, and their concomitant use in the analysis of MS plaques may seem redundant, both can be useful. The former depicts the presence of inflammatory activity when used with contrast material, while the latter gives an objective, quantitative measurement of the degree of matrix destruction, data that are especially useful in longitudinal observations. The histopathologic substrate of hypointense T1 lesions with severely decreased MTRs is not well understood. Postmortem studies have shown correlations with severe matrix destruction, while longitudinal studies (obviously lacking histologic correlation) have shown that these lesions have the potential to revert (19, 20), a process that is thought to be related to remyelination.
The purpose of this study was to investigate the evolution of multiple sclerosis (MS) lesions on T1-weighted MR images over time and to describe the changes in MTR values of MS lesions with different initial appearances on contrast-enhanced T1-weighted MR images.
Methods
Eleven patients with MS (nine men and two women) with a mean age of 32 years (range, 21 to 46 years) were included in the study. The mean duration of the disease was 4.7 years (range, 1 to 14 years). MS was diagnosed definitively in all patients according to the Poser criteria (21), and all subjects were determined to have the relapsing-remitting form. The mean disease severity at point of entry into the study was 2.0 (range, 0.0 to 6.0) on the Expanded Disability Status Scale (22). The study was approved by the local ethics committee of Vall d'Hebron hospital. Informed consent was obtained from all patients.
MR imaging examinations were performed in all patients at four time points over a 1-year period (at baseline and at 1, 3, and 12 months) using contrast-enhanced T1- and T2-weighted imaging and unenhanced magnetization transfer imaging (MTI). Repositioning was achieved by using a protocol based on identification of standardized anatomic landmarks (23). None of the patients had been treated previously with cytotoxic or immunomodulatory drugs, and no corticosteroids were administered during the study.
The MR imaging studies were performed on a 1.5-T superconductive magnet using a quadrature transmitter/receiver head coil. The MTI studies were performed by obtaining a 2D gradient-echo transverse sequence with the following parameters: 714/12 (TR/TE), 20° flip angle, 5-mm section thickness with a 1.0-mm intersection gap, and a 192 × 256 matrix. This 2D gradient-echo sequence was repeated with the same imaging parameters but with an additional off-resonance preparation pulse used to saturate the macromolecular protons to obtain MT contrast. This saturation pulse had the following parameters: an off-resonance frequency-selective gaussian RF pulse centered 1.5 kHz below the water frequency, a bandwidth of 250 Hz, and a duration of 7.68 milliseconds. After intravenous injection of contrast agent at a dose of 0.1 mmol/kg, we obtained a dual-echo spin-echo axial image (2200/12–80) and, immediately afterward, a T1-weighted spin-echo axial image (550/14). These two sequences were obtained with the same section thickness and at the same position as the MTI sequences.
The MTRs were quantified as a percentage of signal loss according to the following equation:
 |
in which So is the mean signal intensity for a given region obtained from the 2D gradient-echo sequence without the saturation pulse, and Ss is the mean signal intensity for the same region with the saturation pulse. Pixel-by-pixel MTR maps were constructed from the two sets of 2D gradient-echo images. To exclude misregistration between the two sets, a visual analysis that excluded mismatching of the MTR maps was done before calculating the MTRs in selected areas. In cases of mismatch, the two sets of images were repeated.
In a control group of six healthy volunteers (three men and three women) with a mean age of 30 years (range, 26 to 35 years) and normal findings on brain MR images, MTRs of the white matter were measured in three supratentorial locations.
The mean values of the MTRs within selected MS lesions and in the three areas of supratentorial normal-appearing white matter (NAWM) were obtained by averaging the pixel values in the regions of interest (ROIs) on the MTR map. Proper localization of the ROIs on the map was based on the position of the NAWM and of selected plaques on the T2-weighted images. The diameters of the ROIs were adjusted to the individual size of the lesions on the baseline image and kept constant on the follow-up images. In ring-enhancing lesions, the ROI did not include the enhancing periphery. To avoid artifacts, lesions abutting the ventricles, those with a diameter of less than 6 mm, and those located infratentorially were not considered for MTR measurement. We studied lesions with an initial size of 6 to 20 mm. In addition to calculating the MTRs, we visually classified each lesion into a category according to its signal intensity relative to normal brain tissue on contrast-enhanced T1-weighted images: nonenhancing isointense (six lesions), nonenhancing hypointense (22 lesions), nodular-type enhancement (eight lesions), and ring-type enhancement (11 lesions). All enhancing lesions were considered to be the first manifestation of new activity, since they had not been visible on MR images obtained within the preceding year.
The MTRs of the selected lesions were studied in relation to their category of appearance on initial and serial contrast-enhanced T1-weighted images. All calculations and characterizations of the lesions were made at the same time for each patient by one author, who was not blinded to the imaging or patient data.
Statistical analysis was performed with the SigmaStat software package, version 1.02 (Jandel Scientific Gmbh, Erkrath, Germany). One-way analysis of variance followed by the Student-Newman-Keuls test was used to compare the MTR values obtained on the initial and 12-month studies with the characteristics of the plaques on the contrast-enhanced T1-weighed images. A paired t-test was applied to analyze the differences between the MTR changes obtained with the follow-up MR studies and the various types of plaques as defined on the contrast-enhanced T1-weighted images. Results are presented as mean ± standard deviation. A P value of less than .05 was used to assign significant difference.
Results
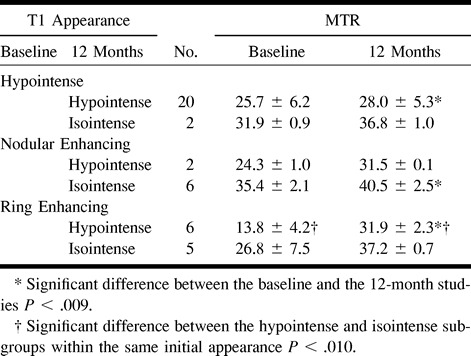
The mean MTRs of the MS lesions were significantly lower than those of the NAWM in both patients and volunteers. Significant differences in MTRs were found among the different categories of plaques classified according to their appearance on contrast-enhanced T1-weighted images. MTRs were significantly lower in ring-enhancing (19.7 ± 8.8%) than in nodular-enhancing (32.6 ± 3.5%) plaques. There were also differences in MTRs of nonenhancing plaques according to their appearance on T1-weighted images: lower in hypointense lesions (26.3 ± 6.2%) than in isointense lesions (35.5 ± 2.6%). A comparison of MTRs in the four categories of plaques showed significant differences among all of them except between the nodular-enhancing and nonenhancing isointense plaques (Table 1 and Fig 1). No significant variations in MTRs were noted between the entry and 12-month studies in NAWM in patients or in the isointense nonenhancing plaques (Fig 2). There were, however, significant variations between the entry and 12-month studies in nodular and ring-enhancing plaques, and in hypointense nonenhancing plaques. These variations were pronounced in ring-enhancing plaques, with increases from an initial value of 19.7 ± 8.8% to a 12-month value of 34.3 ± 3.2% (Fig 3), moderate in nodular-enhancing plaques (32.6 ± 5.1% to 38.3 ± 4.5%) (Fig 4), and slight in hypointense nonenhancing plaques (26.3 ± 6.2% to 28.8 ± 5.7%) (Fig 4). The strong increase seen in ring-enhancing plaques occurred mainly during the first 3 months (Fig 1). In no case, did MTRs of the enhancing lesions return to NAWM values, even though they were completely T1 isointense with surrounding NAWM. On contrast-enhanced T1-weighted images obtained at 12 months, six of the eight initially nodular-enhancing plaques became isointense with respect to the neighboring NAWM, whereas six of the 11 initially ring-enhancing plaques became markedly hypointense and showed a clear reduction in final size (Table 2). The MTRs of ring-enhancing lesions that converted to isointense had higher initial and 12-month values (26.86 ± 7.5% and 37.2 ± 0.7%, respectively) than did ring-enhancing lesions that converted to hypointense (13.8 ± 4.2% and 31.9 ± 2.3%, respectively) (Table 3). All the isointense lesions remained isointense at the final MR examination, and 20 of the 22 hypointense lesions remained hypointense, while the other two converted to isointense (Table 2).
TABLE 1:
Magnetization transfer ratio of lesions at baseline and at 12 months: examinations are stratified by pattern of appearance on baseline contrast-enhanced T1-weighted images

fig 1.
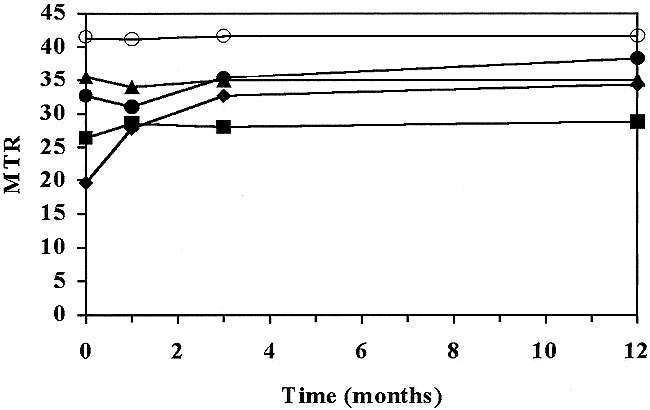
Two-dimensional plot of mean MTR values versus time (in months). MTR values are stratified according to the appearance of MS lesions on the baseline contrast-enhanced T1-weighted image. Hypointense nonenhancing, nodular-enhancing, and ring-enhancing lesions show a significant MTR increase on the 12-month image. The increase is higher for ring-enhancing lesions and occurs mainly during the first 3 months. MTR values in the NAWM and the isointense nonenhancing lesions do not show significant changes. Open circles indicate NAWM; triangles, isointense without enhancement; solid circles, nodular-type enhancement; squares, hypointense without enhancement; diamonds, ring-type enhancement.
fig 2.
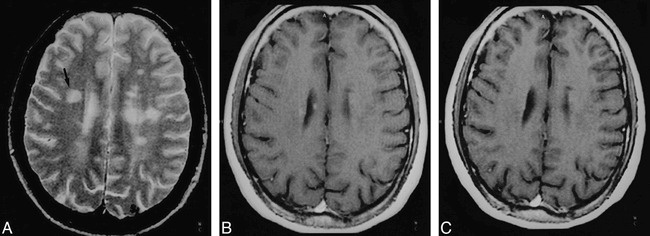
A–C, T1 isointense nonenhancing lesion in the right frontal white matter. Axial T2-weighted image (2200/80/1) (A) and contrast-enhanced T1-weighted image (550/14/2) (B) at a comparable anatomic level are shown at day 0 and at 12 months (C). The lesion (arrow, A) shows no significant change on the 12-month image, and the MTR values remained between 35% on the baseline image and 33% on the 12-month image.
fig 3.
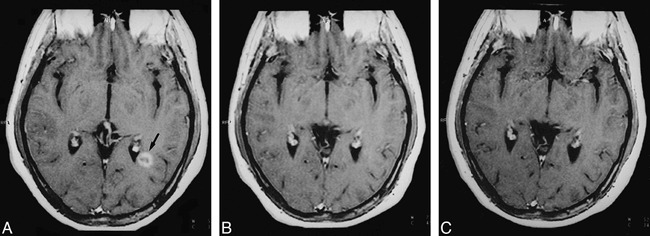
A–C, Serial MR follow-up of a ring-enhancing lesion in the left periventricular temporal white matter. The lesion (arrow, A) is shown at three time points: baseline (A), 1 month (B), and 12 months (C) on contrast-enhanced T1-weighted images (550/14/2). The ring-enhancing pattern at baseline disappears on the 1-month image. At 12 months, the lesion is completely isointense with respect to NAWM on contrast-enhanced T1-weighted images. In this lesion, the MTR increased from 22% on the baseline image to 36% after 12 months.
fig 4.
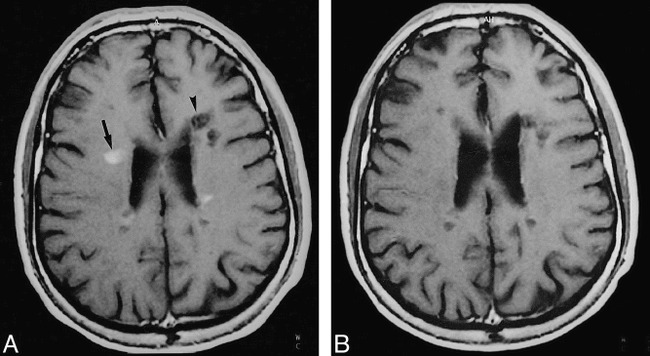
A and B, Serial MR follow-up of a nodular-enhancing lesion in the right frontal white matter and a nonenhancing hypointense lesion (arrow, A) in the left frontal white matter (arrowhead, A) on contrast-enhanced T1-weighted images (550/14) at baseline (A) and 12 months later (B). The nodular-enhancing lesion has become completely isointense on the 12-month image. In this lesion, the MTR increased from 34% on the baseline image to 39% on the 12-month image. The nonenhancing lesion in the left frontal lobe shows no significant change on the serial MR follow-up images, and the MTR values remained between 24% on the baseline image and 26% on the 12-month image.
TABLE 2:
Changes in the pattern of appearance on contrast-enhanced T1-weighted images between the baseline and 12-month studies

TABLE 3:
Magnetization transfer ratio (MTR) of lesions at baseline and at 12 months: examinations are stratified for pattern of appearance on baseline and 12-month images
Discussion
MR imaging parameters are widely used as surrogate markers of disability in MS clinical trials. However, the correlation between T2 lesion load and disability is poor (7–10). This clinical/MR imaging discrepancy partially reflects the nonspecificity of T2-weighted images, which ignores the pathophysiologic heterogeneity of brain lesions visible on MR images. In recent years, considerable effort has been directed toward the development and clinical application of new MR techniques, such as T1-weighted imaging and MTI, which focus on demyelination and axonal loss (11, 17, 18), considered to be the pathologic substrate of persistent functional disability. Hypointense lesions on T1-weighted images that correlate with strongly decreased MTRs have been thought to represent chronic plaques with severe demyelination or axonal loss, providing better correlation with disability than do findings on T2-weighted images (24). This hypothesis was validated in a recent postmortem study (16), which showed that decreased MTRs and T1-weighted hypointense lesions correlate significantly with axonal loss and matrix destruction, suggesting that both these parameters can serve as specific markers in treatment trials to detect persistent deficit (2, 3). Nonetheless, it should be taken into account that postmortem studies are biased toward chronic lesions, and that hypointense lesions with strongly decreased MTRs can also be acute (25).
In our study, the average MTRs of isointense nonenhancing lesions were significantly decreased from the NAWM on the baseline images, and showed no significant variation over a 1-year period, suggesting a slight but steady degree of demyelination, with little matrix destruction. The hypointense nonenhancing lesions showed strongly decreased basal MTRs that increased to a small but significant degree over the 12-month period. These findings reflect considerable demyelination and axonal loss with progressive remyelination, and indicate that this process is active even in nonacute MS plaques. We found significant differences in MTRs between ring-enhancing and nodular-enhancing lesions, probably reflecting variable tissue loss and inflammation. These differences have been reported in previous cross-sectional studies in which MTRs of the central portion of ring-enhancing lesions are markedly diminished in relation to other types of MS lesions (26–28), suggesting that ring-enhancing lesions represent reactivated chronic lesions with expansion of the extracellular space due to severe tissue loss.
In our study, however, all enhancing lesions corresponded to the first manifestation of new activity, since they were not visible on previous examinations. According to our longitudinal measurements, the MTR changes observed in nodular-enhancing lesions can be explained by resolution of the inflammatory response and progressive remyelination, which correlate with the clear tendency of these lesions to become isointense on serial T1-weighted images. Nonetheless, the marked reduction in size or even the complete disappearance of ring-enhancing lesions on T1-weighted images and their highly reversible MTRs would not be expected if they represented severe matrix destruction, and cannot be explained by progressive remyelination at the periphery of the lesion. These ring-enhancing plaques may actually represent reversible expansion of the extracellular space due to edema fluid accumulation in response to a severe inflammatory reaction. With cessation of the inflammatory reaction, the edema would resolve, producing a marked decrease in plaque size and significant restoration of the brain tissue and MTR. This hypothesis is consistent with surgical findings in some patients with large focal tumorlike demyelinating plaques showing grossly fluid-filled accumulations (29, 30) and with the spontaneous disappearance of some of these type of plaques on follow-up imaging studies (25, 31). In most cases, however, ring-enhancing lesions leave a nonenhancing hypointense plaque on the 12-month image that is smaller than on the baseline image, suggesting that some irreversible matrix destruction is also produced. The evolution of this subgroup of ring-enhancing plaques can be correlated with their initial low MTR values and final MTR values that are similar to ones obtained in nonenhancing hypointense lesions. From our findings, it seems that the type of contrast uptake in active inflammatory MS lesions depends on the intensity of the inflammatory reaction. Ring-enhancing plaques probably have a higher degree of inflammatory reaction than do nodular-enhancing plaques, leading, with time, to small hypointense lesions with a high degree of matrix destruction. In contrast, nodular-enhancing lesions have a lesser degree of inflammatory response, leading, in most cases, to isointense lesions, probably without significant matrix destruction.
Diffusion-weighted MR imaging has shown increased water motion in all types of MS plaques that is higher in acute lesions and in chronic T1-hypointense lesions than in older plaques (32). In active lesions, this increase in diffusion coefficient may be related to the presence of edema, while in chronic hypointense lesions it may be related to persistent demyelination and axonal loss (32, 33). This hypothesis, in accordance with our findings, is partially supported by an experimental diffusion-weighted MR study using animal models of multiple sclerosis combined with histologic studies, which showed that the increased diffusion coefficient corresponds to edema (34, 35). To investigate further the hypothesis that the decreased and partially reversible MTR and the increased diffusion coefficient seen in some acute MS plaque are due to the presence of extracellular edema but not to severe demyelination and axonal loss, it might be useful to perform a combined longitudinal study of different types of plaques by means of MTR and diffusion-weighted MR imaging. Our theory contradicts the classic idea that decreased MTR in ring-enhancing lesions reflects demyelination (14), based on reports showing that MTR decreases only slightly with edema and more strongly with severe demyelination and axonal loss (17, 18). These initial reports, however, were carried out in experimental animal models, whose characteristics may not be identical to the real heterogeneity of human MS plaques.
Conclusion
We propose that the absence or presence of contrast uptake in hypointense MS lesions on T1-weighted MR images may be an indicator of different pathologic substrates. This hypothesis is suggested by the dynamic and reversible changes observed in ring-enhancing lesions on serial contrast-enhanced T1-weighted and MTR MR images as compared with the more steady characteristics observed in nonenhancing hypointense MS lesions. Ring-enhancing lesions seem to be partially reversible while nonenhancing hypointense lesions probably reflect severe and irreversible matrix destruction. These differences should be kept in mind when considering T1 lesion load as a surrogate marker of disability in MS.
Acknowledgments
We thank Montse Diaz, Gemma Cosella, Dolors Rodríguez, Nuria Abdón, Anna Garcia, Montse Santos, and Encarnación Lorenzo for their invaluable technical assistance, and Celine L. Cavallo for preparation of the manuscript.
Footnotes
Supported by the Institut de Diagnòstic per la Imatge (Catalonian Health Department), and by a grant from Spain's Fondo de Investigación Sanitaria (FIS-Health Research Fund) 96/1747 from the Ministry of Health and Welfare.
Address reprint requests to A. Rovira-Cañellas, MD, Magnetic Resonance Unit, Department of Radiology, Hospital Universitari Vall d'Hebron, Paseig Vall d'Hebron 119–129, 08035 Barcelona, Spain.
References
- 1.Whitaker JN, McFarland HF, Rudge P, Reingold SC, Outcomes assessment in multiple sclerosis clinical trials: a critical analysis. Multiple Sclerosis 1995;1:37-47 [DOI] [PubMed] [Google Scholar]
- 2.Miller DH, Albert PS, Barkhof F, et al. Guidelines for the use of magnetic resonance techniques in monitoring the treatment of multiple sclerosis. Ann Neurol 1996;39:6-16 [DOI] [PubMed] [Google Scholar]
- 3.Miller DH, Grossman RI, Reingold SC, McFarland HF, The role of magnetic resonance techniques in understanding and managing multiple sclerosis. Brain 1998;121:3-24 [DOI] [PubMed] [Google Scholar]
- 4.Runge VM, Price AC, Kirshner HS, et al. MR imaging of MS: a study of pulse-techniques efficiency. AJR Am J Roentgenol 1984;143:1015-1026 [DOI] [PubMed] [Google Scholar]
- 5.Ormerod IEC, Miller DH, McDonald WI, et al. The role of NMR imaging in the assessment of multiple sclerosis and isolated neurological lesions: a quantitative study. Brain 1987;110:1579-1616 [DOI] [PubMed] [Google Scholar]
- 6.Goodkin DE, Rudick RA, Ross JS, The use of brain magnetic resonance imaging in multiple sclerosis. Arch Neurol 1994;51:505-516 [DOI] [PubMed] [Google Scholar]
- 7.Kappos L, Stadt D, Keil W, el al An attempt to quantify magnetic resonance imaging in multiple sclerosis: correlation with clinical parameters. Neurosurg Rev 1987;10:133-135 [DOI] [PubMed] [Google Scholar]
- 8.Gass A, Barker GJ, Kidd D, el al Correlation of magnetization transfer ratio with clinical disability in multiple sclerosis. Ann Neurol 1994;36:62-67 [DOI] [PubMed] [Google Scholar]
- 9.Filippi M, Paty DW, Kappos L, et al. Correlations between changes in disability and T2-weighted brain MRI activity in multiple sclerosis: a follow-up study. Neurology 1995;45:255-260 [DOI] [PubMed] [Google Scholar]
- 10.Gasperini C, Horsfield MA, Thorpe JW, et al. Macroscopic and microscopic assessments of disease burden by MRI in multiple sclerosis: relationship to clinical parameters. J Magn Reson Imaging 1996;6:580-584 [DOI] [PubMed] [Google Scholar]
- 11.Walderveen MAA, Barkhoff F, Hommes OR, et al. Correlating MRI and clinical disease activity in multiple sclerosis: relevance of hypointense lesions on short-TR/short-TE (T1-weighted) spin-echo images. Neurology 1995;45:1684-1690 [DOI] [PubMed] [Google Scholar]
- 12.van Buchem MA, McGowan JC, Kolson DL, Polansky M, Grossman RI, Quantitative volumetric magnetization transfer analysis in multiple sclerosis: estimation of macroscopic and microscopic disease burden. Magn Reson Med 1996;36:632-636 [DOI] [PubMed] [Google Scholar]
- 13.Loevner LA, Grossman RI, McGowan JC, Ramer KN, Cohen JA, Characterization of multiple sclerosis plaques with T1-weighted MR and quantitative magnetization transfer. AJNR Am J Neuroradiol 1995;16:1473-1479 [PMC free article] [PubMed] [Google Scholar]
- 14.Hiehle JF, Grossman RI, Ramer KN, Gonzalez-Scarano F, Cohen JA, Magnetization transfer effects in MR-detected multiple sclerosis lesions: comparison with gadolinium-enhanced spin-echo images and nonenhanced T1-weighted images. AJNR Am J Neuroradiol 1995;16:69-77 [PMC free article] [PubMed] [Google Scholar]
- 15.van Waesberghe JHTM, Castelijns JA, Scheltens Ph, et al. Comparison of four potential MR parameters for severe tissue destruction in multiple sclerosis. Magn Reson Imaging 1997;15:155-162 [DOI] [PubMed] [Google Scholar]
- 16.van Walderveen MAA, Kamphorst W, Scheltens P, et al. Histopathologic correlate of hypointense lesions on T1-weighted spin-echo MRI in multiple sclerosis. Neurology 1998;50:1282-1288 [DOI] [PubMed] [Google Scholar]
- 17.Dousset V, Grossman RI, Ramer KN, Schnall MD, Young LH, Gonzalez-Scarano F, Experimental allergic encephalomyelitis and multiple sclerosis: lesion characterization with magnetization transfer imaging. Radiology 1992;182:483-491 [DOI] [PubMed] [Google Scholar]
- 18.Dousset V, Brochet B, Vital A, et al. Lysolecithin-induced demyelination in primates: preliminary in vivo study with MR and magnetization transfer. AJNR Am J Neuroradiol 1995;16:225-231 [PMC free article] [PubMed] [Google Scholar]
- 19.Lai HM, Davie CA, Gass A, et al. Serial magnetization transfer ratios in gadolinium-enhancing lesions in multiple sclerosis. J Neurol 1997;244:308-311 [DOI] [PubMed] [Google Scholar]
- 20.van Waesberghe JHTM, van Walderveen MAA, Castelijns JA, et al. Patterns of lesion development in multiple sclerosis: longitudinal observations with T1-weighted spin-echo and magnetization transfer MR. AJNR Am J Neuroradiol 1998;19:675-683 [PMC free article] [PubMed] [Google Scholar]
- 21.Poser CM, Paty D, Scheinberg L, et al. New diagnostic criteria for multiple sclerosis: guidelines for research protocols. Ann Neurol 1983;13:227-231 [DOI] [PubMed] [Google Scholar]
- 22.Kurtzke JF, Rating neurologic impairment in multiple sclerosis: an expanded disability status scale (EDSS). Neurology 1983;33:1444-1452 [DOI] [PubMed] [Google Scholar]
- 23.Gallagher HL, MacManus DG, Webb SL, Miller DH, A reproducible repositioning method for serial magnetic resonance imaging studies of the brain in treatment trials for multiple sclerosis. J Magn Reson Imaging 1997;7:439-441 [DOI] [PubMed] [Google Scholar]
- 24.Truyen L, van Waesberghe JHTM, van Walderveen MAA, et al. Accumulation of hypointense lesions (“black holes”) on T1 spin-echo MRI correlates with disease progression in multiple sclerosis. Neurology 1996;47:1469-1476 [DOI] [PubMed] [Google Scholar]
- 25.van Waesberghe JHTM, van Walderveen MAA, Castelijns JA, et al. Natural history of hypointense lesions in multiple sclerosis. J Neurol 1997;244(Suppl 3):87 [Google Scholar]
- 26.Petrella JR, Grossman RI, McGowan JC, Campbell G, Cohen JA, Multiple sclerosis lesions: relationship between MR enhancement pattern and magnetization transfer effect. AJNR Am J Neuroradiol 1996;17:1041-1049 [PMC free article] [PubMed] [Google Scholar]
- 27.Hiehle JF, Lenkinski RE, Grossman RI, et al. Correlation of spectroscopy and magnetization transfer imaging in the evaluation of demyelinating lesions and normal appearing white matter in multiple sclerosis. Magn Reson Med 1994;32:285-293 [DOI] [PubMed] [Google Scholar]
- 28.Campi A, Filippi M, Comi G, Scotti G, Geverini S, Dousset V, Magnetization transfer ratios of contrast-enhancing and nonenhancing lesions in multiple sclerosis. Neuroradiology 1996;38:115-119 [DOI] [PubMed] [Google Scholar]
- 29.Kepes JJ, Large focal tumor-like demyelinating lesions of the brain: intermediate entity between multiple sclerosis and acute disseminated encephalomyelitis? A study of 31 patients. Ann Neurol 1993;33:18-27 [DOI] [PubMed] [Google Scholar]
- 30.Ishihara O, Yamaguchi Y, Matsuishi T, et al. Multiple ring enhancement in a case of acute reversible demyelinating disease of childhood suggestive of acute multiple sclerosis. Brain Dev 1984;6:401-406 [DOI] [PubMed] [Google Scholar]
- 31.Youl BD, Kermode AG, Thompson AJ, et al. Destructive lesions in demyelinating disease. J Neurol Neurosurg Psychiatry 1991;54:288-292 [DOI] [PMC free article] [PubMed] [Google Scholar]
- 32.Larsson HBW, Thomsen C, Frederiksen J, et al. In vivo magnetic resonance diffusion measurements in the brain of patients with multiple sclerosis. Magn Reson Imaging 1992;10:7-12 [DOI] [PubMed] [Google Scholar]
- 33.Droogan AG, Clark CA, Werring DJ, Barker GJ, Miller DH, Navigated spin-echo diffusion-weighted imaging in clinical phenotypes of multiple sclerosis (abstr). In: Proceedings of the 6th Scientific Meeting and Exhibition of the International Society for Magnetic Resonance in Medicine. Sydney, Australia: 1998:117
- 34.Heide AC, Richards TL, Alvord EC, et al. Diffusion imaging in experimental encephalomyelitis. Magn Reson Med 1993;29:478-484 [DOI] [PubMed] [Google Scholar]
- 35.Verhoye MR, Gravenmade EJ, Raman ER, et al. In vivo non-invasive determination of abnormal water diffusion in the rat brain studied in an animal model for multiple sclerosis by diffusion-weighted NMR imaging. Magn Reson Imaging 1996;14:521-532 [DOI] [PubMed] [Google Scholar]


