Abstract
BACKGROUND AND PURPOSE: Previous studies have failed to show significant correlations between the number and extent of T2 spinal cord lesions and the clinical status of multiple sclerosis (MS) patients. We evaluated 1) whether it is feasible to create magnetization transfer–ratio (MTR) histograms of the cervical cord in patients with MS by using two different acquisition schemes, and 2) whether cervical cord MTR histogram metrics were different from those of healthy control subjects and between MS patients with and without locomotor disability.
METHODS: We obtained two sets of gradient-echo sequences with and without a saturation pulse from 90 MS patients and 20 sex- and age-matched healthy control subjects. One set consisted of 20 axial, contiguous slices with a thickness equal to 5 mm. The other set consisted of 17 sagittal slices with a thickness equal to 3 mm and an interslice gap equal to 0.3 mm. After image coregistration and removal of tissues around the cervical cord, MTR histograms were created. The average MTR, the peak height, and the peak position of the histograms were measured. All of these measurements were from the whole of the cervical cord, thus including both MS lesions and normal-appearing tissue.
RESULTS: When comparing the MTR histograms obtained using axial, contiguous, 5-mm-thick slices, MS patients had significantly lower average cervical cord MTR and peak height than did control subjects. When comparing the MTR histograms obtained using sagittal, 3-mm-thick slices, MS patients also had significantly lower average cervical cord MTR and peak location than did control subjects. Patients with locomotor disability had significantly lower average cord MTR and peak location than those without.
CONCLUSION: This study shows that it is feasible to obtain MTR histograms of the cervical cord from MS patients by using different acquisition schemes. Our results also suggest that the assessment of MS cervical cord damage, achieved using MTR histograms, may lead to a better understanding of the clinical manifestations of the disease.
The pathology of multiple sclerosis (MS) is characterized by macroscopic lesions in the white matter and by more subtle changes occurring in the so-called normal-appearing white matter (NAWM) (1–4), including diffuse astrocytic hyperplasia, patchy edema, perivascular infiltration, abnormally thin myelin, and axonal loss (1–4). The extent and severity of such changes in the brain have been shown to contribute to the evolution of the disease (5–7).
The spinal cord is involved frequently in MS, with a postmortem study showing cord lesions in 86% of randomly selected MS patients (8), and MR imaging cord abnormalities in 47% to 90% of patients studied (9–16). Previous studies (10, 13–15), however, have failed to show significant correlation between the number and extent of spinal cord lesions and the clinical status of patients with MS. This is not completely unexpected, considering that T2-weighted imaging lacks specificity to the heterogeneous pathologic substrates of the MS lesions and does not give any information about the NAWM changes (17). Histogram analysis of magnetization-transfer (MT) imaging scans (18) is a promising technique that could be used to overcome these two limitations.
MT imaging is based on the interactions between protons in a relatively free environment and those where motion is restricted. In neural tissue, these two states correspond to the protons in tissue water, and in the macromolecules of myelin and other cell membranes. An off-resonance RF pulse is applied, which saturates the magnetization of the less mobile protons, and this is transferred to the mobile protons, thus reducing the signal intensity from the observable magnetization. The degree of signal loss depends on the density of the macromolecules in a given tissue. Thus, a low MT ratio (MTR) indicates a reduced capacity of the macromolecules to exchange magnetization with the surrounding water molecules, reflecting damage to myelin or to the axonal membrane (19). In MS patients, average brain lesion MTR (20) correlates better with physical disability than does the volume of abnormalities on conventional T2-weighted MR images. In addition, it has been shown that, in the brain, estimates of the amount and severity of microscopic and macroscopic disease burden can be obtained using MTR histograms (18), which may provide a more global picture of disease burden in MS. Brain MTR histogram–derived measures from patients with MS are different from those of healthy control subjects (7, 18, 21–23) and are correlated with the clinical manifestations of MS (7, 21, 22).
In this study, we created MTR histograms of the cervical cord tissue from a large cohort of MS patients by using two different acquisition schemes. We also evaluated whether the corresponding cervical cord MTR histogram metrics were different from those of healthy control subjects and between MS patients with and without locomotor disability.
Methods
Patients
Ninety patients (49 women and 41 men) were included in the study. Their mean age was 37.9 years (SD, 10.1 years), their median disease duration was 7 years (range, 2–34 years), and their median Expanded Disability Status Scale (EDSS) score (24) was 2.5 (range, 0.0–7.5). According to Lublin and Reingold's criteria (25), 51 patients were classified as having relapsing-remitting, 31 as having secondary-progressive, and eight as having primary-progressive MS. None of the patients had relapses or steroid treatment during the 3 months preceding the initiation of the study. Twenty healthy volunteers (12 women and 8 men; mean age = 36.8 years [SD = 7.4 years]) served as control subjects. Local ethical committee approval and written informed consent from all the patients and control subjects were obtained before the study was initiated.
MR Imaging
MR scans were obtained from all the patients and volunteers by using a 1.5-T system. With a tailored cervical spine phased-array coil for signal reception, we obtained two sets of two-dimensional gradient-echo sequences (640/10/2 [TR/TE/excitations], flip angle = 20°) with and without a saturation pulse (the saturation pulse was an off-resonance RF pulse centered 1.5 kHz below the water frequency with a gaussian envelope of 7.68 ms duration and α = 500°). One set consisted of 20 axial, contiguous slices with a thickness equal to 5 mm (FOV = 250 × 250 mm; matrix size = 192 × 256) (Fig 1). The other set consisted of 17 sagittal slices with a thickness equal to 3 mm and an interslice gap equal to 0.3 mm (FOV = 280 × 280 mm; matrix size = 224 × 256) (Fig 2).
fig 1.
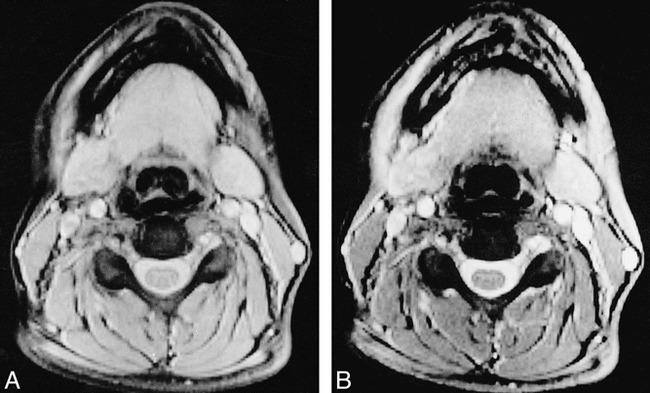
Axial gradient-echo (TR/TE/excitations = 640/10/2) images of cervical cord at C5 without (A) and with (B) the saturation pulse.
fig 2.
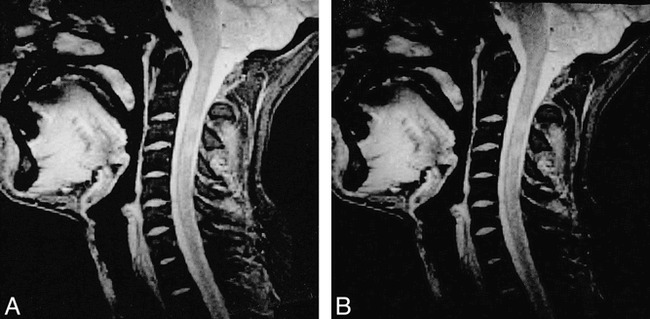
Midsagittal gradient-echo (640/10/2) images of cervical cord without (A) and with (B) saturation pulse. Two lesions are visible.
Image Analysis and Postprocessing
From the two sets of gradient-echo images, with and without the saturation pulse, MTR images were derived pixel-by-pixel according to the following equation: MTR = (M0−MS)/M0 × 100%, in which M0 is the signal intensity for a given pixel without the saturation pulse and MS is the signal intensity for the same pixel when the saturation pulse is applied. From the two MTR maps, cervical cord MTR histograms then were obtained from all MS patients and volunteers as follows. First, the two gradient-echo images (ie, with and without the MT saturation pulse) were coregistered. Coregistration of images was performed using an automated technique based on pixel similarity measures (26, 27). Then, the entire cervical cord was segmented from the MTR images by a single observer, without knowing to whom the scans belonged, using a segmentation technique based on local thresholding (28). Finally, MTR histograms were created (MTR values range from 0% to 100%, and a histogram of MTR values was created with 100 bins, each bin containing MTR values between two consecutive integer values, with the lower integer being inclusive). We excluded from the analysis all the pixels with MTR values lower than 10% to eliminate cerebrospinal fluid and points corresponding to noise alone. To reduce partial volume effects from the cerebrospinal fluid, only the two central slices of the sagittal set of images were used to create MTR histograms, whereas all the available images (which covered the entire cervical cord) were used for the axial set. To correct for the between-patient differences in cord volume, each histogram was normalized by dividing the height of each bin by the total number of pixels included. The normalized histogram retains the same shape as the original histogram, but the total area under each normalized histogram is the same and equal to unity. This allows parameters related to the height of the histogram to be compared across subjects, regardless of the total number of pixels included. For each histogram, the following measures were derived: the average MTR, the relative peak height (ie, proportion of pixels at the most common MTR value), and the peak position (ie, the most common MTR). All histogram-derived measures were from the entire cervical cord tissue, thus including both MS lesions and normal-appearing white and gray matter. The cord MTR histograms from 10 randomly selected patients were created on a second occasion (separated by the first one by an interval of at least 1 month) by the same observer, who was blinded to the results of the previous analysis, using the same methodology previously described. The intraobserver coefficients of variation were always lower than 5% for all the MTR histogram–derived measures of the two histograms.
Statistical Analysis
The two-tailed Student's t-test for non-paired data was used to compare MTR histogram–derived measures between control subjects and the entire cohort of patients with MS and between MS patients with or without locomotor disability. Univariate correlations were performed using the Spearman Rank Correlation Coefficient. A one-way analysis of variance was used to compare MTR histogram–derived measures between patients with different degrees of disability. Post hoc comparisons were performed using the two-tailed Student's t-test for non-paired data.
Results
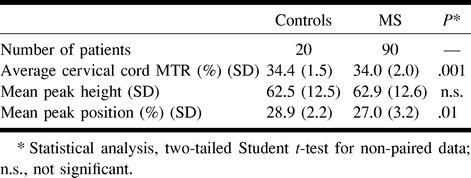
In Table 1, the cervical cord MTR histogram metrics derived from axial, contiguous, 5-mm-thick slices obtained from control subjects and the entire cohort of patients with MS are reported. In Figure 3, the corresponding MTR histograms from the two populations are shown. MS patients had significantly lower average cervical cord MTRs and peak heights than did control subjects.
TABLE 1:
Cervical cord MTR histogram metrics from axial, 5-mm-thick slices in control subjects and in the entire MS cohort
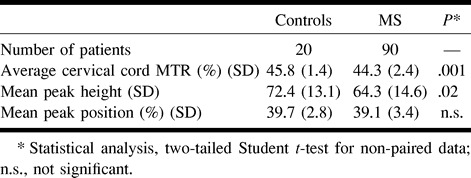
fig 3.
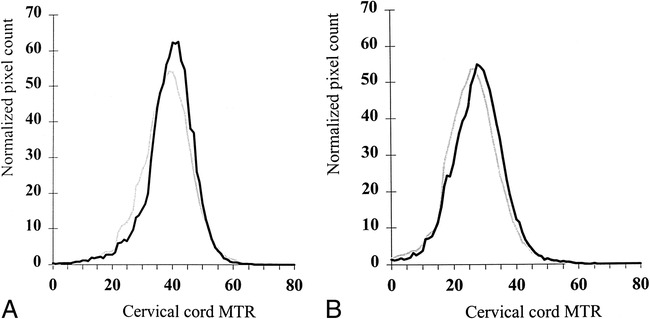
MTR histograms of cervical cord from controls (black line) and entire MS cohort (gray line). Graph A shows MTR histograms from axial, 5-mm-thick slices, graph B shows MTR histograms from sagittal, 3-mm-thick slices.
In Table 2, the cervical cord MTR histogram metrics derived from sagittal, 3-mm-thick slices obtained from control subjects and the entire cohort of patients with MS are reported. The corresponding MTR histograms from the two populations are shown in Figure 1. All of the MTR metrics derived from the sagittal set of slices were lower than those from the axial set. The three corresponding metrics, however, were highly correlated (r values were always higher than .9). MS patients had significantly lower average cervical cord MTRs and peak location than did control subjects.
TABLE 2:
Cervical cord MTR histogram metrics from sagittal, 3-mm-thick slices in control subjects and in the entire MS cohort
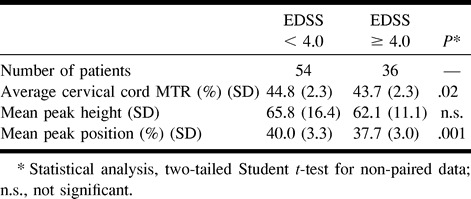
In Table 3, the cervical cord MTR histogram metrics obtained using axial, 5-mm-thick slices from MS patients with and without locomotor disability are reported. Patients with locomotor disability had lower average cord MTRs and peak locations than did those without a locomotor disability. Similar results were found when using the sagittal set of slices (data not shown).
TABLE 3:
Cervical cord MTR histogram metrics from axial, 5-mm-thick slices in MS patients with different degrees of locomotor disability
Discussion
Cervical cord MTR histogram analysis might be useful in the assessment of patients with MS for three reasons. First, MS commonly affects the spinal cord (9–16), and it is likely that such damage contributes to the clinical manifestations of the disease. Second, measures of damage based on MTR histograms encompass both the macro- and microscopic aspects of MS pathology. Third, reduced MTR values are correlated strictly with severe axonal loss and demyelination both in human (29–31) and animal (32–35) studies.
In this study, we used two different MT acquisition schemes and demonstrated that it is feasible to obtain MTR histograms from the cervical cord tissue of patients with MS by using both of them. We also showed that the amount and severity of MS pathology within the cervical cord are relevant factors in the clinical manifestations of the disease. We found that the average MTR of the cervical cord tissue from patients with MS is significantly different from that of healthy controls. This confirms the results of a previous preliminary study in which MTRs were measured in relatively small and variable regions of interest in the cervical cord (36). Also, the cervical cord MTR histogram measures were lower in patients with locomotor disability. An EDSS score greater than or equal to 4.0 indicates that a patient has a limited ability to walk, whereas lower scores are not related to disability but to neurologic impairment in one or more of the EDSS functional systems (24).
Patients with MS are likely to have smaller cords than healthy volunteers because of wallerian degeneration of long tract fibers (37, 38). In the presence of marked cord atrophy, it is more likely that pixels at the edge of the cord would include a contribution from CSF in the MTR histograms. This would result inevitably in a reduction in all MTR histogram–derived measures. We believe, however, that our cervical cord MTR measures were not influenced a great deal by the presence of cord atrophy in the MS group for two reasons. First, pixels with an MTR lower than 10% were excluded, removing those pixels most severely affected by partial volume averaging with cerebrospinal fluid. Second, the numbers of pixels included in the MTR histograms of control subjects and the entire cohort of MS patients were not significantly different (data not shown).
Although highly correlated, the MTR histogram metrics were lower when derived from sagittal,3-mm-thick slices than when derived from axial,5-mm-thick slices. There are four possible explanations, which are not mutually exclusive, for this finding. First, we segmented only the two central slices of the sagittal set to minimize partial volume averaging from the cerebrospinal fluid. This was not the case for the other approach based on the use of axial slices in which the MTR characteristics of the entire cervical cord tissue were assessed. Second, partial volume averaging from the cerebrospinal fluid, although minimized by the limited number of slices used for the sagittal imaging, is likely to remain more relevant when using sagittal slices than when using axial slices. Third, owing to specific absorption rate considerations, the number of sagittal slices was limited to 17 instead of the 20 acquired for the axial set. Therefore, a smaller number of MT pulses was transmitted during the same TR and, as a consequence, the resulting average MT power was lower for the sagittal set. This necessarily led to a different amount of signal suppression for the axial images obtained after the application of the MT pulse. Fourth, while an interslice gap was employed for the sagittal imaging, axial slices were contiguous. This resulted in an additional MT effect in the axial set of images.
Owing to the shape of the cervical cord, MTR histograms from axial imaging have the advantage over those obtained from sagittal images, because they enable assessment of the entire cervical cord to be performed. This is important for MS patients in whom it might be difficult to detect macroscopic lesions in the cervical cord when using conventional MR scanning (16) but in whom it is relevant to measure more subtle changes in the NAWM. Although the different MTR histogram–derived measures used are highly correlated, we believe that average MTR is the figure that better describes the overall disease burden in the cervical cord, because it is sensitive to the amount and severity of the changes in both focal MS lesions and in the NAWM. Focal MS lesions are expected to decrease the peak height and increase the number of pixels with low MTR values without greatly affecting the peak position. Mild, but more widespread changes to the NAWM would cause a larger reduction in the peak height, accompanied by a broadening of the peak at its left side, because more of the tissue is affected, but with little or no increase at very low MTR. In an extreme case, in which most of the white matter is affected diffusely, it would be possible also for the peak position to move to the left, because little tissue would remain at a truly normal MTR.
Conclusion
This study shows that it is feasible to obtain reliable measurements from MTR histograms of the cervical cord from MS patients by using different acquisition schemes. Measures derived from MTR histogram analysis of the cervical cord from patients with MS were significantly lower than those of control subjects and, within the MS cohort, they were lower in patients with locomotor disability than in those without disability. This suggests that the assessment of MS cervical cord damage, using techniques that provide information with specificity to the more destructive aspects of the MS pathology, may lead to a better understanding of the clinical manifestations of the disease and may have a role in monitoring treatment response.
Footnotes
Giuseppe Iannucci is supported by a grant from the Neurology School of the University of Chieti.
Address reprint requests to Massimo Filippi, MD, Neuroimaging Research Unit, Department of Neuroscience, Scientific Institute Ospedale San Raffaele, Via Olgettina, 60, 20132 Milan, Italy.
References
- 1.Adams CMW, Pathology of multiple sclerosis: progression of the lesion. Br Med Bull 1977;33:15-20 [DOI] [PubMed] [Google Scholar]
- 2.Allen IV, McKeown SR, A histological, histochemical and biochemical study of the macroscopically normal white matter in multiple sclerosis. J Neurol Sci 1979;41:81-91 [DOI] [PubMed] [Google Scholar]
- 3.Arstila AU, Riekkinen P, Rinne UK, Laitinen L, Studies on the pathogenesis of multiple sclerosis. Participation of lysosomes on demyelination in the central nervous system white matter outside plaques. Eur Neurol 1973;9:1-20 [DOI] [PubMed] [Google Scholar]
- 4.Trapp BD, Peterson J, Ransohoff RM, Rudick R, Mörk S, Bö L, Axonal transection in the lesions of multiple sclerosis. N Eng J Med 1998;338:278-285 [DOI] [PubMed] [Google Scholar]
- 5.Kidd D, Barker GJ, Tofts PS, et al. The transverse magnetization decay characteristics of longstanding lesions and normal appearing white matter in multiple sclerosis. J Neurol 1997;244:125-130 [DOI] [PubMed] [Google Scholar]
- 6.Fu L, Matthews PM, De Stefano N, et al. Imaging axonal damage of normal-appearing white matter in multiple sclerosis. Brain 1998;121:103-113 [DOI] [PubMed] [Google Scholar]
- 7.Filippi M, Iannucci G, Tortorella C, et al. Comparison of MS clinical phenotypes using conventional and magnetization transfer MRI. Neurology 1999;52:588-594 [DOI] [PubMed] [Google Scholar]
- 8.Ikuta F, Zimmerman HM, Distribution of plaques in seventy autopsy cases of multiple sclerosis in the United States. Neurology 1976;8:26-28 [DOI] [PubMed] [Google Scholar]
- 9.Hittmair K, Mallek R, Prayer D, et al. Spinal cord lesions in patients with multiple sclerosis: comparison of MR pulse sequences. AJNR Am J Neuroradiol 1996;17:1555-1565 [PMC free article] [PubMed] [Google Scholar]
- 10.Kidd D, Thorpe JW, Thompson AJ, et al. Spinal cord MRI using multi-array coils and fast spin echo. II. Findings in multiple sclerosis. Neurology 1993;43:2632-2637 [DOI] [PubMed] [Google Scholar]
- 11.Tartaglino LM, Friedman DP, Flanders AE, et al. Multiple sclerosis in the spinal cord: MR appearance and correlation with clinical parameters. Radiology 1995;195:725-732 [DOI] [PubMed] [Google Scholar]
- 12.Lycklama à Nijeholt GJ, Barkhof F, Scheltens P, et al. MR of the spinal cord in multiple sclerosis: relation to clinical subtype and disability. AJNR Am J Neuroradiol 1997;18:1041-1048 [PMC free article] [PubMed] [Google Scholar]
- 13.Stevenson VL, Moseley IF, Phatouros CC, et al. Improved imaging of the spinal cord in multiple sclerosis using three-dimensional fast spin echo. Neuroradiology 1998;40:416-419 [DOI] [PubMed] [Google Scholar]
- 14.Lycklama à Nijeholt GJ, Castelijns JA, Weerts J, et al. Sagittal MR of multiple sclerosis in the spinal cord: fast versus conventional spin-echo imaging. AJNR Am J Neuroradiol 1998;19: 355-360 [PMC free article] [PubMed] [Google Scholar]
- 15.Lycklama à Nijeholt GJ, van Walderveen MAA, Castelijns JA, et al. Brain and spinal cord abnormalities in multiple sclerosis. Correlation between MRI parameters, clinical subtypes and symptoms. Brain 1998;121:687-697 [DOI] [PubMed] [Google Scholar]
- 16.Rocca MA, Mastronardo G, Horsfield MA, et al. Comparison of three MR sequences for the detection of cervical cord lesions in multiple sclerosis. AJNR Am J Neuroradiol 1999; (in press) [PMC free article] [PubMed]
- 17.Filippi M, The role of non-conventional magnetic resonance techniques in monitoring the evolution of multiple sclerosis. J Neurol Neurosurg Psychiatry 1998;64 (Supp:1):52-58 [PubMed] [Google Scholar]
- 18.van Buchem MA, McGowan JC, Kolson DL, Kolson DL, Polansky M, Grossman RI, Quantitative volumetric magnetization transfer analysis in multiple sclerosis: estimation of macroscopic and microscopic disease burden. Magn Reson Med 1996;36:632-636 [DOI] [PubMed] [Google Scholar]
- 19.Grossman RI, Magnetization transfer in multiple sclerosis. Ann Neurol 1994;36:S97-S99 [DOI] [PubMed] [Google Scholar]
- 20.Gass A, Barker GJ, Kidd D, et al. Correlation of magnetization transfer ratio with disability in multiple sclerosis. Ann Neurol 1994;36:62-67 [DOI] [PubMed] [Google Scholar]
- 21.Rovaris M, Filippi M, Falautano M, et al. Relation between MR abnormalities and patterns of cognitive impairment in multiple sclerosis. Neurology 1998;50:1601-1608 [DOI] [PubMed] [Google Scholar]
- 22.van Buchem MA, Grossman RI, Armstrong C, et al. Correlation of volumetric magnetization transfer imaging with clinical data in MS. Neurology 1998;50:1609-1617 [DOI] [PubMed] [Google Scholar]
- 23.Phillips MD, Grossman RI, Miki Y, et al. Comparison of T2 lesion volume and magnetization transfer ratio histogram analysis and of atrophy and measure of lesion burden in patients with multiple sclerosis. AJNR Am J Neuroradiol 1998;19:1055-1060 [PMC free article] [PubMed] [Google Scholar]
- 24.Kurtzke JF, Rating neurological impairment in multiple sclerosis: an expanded disability status scale (EDSS). Neurology 1983;33:1444-1452 [DOI] [PubMed] [Google Scholar]
- 25.Lublin FD, Reingold SC, the National Multiple Sclerosis Society (USA) Advisory Committee on Clinical Trials of New Agents in Multiple Sclerosis. Defining the clinical course of multiple sclerosis: results of an international survey. Neurology 1996;46:907-911 [DOI] [PubMed] [Google Scholar]
- 26.Studholme C, Hill DLG, Hawkes DJ, Automated 3D registration of MR and CT images of the head. Med Image Anal 1996;1:163-175 [DOI] [PubMed] [Google Scholar]
- 27.Studholme C, Hill DLG, Hawkes DJ, Automated 3D registration of MR and PET brain images by multi-resolution optimisation of voxel similarity measures. Med Physics 1997;24:25-35 [DOI] [PubMed] [Google Scholar]
- 28.Rovaris M, Filippi M, Calori G, et al. Intra-observer reproducibility in measuring new putative markers of demyelination and axonal loss in multiple sclerosis: a comparison with conventional T2-weighted images. J Neurol 1997;244:266-270 [DOI] [PubMed] [Google Scholar]
- 29.Dousset V, Armand JP, Lacost D, et al. Magnetization transfer study of HIV encephalitis and progressive multifocal leukoencephalopathy. AJNR Am J Neuroradiol 1997;18:895-901 [PMC free article] [PubMed] [Google Scholar]
- 30.Silver NC, Barker GJ, MacManus DG, et al. Decreased magnetization transfer ratio due to demyelination: a case of central pontine myelinolysis. J Neurol Neurosurg Psychiatry 1996;61:208-209 [DOI] [PMC free article] [PubMed] [Google Scholar]
- 31.van Waesberghe JHTM, van Walderveen MAA, de Groot C, et al. Postmortem correlation between axonal loss, MTR, and hypointensity on T1 SE in MS. Proceedings of the International Society for Magnetic Resonance in Medicine 1998;2:1334 [Google Scholar]
- 32.Dousset V, Grossman RI, Ramer KN, et al. Experimental allergic encephalomyelitis and multiple sclerosis: lesion characterization with magnetization transfer imaging. Radiology 1992;182:483-491 [DOI] [PubMed] [Google Scholar]
- 33.Lexa FJ, Grossman RI, Rosenquist AC, MR of Wallerian degeneration in the feline visual system: characterization by magnetization transfer rate with histopathologic correlation. AJNR Am J Neuroradiol 1994;15:201-212 [PMC free article] [PubMed] [Google Scholar]
- 34.Dousset V, Brochet B, Vital A, et al. Lysolecithin-induced demyelination in primates: preliminary in vivo study with MR and magnetization transfer. AJNR Am J Neuroradiol 1995;16:225-231 [PMC free article] [PubMed] [Google Scholar]
- 35.Kimura H, Meaney DF, McGowan JC, et al. Magnetization transfer imaging of diffuse axonal injury following experimental brain injury in the pig: characterization by magnetization transfer ratio with histopathologic correlation. J Comp Assist Tomogr 1996;20:540-546 [DOI] [PubMed] [Google Scholar]
- 36.Silver NC, Barker GJ, Losseff NA, et al. Magnetisation transfer ratio measurement in the cervical spinal cord: a preliminary study in multiple sclerosis. Neuroradiology 1997;39:441-445 [DOI] [PubMed] [Google Scholar]
- 37.Filippi M, Campi A, Colombo B, et al. A spinal cord MRI study of benign and secondary progressive multiple sclerosis. J Neurol 1996;243:502-505 [DOI] [PubMed] [Google Scholar]
- 38.Losseff NA, Webb SL, O'Riordan J, et al. Spinal cord atrophy and disability in multiple sclerosis. Brain 1996;119:701-708 [DOI] [PubMed] [Google Scholar]


