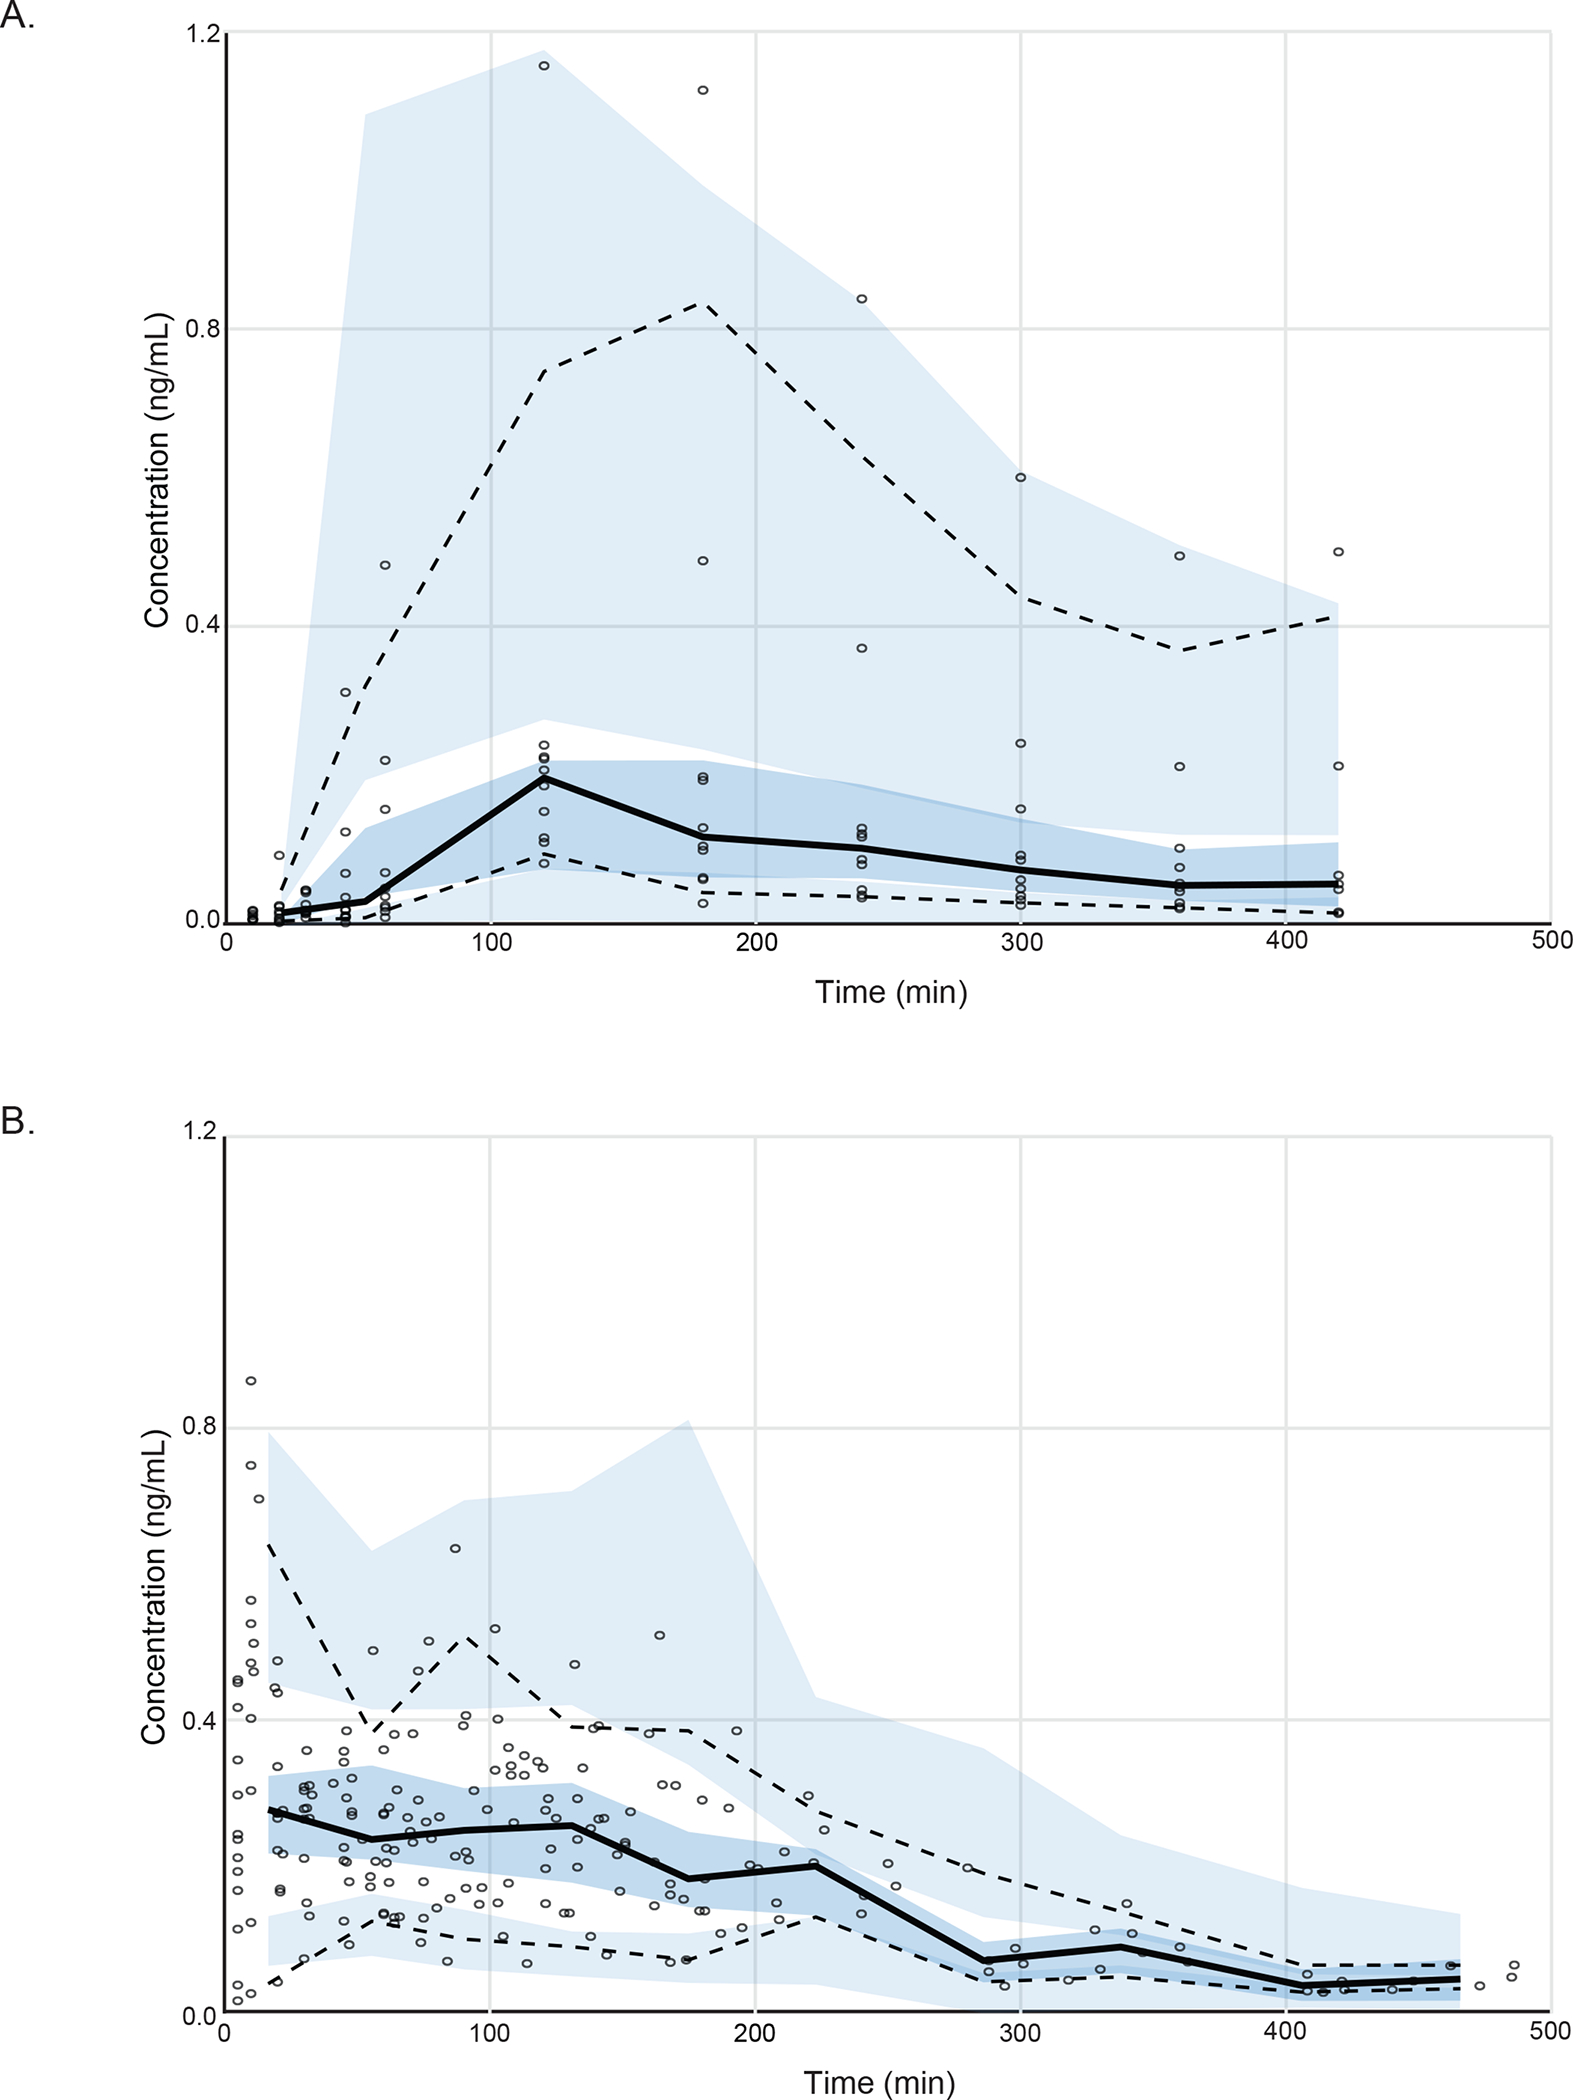
Fig. 2.

Visual predictive check (VPC) plots. Dexmedetomidine plasma concentration of (A) our oral study group (n=10) and (B) pooled intravenous study group (n=13). Solid black line indicates 50 percentiles and dashed black lines indicate 2.5 and 97.5 percentiles of observation. Shaded area indicates 95% prediction interval. The VPC plot confirms the adequacy of model predictions, showing no apparent deviations between model and data. The 95% confidence interval and median for observed data lies within the predicted intervals obtained by simulation.
