

Abstract
The present study investigated whether oxidative stress and Ca2+/calmodulin-dependent protein kinase II (CaMKII) activity are involved in the trigger of the Anrep effect.
Methods and Results:
LV pressure-volume (PV) analyses of isolated, preload controlled working hearts were performed at two afterload levels (60 and 100 mmHg) in C57BL/6N (WT) and CaMKII-double knockout mice (DKOCaMKII). In snap-frozen WT hearts, force-pCa relationship, H2O2 generation, CaMKII oxidation and phosphorylation of myofilament and Ca2+ handling proteins were assessed. Acutely raised afterload showed significantly increased wall stress, H2O2 generation and LV contractility in the PV diagram with initial decrease and recovery of stroke volume, whereas end-diastolic pressure, -volume and heart rate remained constant. Afterload induced increase in LV contractility was blunted in DKOCaMKII-hearts. Force development of single WT cardiomyocytes was greater with elevated afterload at submaximal Ca2+ concentration and associated with increases of CaMKII oxidation and phosphorylation of cardiac-myosin binding protein-C, myosin light chain and Ca2+ handling proteins.
Conclusion:
CaMKII activity is involved in the regulation of the Anrep effect and associates with stimulation of oxidative stress, presumably starting a cascade of CaMKII oxidation with downstream phosphorylation of myofilament and Ca2+ handling proteins. These mechanisms improve LV inotropy and preserve stroke volume within few seconds.
Keywords: Anrep effect, CaMKII, Ca2+ handling proteins, constant preload, DKOCaMKII mice, end-systolic elastance (Ees), elastance-time curve, Gregg effect, homeometric autoregulation, isolated murine working heart, LV contractility, myofilament phosphorylation, oxidative stress, cMyBP-C, cMLC2, stroke volume, slow force response (SFR), titin
Introduction
Changes in muscle length and load allow the heart to change its ventricular filling and modulate contraction and ejection. Increases in end-diastolic volume (EDV) lengthens the myocardium and initiates muscle length-dependent activation (with increased cardiomyocyte calcium (Ca2+) -sensitivity), referred to as the Frank-Starling Law (heterometric autoregulation) (Patterson & Starling, 1914), followed by a delayed increase in contractility over minutes designated as slow force response (SFR) (Parmley & Chuck, 1973). The Anrep effect, also termed homeometric autoregulation (Sarnoff et al., 1960), adjusts left ventricular (LV) contractility to enhanced afterload at a constant preload and heart rate (HR), and is presumed to be mediated by the intrinsic inotropic capabilities of the heart (von Anrep, 1912; Sarnoff et al., 1960). The term homeometric autoregulation defined by Sarnoff refers to the steady state conditions of his experiments on acutely raised afterload. However, several of his studies showed a small and short-lived preload stretch which reversed within 10–12 s. This “transient stretch” was the argument for many authors later to equate the Anrep effect with the SFR (Alvarez et al., 1999; Dowrick et al., 2019), although Sarnoff did not consider this stretch per se essential for triggering the Anrep effect (Sarnoff et al., 1960).
The mechanistic subcellular background of SFR includes increased intracellular Ca2+ transient either activated by the non-specific stretch-activated ion channels (SACs) and/or by the stretch-activated G-protein coupled angiotensin (ATR) and endothelin receptor (ETR), working both via the Na+/H+ and Na+/Ca2+ exchanger (Calaghan & White, 2004; Dowrick et al., 2019). This is considered as a valid mechanism for the Anrep effect (Alvarez et al., 1999). If the Anrep effect, however, can be triggered without stretch, its subcellular mechanism then would differ from the latter ones, turning the view in a different direction. Therefore, we focused on the role of reactive oxygen species (ROS) in myocytes under increased workload (Nickel et al., 2015), which can stimulate Ca2+/calmodulin-dependent protein kinase-II (CaMKII) activity (Erickson et al., 2008). CaMKII acts as a sensor of cellular ROS (Erickson et al., 2008) and was shown to be a key mediator of the mechano-chemo-transduction pathways converting mechanical afterload to Ca2+ handling in a single cell model (Jian et al., 2014). In the course of excitation-contraction coupling (ECC), CaMKII regulates myofilament and Ca2+ handling proteins’ phosphorylation (Barefield & Sadayappan, 2010; Hamdani et al., 2013c). Furthermore, CaMKII is an important mediator of enhanced contraction and accelerated relaxation observed during the Bowditch Effect via phosphorylation of cardiac myosin-binding protein C (cMyBP-C) and cardiac troponin I (cTnI) (Tong et al., 2015). Therefore, the aim of our study was to investigate the involvement of CaMKII activity to the Anrep effect and to identify the time course of the phenomenon on the pressure-volume curves. Hence, we used preload controlled, isolated working mice hearts ex vivo with continuous registration of LV pressure and volume and snap-frozen tissue for biochemical analyses.
Methods
Ethical Approval
All studies involving animals were approved by the animal ethics committee of the University of the Saarland (No. 0903–2007) and conformed with the guidelines stated in the Care and Use of Laboratory Animals published by the US National Institutes of Health (Eighth edition, revised 2011).
Fourteen healthy adult human volunteers were included for echocardiographic assessment of afterload dependent contractility with approval by the institutional medical ethics committee of the University of Lübeck, Germany (No. 16–011) with informed consent of participants. The study conformed to the standards set by the latest version of the Declaration of Helsinki. The study was registered with Clinical Trials.gov. (NCT02751853)
Animals
C57BL/6N mice (WT, n=52, Charles River laboratories, Sulzfeld, Germany) and Ca2+/CaMKII double-knockout mice (DKOCaMKII) (n=8) and corresponding littermates (WL, n=7, both delivered by Johannes Backs and Michael Kreusser, Institute of Experimental Cardiology, Heidelberg, Germany) were used for the experiments (Kreusser et al., 2014).
Working heart preparation
Mice were heparinized with 100 IU heparin 15 min prior to being sacrificed by i.p. administration of pentobarbital-sodium (60 mg/kg). The heart was excised and placed in ice-cold St. Thomas-Hospital solution (cardioplegia) (Reil et al., 2013). After the removal of pericardium, lung and trachea, the aorta was cannulated (18-G metal cannula; 1.5 cm of length; 0.95 mm inner diameter; 1.30 mm outer diameter) for Langendorff retrograde perfusion (60 mmHg perfusion pressure) with Krebs-Henseleit buffer (in mM: 118.5 NaCl, 25 NaHCO3, 4.7 KCl, 1.2 MgSO4, 1.2 KH2PO4, 2.5 CaCl2, and 11.1 glucose; 95% O2, 5% CO2; pH 7.4) in a working heart apparatus (IH-SR Perfusion system, type 844/1; Hugo Sachs Elektronik, Harvard Apparatus GmbH, March-Hugstetten, Germany). Following establishment of coronary perfusion in the Langendorff mode, “working heart” preparation was established by cannulating the left atrium through the pulmonary vein (16-G steel cannula; 1.5 cm of length; 1.14 mm inner diameter; 1.52 mm outer diameter) sewed in by a tobacco pouch suture (Ethicon Prolene 7.0). This cannula was connected to a preload column, which was water-jacketed and heated to 38°C, resulting in a myocardial temperature of 37°C when the heart was operating in the working mode. Two platinum pacing electrodes embedded in polyester resin were attached to the right atrium to pace the hearts at 400 bpm (Reil et al., 2013). 1 ml of air was injected into the windkessel chamber.
Left ventricular (LV) systolic and diastolic function was recorded via a high fidelity 1.4-Fr pressure-conductance catheter (SPR-835; Millar Instruments, Houston, TX, USA) inserted into the LV cavity through a small puncture in the apex by a 22 1/4 gauge needle. The end-systolic pressure-volume relationship (ESPVR) and its slope Ees (end-systolic ventricular elastance) were assessed by a sudden increase in afterload pressure from 60 to 100 mmHg while preload (10 mmHg) and heart rate (400 bpm) were kept constant. The end-diastolic PV relationship (EDPVR) was assessed by sudden decrease of preload pressure from 15 to 0 mmHg due to evacuating the preload column with a 50 ml syringe at a constant afterload of 60 mmHg and a heart rate of ca. 400 bpm. Cardiac inflow and aortic flow were recorded continuously by inline ultrasonic transit time probes, and these measurements were used to calibrate volume measurement of the conductance catheter signal gain. Parallel conductance (conductance signal offset) was determined by the saline dilution method by injecting a 5 μl bolus of hypertonic (5%) saline into the left atrial cannula, causing a transient change in the conductivity of Krebs-Henseleit buffer in the LV (Reil et al., 2013). In a subgroup of six WT hearts streptomycin (80μM) was added to the KHB-solution to estimate its influence on Anrep effect and preload stretch.
Data analyses of pressure-volume (PV) measurements
LV pressure was plotted as a function of instantaneous LV volume (PV loops). To obtain the end-systolic pressure-volume (ESPVR) relation ventricles were made to eject against increasing levels of afterload (from initial ~ 60 to about max. 100 mmHg, i.e. “partial aortic occlusion”). The end-systolic pressure-volume points (i.e. the upper left corners of the loops with coordinates end-systolic volume (ESV) and end-systolic pressure (ESP)) were connected by a straight line and fit the equation: ESP = Ees (ESV - V0). V0 (μl) is volume axis intercept and Ees is the slope of ESPVR and indicates LV end-systolic elastance (mmHg/μl). When defining contractility both parameters of ESPVR, Ees and V0, have to be considered. Calculation of the end-systolic volume (μl) at a predefined end-systolic pressure like 100 mmHg fulfills these criteria. Thus ESV100mmHg (ESV100) integrates Ees and V0. ESPVR was also calculated by single-beat analysis according to Steendijk (Ten Brinke et al., 2010).
Assessment of elastance-time diagram
Development of LV contractility was determined from PV loop data using the time- varying elastance technique. At each instant of time the instantaneous elastance (E(t)) can be assessed connecting V0 with the specific point of the loop: thus E(t) = P(t) / (V(t) – V0). Plotting instantaneous elastance versus time, elastance-time curves are obtained for each beat (Suga, 1990). The peak of this curve is the maximal elastance (Emax). Generally, increased contractile function is characterized by higher Emax values indicating increased maximal stiffness and/or increasing time to Emax indicating a prolonged systolic period, thus visualizing LV mode of action (Borlaug & Kass, 2009).
Data analyses of diastolic parameters
When ventricles were made to eject against falling levels of preload (“evacuating of the preload column”) EDPVR was assessed. EDPVR coordinates formed a curve (lower boundary of PV loops) fitting the equation: Ped = Po + k × eβ × EDV, where β is the chamber stiffness coefficient, k is the fitting constant and Po is the pressure offset. The slope of EDPVR describes LV diastolic compliance.
Echocardiographic PV loop reconstruction in volunteers
PV loops were reconstructed in healthy volunteers (n=14) by using echocardiography for deriving volume indices and arm-cuff blood pressure measurements to estimate LV pressures. Data were obtained at baseline conditions and during mild sustained isometric hand-grip exercise (15–20 kg) for 30 s in all volunteers. This level of exercise represents 15% of the predetermined maximal voluntary capacity (MVC) of the subjects and was the lowest load to markedly increased blood pressure (Martin et al., 1974; Mark et al., 1985). The first 30 s during sustained handgrip exercise are dominated by vagal tone thereby excluding sympathetic influence according to (Martin et al., 1974; Mark et al., 1985). Transthoracic echocardiography was performed on a Vivid E9 ultrasound system (General Electrics, Frankfurt, Germany). Non-invasive blood pressure measurements by arm-cuff were conducted simultaneously to the echocardiographic recordings of the LV outflow tract velocity time integral (LVOT-VTI) signal at rest and during handgrip exercise. These blood pressure measurements were used to reconstruct PV loops.
The investigation included regular 2D echocardiography and Doppler imaging for assessing LV volume according to the guidelines of the American Society of Echocardiography (Lang et al., 2015). The following parameters were calculated as follows: stroke volume (SV) = 3.14 × LVOT-VTI × (dLVOT / 2); cardiac output (CO) = HR × SV. LV ejection fraction (EF) was measured according to Simpson in the four and two chamber view. The end-diastolic volume (EDV) was calculated by the formula: EDV = SV / EF. The ventricular pre-ejection time and systolic period were measured by assessing the time between the R-wave of ECG at the begin as well as at the end of the pulsed-waved Doppler LVOT-VTI signal.
Echocardiographic derived single-beat PV analysis
Afterload parameters
Effective arterial elastance (Ea) is a measure of both arterial mean and pulsatile load, providing an integrated parameter that reflects the net impact of arterial vascular load on the heart (Kelly et al., 1992). Ea is calculated as follows: Ea = end-systolic pressure / SV (Kelly et al., 1992).
Systolic parameters
End-systolic elastance (Ees) can be derived by single-beat echocardiography analysis. According to (Chen et al., 2001) single-beat Ees can be assessed by a complex algorithm containing systolic and diastolic blood pressure (BP), SV, EF, and pre-ejection and total systolic ejection time intervals from LV outflow pulsed-wave Doppler. To assess cardiac contractility, peak power index as an additional load independent parameter of systolic function was determined. The peak power index was measured by the product of peak volumetric ejection rate from LV outflow Doppler and systolic blood pressure divided by EDV (Borlaug et al., 2009).
Tissue collection
At each afterload condition myocardial tissue was collected from at least 5 (max 10) hearts.
RNA isolation, cDNA synthesis and gene expression analysis
For total RNA isolation from murine tissue, the TRIzol® (Life Technologies GmbH, Darmstadt, Germany) method was used followed by cDNA synthesis with the High Capacity Kit (Life Technologies GmbH). 500 μl of TRIzol (Invitrogen) reagent were added to the LV heart tissues and homogenized. Chloroform was added to tissue and centrifuged at 12 000g for 5 min at 4°C and followed by Isopropanol. After centrifugation pellets were washed with 75% ethanol and the samples were incubated at 55°C for 20 min. For qRT-PCR cDNA was synthetized RevertAid First strand cDNA synthesis kit (ThermoFisher) according to the manufacturès protocol. qRT-PCR data were analyzed with GoTaq qPCR Master Mix (Promega), In brief, serial dilutions were prepared from cDNA and used as template in qRT-PCR reaction. Forward and Reverse primers (Table 1) have been used, the final concentration was 0.2 μM. Data was analyzed using 2−ϪϪct method. Graph Pad Prism and R software were used to represent the data (Table 1 and Figure 9).
Table 1:
Gene names, symbol, forward and reverse primer sequences and of primers used for the gene Expression
| Gene symbol | Forward Primer | Reverse Primer |
|---|---|---|
| Hdac4 | ACA AGGAGA AGGGCA AAGAG |
GTGTCTTCCCATACCAGTAGC |
| Creb1 | CATCTGCTCCCACTGTAACC |
GAGACTGGATAACTGATGGCTG |
| Nfatc1 | TGGGAG ATGGAAGCAAAGAC |
ATAGAA ACTGACTTGGACGGG |
| Mapk1 | TCAGTTTGTCCCCTTCCATTG |
GCTGCCACTTTATTTCATGTCC |
| Pln | CTC CCTACTTTTGCCTTCCTG |
TGG AGATTCTGACGTGCT TG |
Figure 9: Gene expression of proteins phosphorylated by CaMKII.

Scheme of intracellular targets of CaMKII signaling (A). ATF-1: activating transcription factor-1; cMLC2: cardiac myosin light chain 2; cMyBP-C: cardiac myosin binding protein-C; cTnI: cardiac troponin I; CREB-1: cAMP-response element binding protein 1; DRP1: dynamin related protein 1; H3: histone 3; HDAC4: histone deacetylase 4; HSF1: heat shock factor 1; MAPK1: mitogen-activated protein kinase 1; NFAT: nuclear factor of activated T-cells; PLB: phospholamban; RyR2: ryanodine receptor 2; SERCA2a: sarcoplasmic/endoplasmic reticulum Ca2+ ATPase 2a; SRF: serum response factor. Heatmap of gene expression (B) and relative gene expression of CREB1 (C), NFATC1 (NFAT, cytoplasmic 1; D), HDAC4 (E), phospholamban (PLN; F), and MAPK1 (G) are shown in steady state groups (SS1, SS2 and SS3). **p<0.01 vs. SS1; Data are shown as mean±SD; p-value in graphs represents ANOVA test.
Protein analysis
Homogenized myocardial samples were analysed by western blots to measure site-specific and total phosphorylation of titin or using 15% SDS-PAGE and western blot for the phosphorylation of small proteins(Hamdani et al. 2013b) Then phospho-protein signals were indexed to PVDF staining for titin or GAPDH and actin for small proteins to correct for the sample loading.
Activity tests for myocardial protein kinases
CaMKII activity (mU/ml), MLCK (nM/min/mg protein), PKA activity (ng ml−1), and PKC (μg/μl) were measured using a nonradioactive kinase activity-assay kit. PKG activity (pmol/min/mg protein) was measured using radiolabeled ATP.
Hydrogen peroxide and total glutathione in myocardial homogenates analysis
Total glutathione (GSH) in myocardial homogenates were determined in triplicate with a colorimetric glutathione assay kit (CS0260, Sigma Aldrich) to assess antioxidant levels. Stable hydrogen peroxide (H2O2) accumulation was also assessed in myocardial homogenates and subsequently in myocardial cytosol and mitochondria fractions using a colorimetric assay (Sigma Aldrich) (average of two runs with duplicates n=8) using a subcellular protein fractionation kit (78840; Thermo Fisher Scientific) according to manufacturer’s instructions.
Cardiomyocyte force measurements and biochemical analysis
Force measurements were performed in isolated single skinned cardiomyocytes as described previously (Hamdani et al., 2013a). To limit unwanted methodological artifacts (e.g. caused by snap-freezing tissue procedure and cellular swelling due to membrane-permeabilization), cardiomyocytes with ±20% variation in cross-sectional area from the start to the end of experimental protocol were excluded from analysis.
Samples (n=16–24 cells/steady state from 3–5 hearts/steady state) were thawed in relaxing solution (in mM: 1 free Mg2+, 100 KCl, 2 EGTA, 4 Mg-ATP, and 10 imidazole; pH 7.0), mechanically disrupted and incubated for 5 min in relaxing solution supplemented with 0.5% Triton X-100 to remove membrane structures. The cell suspension was washed twice in relaxing solution, single cardiomyocytes were selected under an inverted microscope (Zeiss Axiovert 135, 40x objective; Carl Zeiss AG, Oberkochen, Germany) and attached with silicone adhesive between a force transducer and a piezoelectric motor as part of a “Permeabilized Myocyte Test System” (1600A, with force transducer 403A; Aurora Scientific, Aurora, Ontario, Canada).
Cardiomyocyte passive force (Fpassive) was measured within a sarcomere length (SL) range between 1.8 and 2.4 μm in relaxing buffer before and after incubations with reduced glutathione (GSH) 30min (10mM; Sigma-Aldrich) for the experiments after GSH incubations (n=8–10 cells/steady state from 3 hearts/steady state) were used. Cardiomyocyte active force was measure at a SL of 2.2 μm. On transfer of the cardiomyocyte from relaxing to maximally activating solution (pCa 4.5, with pCa being defined as –log10[Ca2+]), isometric force started to develop. During Ca2+-induced contractions a release-restretch maneuver was applied in order to determine the maximal rate constant of force redevelopment (ktr,max). Upon steady force of maximal Ca2+-evoked force development a release-restretch manoeuvre (shortening to 80% of the initial length of the cardiomyocyte for 20 ms) was performed by using the high-speed length controller. This intervention broke completely the actin-myosin cross-bridges, accordingly force dropped to zero. Subsequent force redevelopment was fitted to a single exponential to estimate ktr,max describing the actin-myosin turnover at saturating [Ca2+] (pCa 4.5). Cardiomyocytes were then exposed to a series of solutions with different pCa values ranging from 9.0 (relaxing) to 4.5 (maximal activation) to obtain the force-pCa relation. Force values were either related to myocyte cross-sectional area calculated from the diameter of the cells, assuming a circular shape, or normalized to maximum force at pCa 4.5. Normalized force-pCa relations were then fitted to a modified Hill equation (nHill (nH); the steepness of the sigmoidal force-pCa relationship), providing the Ca2+ sensitivity curve. Accordingly, pCa value for the half-maximal Ca2+-induced contraction indicated by pCa50 defines per se the Ca2+ sensitivity of force production.
Myocardial protein kinase activity assays
Ca2+/calmodulin-dependent protein kinase-II (CaMKII) activity
CaMKII activity (n=5–7 LV samples/steady state) was determined using a CycLex® CaMKII assay kit (CY-1173; MBL, Woburn, MA, USA) according to the manufacturer’s guidelines. Briefly, frozen tissues were homogenized in sample buffer containing 15% glycerol, 62.5 mM Tris (pH 6.8), 1% (w/v) SDS, protease inhibitor, and protein phosphatase inhibitor. Homogenates were centrifuged at 10,000 × g for 15 min at 4°C. The supernatant was removed and stored at −80°C. Protein samples were loaded onto microtiter wells (concentration, ~2.0 μg/well) coated with CaMKII specific substrate, syntide-2, along with kinase reaction buffer with or without Ca2+/calmodulin. To quantify CaMKII activity, a standard curve correlating the amount of active CaMKII and the level of phosphorylation of syntide-2 was constructed.
Myosin light chain kinase (MLCK) activity
MLCK activity was assessed in LV samples (n=6–7 samples/steady state) homogenized in a buffer containing 10 μl of diluted active MLCK (catalogue #M62–11G; SignalChem, Richmond, Canada), 5 μl of 0.2 mg/ml stock solution of substrate (catalogue #M89–54G; SignalChem), 2.5 μl of Ca2+/Calmodulin Solution II, 10x (catalogue #C02–39B; SignalChem), and 2.5 μl of distilled H2O, followed by 5 μl [γ−32P]ATP Assay Cocktail bringing the final volume up to 25 μl. The mixture was then incubated in a water bath for 15 min at 30°C. The reaction was terminated by spotting 20 μl of the reaction mixture onto individual pre-cut strips of phosphocellulose P-81 paper and sequentially washed in a 1% phosphoric acid solution. For quantification of MLCK activity, counts were taken in a Wallac 1409 Liquid 4 Scintillation Counter using universal scintillation cocktail (ICN). Specific activity of MLCK was expressed as nM of 32P incorporated into the substrate (in nM/min/mg).
Protein kinase A and C (PKA, PKC) activity
PKA and PKC activity was analyzed using non-radioactive kinase activity assay kit (Enzo Life Sciences, Farmingdale, NY, USA). LV samples (n=6–7 samples/steady state) were homogenized in cell lysis buffer (in mM: 20 MOPS, 50 β-glycerolphosphate, 50 sodium fluoride, 1 sodium vanadate, 5 EGTA, 2 EDTA, 1 DTT, 1 benzamidine, and 1 PMSF; 1% NP40; 10 μg/ml leupeptin and aprotinin, each). Supernatants were collected after centrifugation at 13,000 rpm for 30 min. Supernatants containing equal amounts of total protein (30 ng/μl protein aliquots were assayed according to manufacturer’s instructions) were added into the appropriate wells of the PKA or PKC substrate microliter plate. Kinase reaction was initiated by addition of ATP, and samples were subsequently incubated for 90 min at 30°C. Phosphorylated peptide substrates were recognized by phosphospecific substrate antibody. The phosphospecific antibody was subsequently bound by a peroxidase conjugated secondary antibody anti-rabbit IgG:HRP. The assay was developed with tetramethylbenzidine, and the intensity of the color was measured in a microplate reader at 450 nm. Results of triplicate determinations were averaged and specific activity of PKA was expressed as ng/ml and for PKC as μg/μl.
Protein kinase G (PKG) activity
To assess PKG activity tissue samples (n=6–7 LV samples/steady state) were homogenized in a buffer (in mM: 25 Tris (pH 7.4), 1 EDTA, 2 EGTA, and 5 DTT; 0.05% Triton X-100; protease inhibitor cocktail from Sigma-Aldrich, Munich, Germany), followed by centrifugation for 5 min. Supernatants containing equal amounts of total protein were analyzed for PKG activity. The reaction mixture contained (at final concentration): 40 mM Tris-HCl (pH 7.4), 20 mM magnesium acetate, 0.2 mM [γ−32P]ATP (500–1,000 cpm/pM; Amersham Pharmacia Biotech, Freiburg, Germany), 113 mg/mL heptapeptide (RKRSRAE), 3 mM cGMP (Promega, Madison, WI, USA) and a highly specific inhibitor of cAMP-dependent protein kinase (5–24, catalogue #116805; Calbiochem, San Diego, CA, USA). The reaction mixtures were incubated for 10 min at 30°C, followed by termination of the reaction by spotting 70 μl of the reaction mix onto Whatman P-81 filters, which were then soaked with 75 mM H3PO4 for 5 min and washed three times with 75 mM H3PO4 to remove any unbound [γ−32P]ATP. Filters were rinsed with 100% ethanol and air dried before quantification. For quantification of PKG activity, counts were taken in a Wallac 1409 Liquid 4 Scintillation Counter using universal scintillation cocktail (ICN). Specific activity of PKG was expressed as pM of 32P incorporated into the substrate (pM/min/mg protein).
Ca2+ handling protein and CaMKII analysis and its targets by Western immunoblotting
LV tissues were homogenized in 300 μL homogenization buffer (in mM: 5 EDTA, 300 sucrose, 30 potassium phosphate, 25 sodium fluoride, and 1 PMSF; complete protease inhibitors and phosphatase inhibitors from Roche, Germany). The homogenates were centrifuged at 16,300 × g for 30 min at 4°C. The supernatant-proteins were quantified by Lowry assay and separated (50 μg/lane) on an 15% and 10% polyacrylamide gel by SDS-PAGE and then transferred onto a nitrocellulose membrane (Schleicher & Schuell, Dassel, Germany). Membranes were blocked in Tris-buffered saline (TBS) containing 5% non-fat dry milk for 120 min at room temperature and incubated in primary antibodies against sarcoplasmic/endoplasmic reticulum Ca2+ ATPase 2a (Serca2A, catalogue #sc-8095; Santa Cruz Biotechnology, Dallas, TX, USA; 1:1000), phospholamban (PLB, catalogue #05–205; Merck Millipore, Burlington, MA, USA; 1:1,000), pSer-16 PLB (catalogue #07–052; Merck Millipore; 1:1,000), pthreonine (Thr)-17 PLB threonine (Thr)-17-P (catalogue #sc-17024-R; Santa Cruz; 1:1000), ryanodine receptor 2 (RyR2, ABR Affinity BioReagents, Golden, CO, USA; 1:500), pSer-2808 RyR2 (1:2000) and pSer-2814 RyR2 (1:1000) (both kind gifts from Dr. Xander Wehrens, Houston, TX, USA), CaMKII (ab22609; Abcam; 1:1000), CaMKII Met281/282 (GeneTex; 1:1,000) and mouse monoclonal GAPDH (cata logue #MAB374; Merck Millipore; 1:5000). For CaMKII targets we used pSer-103 SRF (Cell Signaling Technology; 1:1000), pSer-197 calcineurin (Badrilla.; 1:1000), pSer-467 HDAC4 (Cell Signaling Technology; 1:1000), pSer-10 histone (Sigma-Aldrich; 1:1,000), pSer-230 HSF1 (Enzo Life Sciences; 1:1000), pSer-616 DPR (Cell Signaling Technology; 1:1000), pSer-142 CREB1 (Sigma-Aldrich; 1:1000), pSer-63 ATF (Sigma-Aldrich; 1:1000) was measured by 15% SDS–PAGE and western blot.
Membranes were then incubated in their corresponding secondary antibodies for 60 min at room temperature: goat anti-rabbit (Sigma-Aldrich; 1:10000), goat anti-mouse (Bio-Rad Laboratories, Munich, Germany; 1:10000), and rabbit anti-goat (Bio-Rad Laboratories, Germany; 1:10000). Proteins were visualized by enhanced chemiluminescence (ECL) according to the manufactureŕs guidelines (Amersham Pharmacia Biotech). Autoradiographs were quantified by imaging densitometry and analyzed using ImageQuant™ Software (Image Quant, Molecular Dynamics, Krefeld, Germany) or Image J (National Institutes of Health, Bethesda, MD, USA). Data are presented in arbitrary units (a.u.) of intensity optical density.
Myofilament proteins phosphorylation by Western immunoblotting
Titin separation and phosphorylation analysis by Western immunolotting
Tissue samples (20 μg dry weight/lane) were separated on 1.8 % sodium dodecyl sulphate–polyacrylamide gel electrophoresis (SDS–PAGE) gels for titin SDS-PAGE was performed to separate titin as previously described (Hamdani et al., 2013c). LV tissue, samples (n=5 samples/steady state) were solubilized in 50 mM Tris-SDS buffer (pH 6.8) containing 8 μg/ml leupeptin and 10 μl/ml phosphatase inhibitor cocktail (catalogue #P2850; Sigma-Aldrich) or in modified Laemmli buffer (50 mM Tris-HCl, pH 6.8, 8 M urea, 2 M thiourea, 3% SDS (w/v), 0.03 % ServaBlue (w/v), 10% (v/v) glycerol, 75 mM DTT). Samples were heated for 3 min at 96°C and centrifuged. Gels were run at 4 mA constant current for 16 h. Thereafter WB was performed to measure site-specific and total phosphorylation of titin. Following SDS-PAGE, proteins were transferred to PVDF membranes (Immobilon-P 0.45 μm; Merck Millipore). Blots were pre-incubated with 3% bovine serum albumin in Tween Tris-buffered saline (TTBS; containing: 10 mM Tris-HCl (pH 7.6); 75 mM NaCl; 0.1% Tween; all from Sigma-Aldrich) for 1 h at room temperature. Blots were then incubated overnight at 4°C with the primary antibodies.
Anti-phospho Ser/Thr (ECM Biosciences LLC, Versailles, KY, USA; 1:500) was used to assess total titin phosphorylation. Phosphosite-specific anti-titin antibody was custom-made by Eurogentec (Seraing, Belgium) with position in N2Bus (N2B unique sequence) domain of mouse (Mus musculus) titin according to UniProtKB identifyer A2ASS6. Rabbit polyclonal affinity purified antibody anti-phospho-N2Bus (Ser-4043) against QELLS(PO3H2)KETLFP (1:100) was used. The amino acid sequences of mouse titin at Ser-4043 refers to human titin at Ser-4062.
After washing with TTBS, primary antibody binding was visualized using secondary horseradish peroxidase-labeled, goat anti-rabbit antibody (DakoCytomation, Glostrup, Denmark; 1:10000) and ECL (Amersham Biosciences). Western blot signals were visualized using the LAS-4000 Image Reader and analyzed with Multi Gauge V3.2 software (both from FUJIFILM Corp, Minato, Tokyo, Japan). Coomassie-based PVDF stains were saved for comparison of protein load. Finally, signals obtained from phospho-specific antibodies were normalized to signals obtained from PVDF stains referring to the entire protein amount transferred.
The phosphorylation state of cMyBP-C was determined as previously described (Hamdani et al., 2013a). Briefly, tissues were pulverized on liquid nitrogen and then suspended in 1 mL of ice-cold 10% trichloroacetic acid solution (TCA; dissolved in acetone containing 0.1% (w/v) DTT) in order to preserve endogenous phosphorylation. TCA-treated tissues were then homogenized in a DTT-containing (2% w/v) sample buffer. Following separation by SDS-PAGE (concentration, 10 μg/well) on 4–15% gradient gels (Criterion™ TGX™ gel, Bio-Rad), proteins were transferred to polyvinylidene fluoride (PVDF) membranes (Immobilon-P 0.45 μm; Merck Millipore). Phosphorylation of cMyBP-C was studied using antibodies against pSer-282 cMyBP-C (rabbit polyclonal antibody; Cell Signaling Technology, Danvers, MA, USA; 1:1000), pSer-23/24 cTnI (rabbit polyclonal antibody; Cell Signaling Technology, Danvers, MA, USA; 1:1000), pSer-19 cMLC (rabbit polyclonal antibody; Cell Signaling Technology, Danvers, MA, USA; 1:1000), and β-actin (clone KJ43A; Sigma-Aldrich; 1:1,000). Relative phosphorylation was determined by dividing the phospho signal by the β-actin protein signal.
Statistics
Measurement were performed in WT, DKOCaMKII and WL mice. Continuous variables are presented as mean ± standard deviation (SD). Changes in hemodynamic parameters in individual animals were analyzed with an ANOVA test for repeated measurements and a Tukey post-hoc test to correct for multiple comparisons. Changes in multiple-beat V0 and Ees calculations were analyzed with a two-tailed Student’s t-test. To compare hemodynamics of CaMKII-littermates (WL) and DKOCaMKII mice as well as to compare WT with streptomycin treated mice a two way ANOVA test with Tukey post-hoc test to correct for multiple comparisons were performed. To compare the respective groups (WL vs. DKOCaMKII ; WT vs. streptomycin treated mice) at different steady states, a Mann-Whitney test was performed or a two-tailed Student’s t-test, if the data were normally distributed. Single cell myocardial force analysis was assessed for statistically significant differences using one-way ANOVA and subsequent comparisons before and after treatment with GSH were performed with Bonferroni adjusted t-test and paired Student’s t-test. Molecular data were analyzed using a one-way ANOVA test with Tukey post-hoc test. Paired t-test was also performed to analyze afterload dependent changes of the echocardiographic parameters in healthy volunteers. Additionally, Pearson correlation was calculated between Ees and Ea as well as Ees and HR in healthy volunteers. P-values < 0.05 were considered to reflect statistically significant differences.
Results
The Anrep effect in human volunteers
Reconstructed PV loops from healthy volunteers were used to assess the Anrep effect in vivo (Fig.1 and Fig. 2). In response to 15% of maximal voluntary handgrip capacity (MVC) for 30s (15–20kg), volunteers demonstrated significant increases in systolic blood pressure (Fig. 2A–B) and effective arterial elastance (Ea) (Fig. 1E). These were coupled with enhanced cardiac systolic performance evident from a significant reduction in ESV100 (Fig. 1F) and significant increases in Ees (Fig. 1D) and PPI (Fig. 2E), which ultimately resulted in preserved stroke volume (SV, Fig. 1G) and higher stroke work (SW, Fig. 2F). These changes in systolic performance to maintain SV in response to increased afterload were virtually independent of increased preload or HR as no changes in EDV and E/é were observed from baseline (Fig. 2G, H) and only non-relevant increases in HR (82 vs. 83 beats/min) occurred in response to exercise (Fig. 2C). Interestingly, systolic ejection period was significantly prolonged (Fig. 1H). A monovariate linear regression analysis revealed significant correlations between afterload (Ea) and systolic function (Ees) (Fig. 1B), while HR and Ees were unrelated (Fig. 1C). The ESPVR (red vs. black dotted line) becomes steeper and shifts to the left as inotropy increases illustrating the Anrep effect graphically (Fig. 1A).
Figure 1: Analysis of contractility of the Anrep effect in humans.

Representative echocardiographic-derived pressure-volume (PV) loops and end-systolic PV relationships (ESPVR) of healthy volunteers at baseline (white) and after sustained handgrip exercise (red) are shown (A). Data are shown as mean±SD. End-systolic elastance (Ees) is correlated with either effective arterial elastance (Ea; B) or heart rate (C). Ees (D), Ea (E), end-systolic volume at 100 mmHg (ESV 100 mmHg; F), stroke volume (G) and ejection time (H). Open circles are shown at baseline (white) and at exercise (red). **p<0.01, ***p<0.001, ****p<0.0001 vs. baseline; n=14
Figure 2: Basic hemodynamics of the Anrep effect in humans.
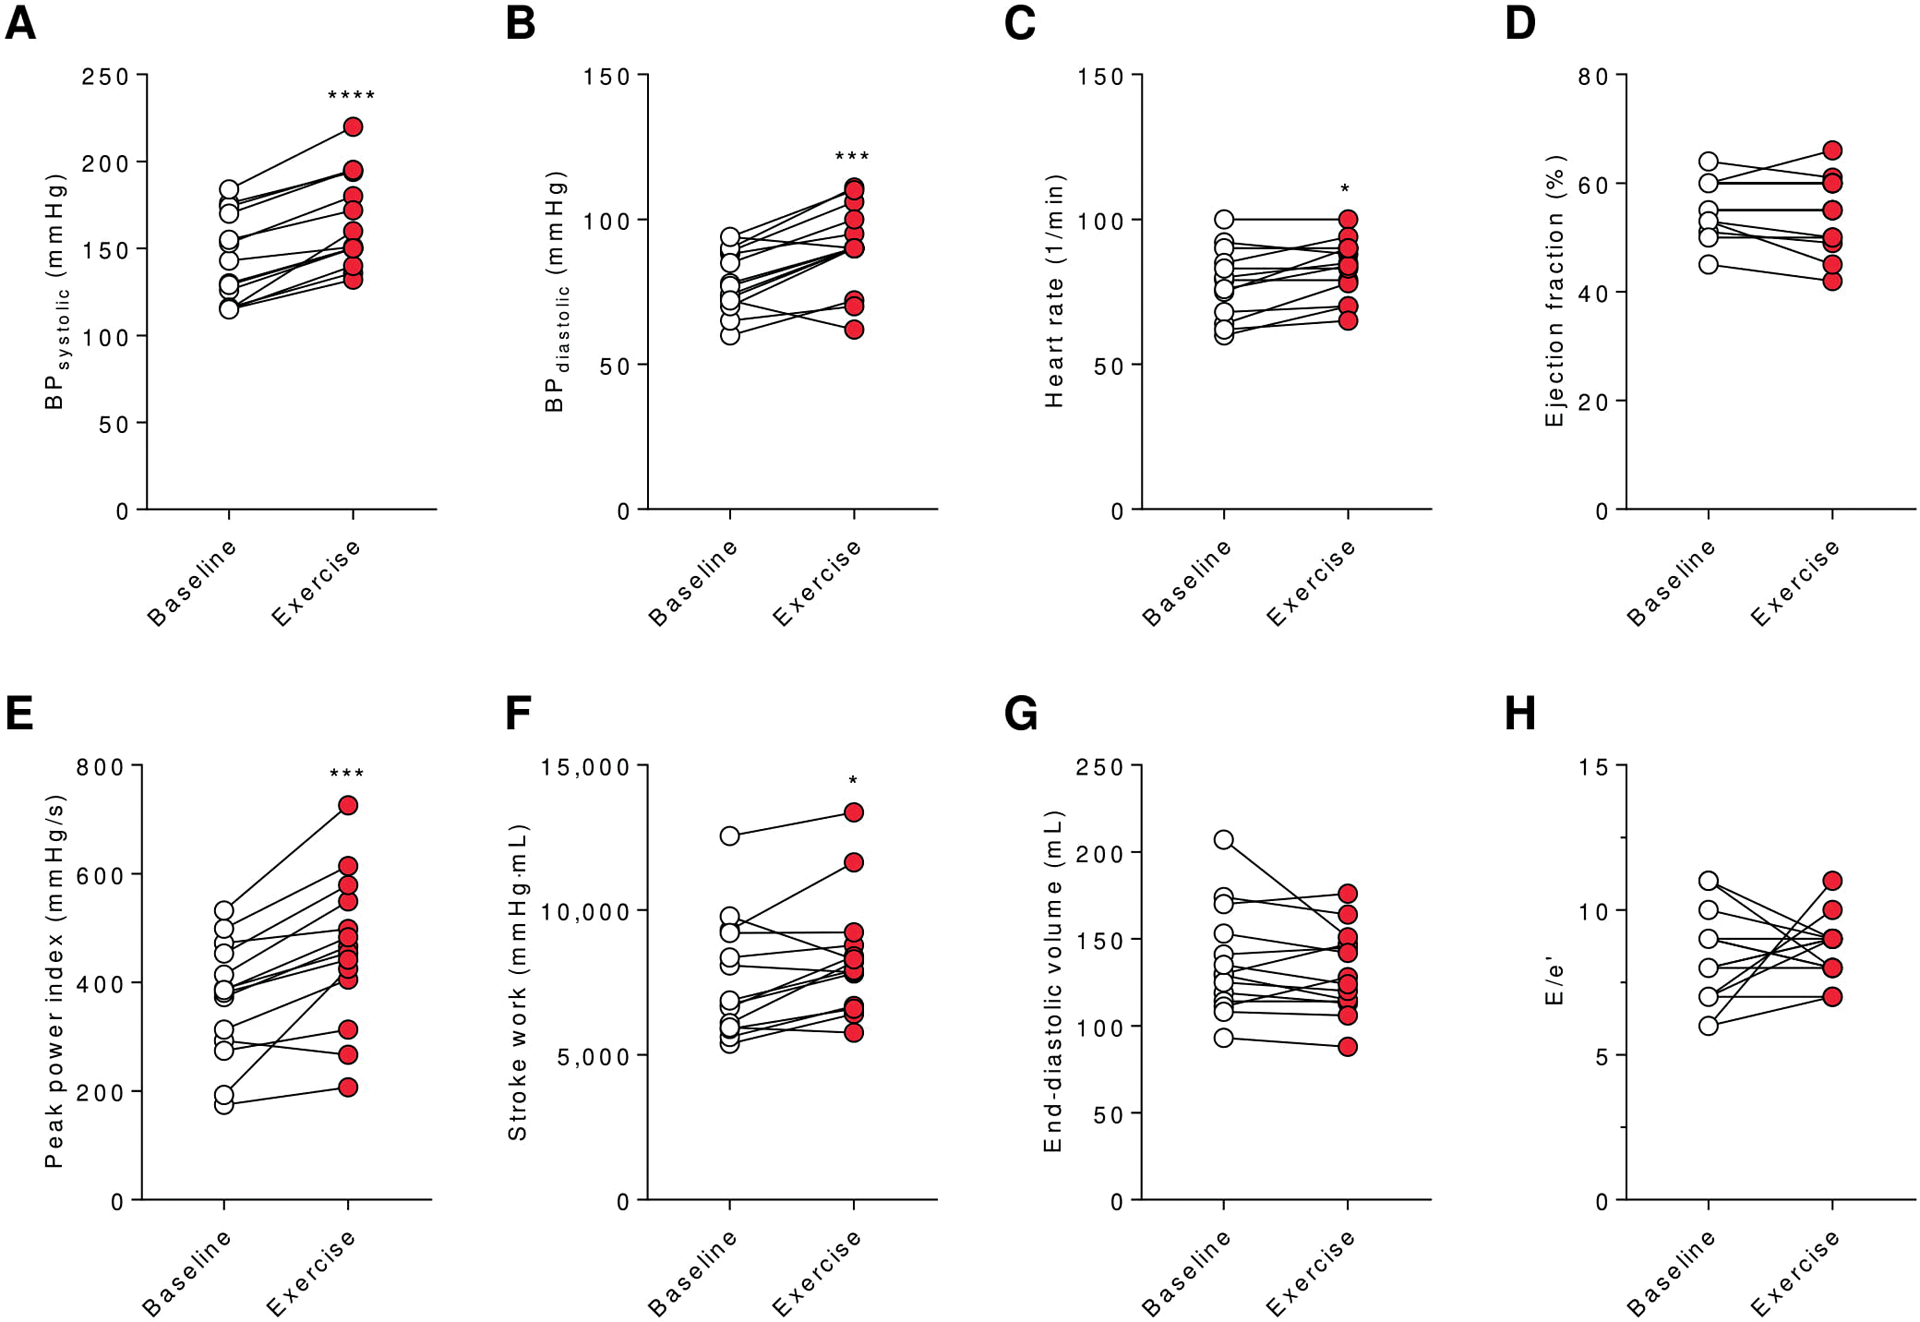
Data are shown as mean±SD. Systolic (A) and diastolic (B) blood pressure (BP), heart rate (C), ejection fraction (D), PPI (E), stroke work (F), EDV (G) and E/e’ (H) of human healthy volunteers are shown at baseline (white) and during exercise (red). *p<0.05, ***p<0.001, ****p<0.0001 vs. baseline; n=14
Experimental protocol of wild type mice (C57BL/6N)
To assess the afterload dependence of the ESPVR and the E(t) curves, a sudden afterload increase to 100 mmHg was induced after isolated working mouse hearts had equilibrated to an afterload of 60 mmHg (steady state 1= SS1, n=11, Fig.3A). Preload and HR were kept constant throughout the entire procedure at 10 mmHg and 400 beats/min, respectively. The sudden increase of afterload to 100 mmHg (“aortic occlusion”), determined ESPVR1 with its slope Ees reflecting end-systolic ventricular elastance of SS1. The higher load was kept constant for 30 s to allow equilibration at steady state 2 (SS2). Thereafter, afterload was suddenly decreased from 100 to 60 mmHg (“aortic release”) to assess ESPVR2 and Ees of SS2. The baseline afterload again was kept constant for 30 s to reach SS3 (Fig.3A). In order to determine hemodynamic parameters at each steady or intermediate state (Intermediate state A (IMA), Intermediate state B (IMB)), 5 sequential single-beat analyses of individual PV loops were averaged. IMA is defined as the sequential loops directly after ESPVR1 (“aortic occlusion”), while IMB indicates the sequential loops directly after ESPVR2 (“aortic release”), each immediately measured after up- and downregulation of afterload column (in ca. 4 s), respectively.
Figure 3: Anrep protocol and groundbreaking hemodynamics in mice.

Scheme of experimental protocol (A) of steady and intermediate states are demonstrated with time periods of change in afterload levels (60 and 100 mmHg and vice versa). Original registrations of left ventricular (LV) pressure (red coloured) and volume (green area) of the PV relation (B) are presented at low chart speed. Representative graphs of the beat to beat changes of dp/dtmax (C), stroke volume (D) and stroke energy (E) vs. time are shown in response to increased afterload. Arrows indicate start of sudden increase in afterload.
6 WT hearts were treated with streptomycin to block and study the influence of the intracellular Ca2+ transient activated by the non-specific stretch-activated ion channels (SACs) present in SFR and Gregg phenomenon. After an equilibration time of 15 min an identical protocol for the Anrep effect was performed followed by an increase in preload from 8 to 15 mmHg (sustained stretch) for 5 min. Directly after stretch and after 5 min five consecutive PV loops were analysed.
Hemodynamic response to changes in afterload in C57BL/6N mice
A typical readout (Fig. 3B) demonstrates the adaptation of SV to changes in afterload directly indicating the Anrep effect. After a sudden increase of afterload, LV systolic pressure (LVP) attained a new stable equilibrium (100 mmHg). In contrast, ESV initially increased because of enhanced afterload and SV decreased consequently (Fig. 3B, green area and Fig. 3D), paralleled by increasing potential energy (PE) and an initial drop of SW (Fig. 3E). After attaining a transient plateau, SV then gradually recovered accompanied by steadily increasing dP/dtmax and total energy (PVA), eventually reaching a new stable plateau nearly to baseline values within seconds, indicating increased LV inotropy promoted by higher SW (Fig. 3B, 3E). After about 10 s there was no further gain in SV and dP/dtmax excluding any contribution of the Gregg effect and SFR. Notably, LV end-diastolic pressure (LVEDP) and EDV remained constant over the specified 30 s.
Multi-beat PV analysis in C57BL/6N mice
Multi-beat analysis was performed when afterload was abruptly increased (ESPVR1) and decreased (ESPVR2; Fig. 4A). When afterload was held constant at 100 mmHg and then abruptly decreased to 60 mmHg, ESPVR2 (grey loops) demonstrated a significantly leftward shift compared to ESPVR1 (black loops; multi-beat ESV100 18.6 ±1.3 vs. 40.5 ±1.6 μl; P<0.05, n=11; Fig. 4A) indicating afterload induced increase in contractility.
Figure 4: PV analysis and systolic function in response to increased afterload.

Original PV loops of multiple beat analysis (A) demonstrate ESPVR of WT mice during “aortic occlusion” (black, ESPVR 1) and “aortic release” (grey, ESPVR 2), comparing ESPVR from low to high (60–100 mmHg) and from high to low (100–60 mmHg) afterload levels, respectively. Representative PV loops (B) and corresponding single beat ESPVR measurements (identical coloured; C) of WT mice are shown at different steady and intermediate states. SV (D), Ees (E), dP/dtmax (F), ESV 100 mmHg (G), time to Emax (H) of WT mice c. Representative elastance vs. time graphs of WT mice are also demonstrated for SS1, IMA and SS2 states (H). Data are shown as mean±SD (panels D-H). *p<0.05, **p<0.01, ***p<0.001, **** p<0.0001 vs. SS1; ∇ p<0.05 IMA vs. SS2; p-value in graphs represents ANOVA test; n=10
Single-beat PV analysis of C57BL/6N mice
Systolic and diastolic function during “aortic occlusion”
Representative PV loops and corresponding single-beat ESPVRs in each phase are presented in Fig. 4B–C. SV and EF of IMA were significantly reduced compared to SS1 (Fig. 4D, Fig. 5D). Single-beat Ees was significantly increased (Fig. 4B–C,E), while ESV100 was significantly decreased (Fig.4G) consistent with significantly increased dP/dtmax (Fig. 4F). Interestingly, all contractile parameters showed at IMA (after ca. 4 s) unanimously an increase of about approximately 60% of the final gain at SS2 (after 30 s). After a trough before, SW (Fig.5A) was unaltered between SS1 and IMA. After longer exposure to higher afterload levels, SV, dP/dtmax, PPI, EF, and SW were further increased at SS2. These changes were accompanied by an additional significant leftward shift of single beat ESPVR indicated by reduced ESV100 and V0 (SS2 vs. IMA; Fig. 4C, Fig. 4G and Fig. 5B). Relaxation time constant (τ) was slightly prolonged in IMA compared to SS1 (Fig.6D) resulting in a significant reduction of peak filling rate (Fig. 6A). At SS2, τ and peak filling rate recovered to the initial values of SS1 (p<0.05, SS2 vs. IMA).
Figure 5: Energetics in response to increased afterload.

Stroke work (A), V0 (B), end-diastolic volume (C), ejection fraction (D), mechanical efficiency (E) and potential energy (F), total pressure-volume area (G) and wall stress (F) of WT mice are shown at different steady and intermediate states. *p<0.05, **p<0.01, ***p<0.001, **** p<0.0001 vs. SS1; ∇ p<0.05 IMA vs. SS2; p-value in graphs represents ANOVA test; n=10
Figure 6: Diastolic function and protein kinase activity.

Peak filling rate (A), dP/dtmin (B), end-diastolic pressure (C), tau (τ) (D), and coronary flow (E) (n=10). PKA- (F), PKG- (G) PKC-activity (H) of WT mice (n=6–7) are shown at different steady and intermediate states. *p<0.05, **p<0.01, ***p<0.001, ****p<0.0001 vs. SS1; ∇ p<0.05 IMA vs. SS2; p-value in graphs represents ANOVA test.
Systolic and diastolic function during “aortic release”
After “aortic release”, in principle, all hemodynamic results shown at SS2 were reversed. All contractility parameters had an initial loss of more than 60% from SS2 to IMB and eventually achieved the values of SS1 at SS3. After aortic release τ and maximal peak filling rate also returned at SS3 to the baseline values.
Time-varying elastance technique and time to Emax in WT mice
The elastance-time curves of IMA and SS2 have significantly higher maxima (Emax) and significantly prolonged time to reach Emax compared to SS1 (Fig 4H). Both parameters have already at IMA nearly the same values as at SS2.
Effects of streptomycin on acutely raised afterload and stretch
Streptomycin-treated WT hearts showed no difference compared to the untreated WT (Fig. 7A, left graph) with respect to afterload induced LV contractility indicated by SV at SS1, IMA and SS2 (LVEDP 8mmHg). Preload stretch (STR; LVEDP 15mmHg) was accompanied by a similar increase in LV SV (Frank-Starling Law) in both groups. After 5 min of sustained stretch a further increase of SV was detected only in the control group (SFR), but blunted in the streptomycin group (Fig. 7A, right graph).
Figure 7: Stroke volume, oxidative stress parameters, and kinases expression and activity.

Anrep effect in WT mice treated with (n=6; black circles) and without (n=7; white circles) streptomycin (80μM) indicated by SV at SS1, IMA and SS2 (A, left graph), Sustained stretch after baseline (BL=SS1, LVEDP= 8mmHg) with increased LVEDP to 15mmHg (STR) and slow force response after 5min of LVEDP of 15mmHg (SFR) with and without streptomycin treatment (A, right graph). H2O2 level in homogenate, H2O2 level in mitochondria and H2O2 level in cytosol (B) GSH concentration (C), expression, activity over time,, activity after 60min and oxidation of Ca2+/calmodulin-dependent protein kinase-II (CaMKII) (D-G), activities of myosin light chain kinase (MLCK; H) are given at different steady states (SS1, SS2 and SS3). Data are shown as mean±SD. * p<0.05, **p<0.01, ***p<0.001, ****p<0.0001 vs. SS1 or BL in WT; ×p<0.05 SS3 vs. SS2 in WT; ††p<0.01, †††p<0.001, ††††p<0.0001 vs. SS1 or BL in WT with streptomycin; ‡p<0.05 SFR vs. STR in WT; #p<0.05 WT SFR vs. WT SFR with streptomycin; p-value in graphs represents ANOVA test.
Wall stress, oxidative stress and protein kinase activity
With increased afterload at IMA and SS2 wall stress was augmented and returned to baseline at SS3 as did afterload (Fig. 5H). Compared to SS1, saturating activity of CaMKII was significantly increased at both SS2 and SS3, (Fig. 7F).), whereas the expression level of CaMKII remained unchanged in all groups (Fig. 7D). However, the submaximal CaMKII activity accelerates earlier during SS2 compared to SS3 as evidenced by the steep growth curve-relation and suggesting different kinetics of activation of CaMKII between SS2 and SS3 (Fig. 7E). After 30min both SS2 and SS3 reached saturation and plateaued. Notably, increased CaMKII activity was mainly related to increased CaMKII oxidation, as Met281 and Met282 sites of CaMKII were highly oxidized in SS2 and SS3 (Fig. 7G). Oxidative stress was detected by significantly higher H2O2 in the whole myocardium and also in the mitochondria and cytosolic subfractions at SS2 (Fig. 7B). At SS3, H2O2 remained elevated in cytosol, while significantly decreased in mitochondria (Fig. 7B). GSH was reduced at SS2 and SS3 compared to SS1 (Fig. 7C). Interestingly, MLCK activity was unchanged at SS2 and significantly reduced in SS3 compared to SS2 (Fig. 7H), while PKA, PKG, and PKC activity were unaltered in all groups (Fig. 6F–H). CaMKII-dependent phosphorylation targets were also analyzed. (Fig. 8A). CaN and CREB (Fig. 8 C,H) were both hyperphosphorylated at SS2 and SS3, while SRF, HDAC4 and Histone 3 were only increased in phosphorylation at SS3 (Fig. 8B, D–E). HSF1 showed increased phosphorylation only at SS2 (Fig. 8F), whereas, DPR1 and ATF were slightly increased at both steady states, but not significant (Fig. 8G and I). Gene expression of CaMKII targets was unchanged (Fig. 9A–G).
Figure 8: Phosphorylation of intracellular CaMKII targets.

Heatmap of protein phosphorylation (P; A) of SRF serine (Ser)-103-P (B), calcineurin (CaN) Ser-197-P (C), HDAC4 Ser-467-P (D), H3 Ser-10-P (E), HSF1 Ser-230-P (F), DRP1 Ser-616-P (G), CREB-1 Ser-142-P (H), and ATF-1 Ser-63-P (I) are shown in steady state groups (SS1, SS2 and SS3). Insets indicate corresponding representative blots. Data are shown as mean±SD. *p<0.05, **p<0.01, ***p<0.001, ****p<0.0001 vs. SS1; p-value in graphs represents ANOVA test.
Phosphorylation of Ca2+handling proteins
Total expression of sarcoplasmic/endoplasmic reticulum Ca2+ ATPase 2a (Serca 2a) and its regulatory subunit PLB (Fig. 10A–C) and phosphorylation of PLB at Ser-16 (PKA-dependent phosphorylation) showed no differences between their groups (Fig. 10D), while CaMKII-dependent phosphorylation of PLB at Thr-17 (Fig. 10E) was significantly increased at SS2 compared to SS1 and SS3. Similarly, the expression of RyR2 was unaltered at the three steady states, whereas CaMKII-dependent phosphorylation of RyR2 at Ser2814 was significantly higher at SS2 compared to SS1 (Fig. 10F, G).
Figure 10: Phosphorylation of Ca2+ handling proteins.

Representative western immunoblotting in arbitrary units for Ca2+ handling proteins (A). Quantification of sarcoplasmic/endoplasmic reticulum Ca2+ ATPase 2a (Serca2A) expression (B), phospholamban (PLB) expression, (C), PLB serine (Ser)-16 and threonine (Thr)-17 phosphorylation (D and E, respectively), and ryanodine receptor 2 (RyR2) Ser-2814-P (G, F) is shown. Data are depicted as mean±SD. *p<0.05, ** p<0.01 vs. SS1; ×p<0.05 vs. SS2; p-value in graphs represents ANOVA test.
Single cardiomyocyte force measurements and phosphorylation of myofilament proteins
Submaximal Ca2+ activated tension (kN/m2) was significantly higher in SS2 compared to SS1 and SS3 (Fig. 11A). The normalized force-pCa relationship revealed significantly higher myofilament Ca2+-sensitivity in SS2 compared to SS1 and SS3 (Fig. 11B–C). The elevated myofilament Ca2+-sensitivity in SS2 was associated with increased myosin light chain (MLC2) phosphorylation that was absent in SS1 and SS3 (Fig. 11G). Greater cMyBP-C and cTnI phosphorylation was observed in both SS2 and SS3 compared to SS1 (Fig. 11E, F, respectively). The nHill coefficient of SS2 (nH 2.2 ±0.25) was significantly higher compared to SS3 (nH 1.47±0.07) and SS1 (nH 1.73±0.09), indicative of increased Ca2+-cooperative activation. In addition, cross-bridge cycling kinetics (ktr) was significantly lower at SS2 compared against both SS1 and SS3, indicative of slowing of actin-myosin turnover at saturating [Ca2+] (Fig. 11D). The passive sarcomere length-tension relationship (Fpassive) of SS1 was steeper than SS3 and SS2, revealing highest compliance at SS2 (Fig. 12A). These findings were accompanied with enhanced total titin phosphorylation at SS2 compared to SS1 (Fig. 12B) with a slight reduction in SS3 compared to SS2. Similarly, the CaMKII-dependent phosphorylation within the N2Bus at Ser-4043 was significantly increased at SS2 compared to SS1 and dropped significantly in SS3 compared to SS2 (Fig. 12C). As oxidative stress was increased at SS2 and SS3, cardiomyocytes were exposed to GSH. No GSH effect was shown in SS1, however, the Fpassive of SS2 and SS3 significantly increased at SL 2.3 and 2.4μm, suggesting that titin oxidation contributed to the reduced stiffness (Fig. 12D–F).
Figure 11: Myofilament contractility and phosphorylation.

Single cardiomyocyte force measurements (panels A-D) are represented at different steady states (n=16–24 cells/steady state from 3–5 hearts/steady state) Ca2+-activated tension vs. pCa relationships are shown (A). Normalized force vs. pCa relationships (B) with the corresponding pCa50 values (bars) indicate Ca2+-sensitivity of force production (C). Representative recordings are shown for the single exponential fit of rate constants of force redevelopment (ktr) (D). Bars indicate ktr at saturating [Ca2+] (at pCa 4.5; ktr,max). Phosphorylation of cMyBP-C Ser-282-P, cTnI Ser-23/24 and cMLC2 Ser-19-P are shown by Western immunoblotting (E, F and G, respectively). Insets indicate corresponding representative blots. Data are given as mean±SD. *p<0.05 SS2 vs. SS1; †p<0.05 SS3 vs. SS1; ‡ SS3 vs. SS2 (panels A-B). ** p<0.01, *** p<0.001, **** p<0.0001 vs. SS1; †p<0.001 vs. SS2; ††p<0.01, †††p<0.001, ††††p<0.0001 vs. SS2 (panels C-F); p-value in graphs represents ANOVA test followed with Bonferroni adjusted t-test and paired Student’s t-test for a subsequent incubation with GSH.
Figure 12: Cardiomyocyte passive stiffness (Fpassive) and titin phosphorylation.

Single cardiomyocyte passive force (Fpassive) vs. sarcomere length relationships are depicted at different steady states (n=8–10 cells/steady state from 3 hearts/steady state) (A). Total (at Ser/Thr amino acid residues; B) and CaMKII-mediated site-specific (at Ser-4043; C) phosphorylation of titin is shown by Western immunoblotting. Insets indicate corresponding representative blots. Fpassive at SS1 (D), SS2 (E) and SS3 (F) with and without GSH. Data are given as mean±SD. *p<0.05, **P<0.01 SS2 vs. SS1; †p<0.05 SS3 vs. SS1; ‡p<0.05 SS3 vs. SS2. p-value in graphs represents ANOVA test.
Hemodynamics of DKOCaMKII mice and littermates
To further investigate the contribution of CaMKII activity to the Anrep effect we used Ca2+/CaMKII double-knockout mice (DKOCaMKII) and respective wild type littermates (WL). With an increase in afterload, maximal systolic pressure developed by WL was significantly higher compared to DKOCaMKII at IMA and SS2 (Fig. 13B). Ees was slightly increased (Fig. 13A) while ESV100 was decreased in WL and DKOCaMKII at IMA and SS2 without significance (Fig. 13C). No SV differences have been found between all groups (Fig. 13D), however, in WL, SV decreased significantly at IMA compared to SS1 and increased at SS2 compared to IMA at higher afterload levels (Fig. 13D). The results of WL are similar to C57BL/6N mice, while SV of DKOCaMKII remained rather unchanged. Importantly, maximal change in ESV100 (ΔESV100; Fig. 13C) between SS1 and SS2, was significantly higher in WL compared to DKOCaMKII, suggesting a significant increase in afterload dependent contractility. Concordantly, dp/dtmax was significantly elevated at SS2 (Fig. 13E) and SV differences (ΔSV IMA vs. SS2; Fig. 13D) were also significantly increased in WL compared to DKOCaMKII. The time-varying elastance technique demonstrated an unchanged time to Emax in all groups for DKOCaMKII (Fig.14B,C). WL, however, showed a significant prolongation of time to Emax compared to DKOCaMKII resembling C57BL/6N mice (Fig. 14A, C). Myocardial relaxation was faster at IMA and SS2 in WL compared to DKOCaMKI (Fig. 14D,E).
Figure 13: Systolic function of DKOCaMKII at different afterload levels.

Ees (A), end-systolic pressure (Pes; B), ESV 100 mmHg with changes from SS1 to SS2 as ΔESV 100 mmHg (C), stroke volume with changes from IMA to SS2 as Δstroke volume (D), dP/dtmax (E), and ejection fraction (F) of DKOCaMKII mice (n=8, yellow) and corresponding wild type WL mice (grey, n=7) are shown at SS1, IMA and SS2. Data are given as mean±SD. **p<0.01, ***p<0.001, **** p< 0.0001 IMA/SS2 WL vs. SS1 WL; †p<0.05, †††p<0.001, ††††p<0.0001 IMA/SS2 DKOCaMKII vs. SS1 DKOCaMKII; ‡ p<0.05, ‡‡ p<0.01 DKOCaMKII vs. WL; #p<0.01 DKOCaMKII vs. WL;
Figure 14: Elastance-time graphs and diastolic function of DKOCaMKII.

Representative elastance vs. time graphs of wild type littermates (WL) (A) and DKOCaMKII mice (B) are shown at SS1, IMA and SS2. Time to Emax (C), tau (τ) (D) and dP/dtmin (E) values of DKOCaMKII mice (yellow, n=8) and corresponding wild type WL mice (grey, n=7) are given at SS1, IMA and SS2. Data are shown as mean±SD. ****p< 0.0001 IMA/SS2 WL vs. SS1 WL; †p<0.05, †††p<0.001, ††††p<0.0001 IMA/SS2 DKOCaMKII vs. SS1 DKOCaMKII; ‡ p<0.05 DKOCaMKII vs. WL.
Discussion
Delineation of the Anrep effect from slow force response (SFR) and Gregg phenomenon
SFR is defined as a secondary phenomenon of slowly developing contractility over minutes in isolated hearts or muscle strips (trabecula) triggered by a sustained increase in preload stretch (heterometric autoregulation), first described by Parmley (Parmley & Chuck, 1973). In our preload controlled model abruptly increasing afterload resulted in immediately elevated LV contractility while LVEDV and LVEDP remained unchanged, implying homeometric autoregulation. Supported isolated heart preparations in situ (Sarnoff et al., 1960), and closed-chest dogs (Freeman, 1990), however, showed elevated LV contractility with short-lived increased LVEDP and LVEDV indicating recruitment of the preload reserve in situ (Ross, 1976). This stretch is transient (few seconds) and not essential for the Anrep effect, as evidenced in the present study. Furthermore, the Anrep effect is completed within 10 seconds, the SRF, however, after 2–15 min depending on species and experimental preparations (Alvarez et al., 1999; Dowrick et al., 2019). Additionally, SFR is mediated by SACs and can be inhibited in mice by streptomycin (Ward et al., 2008). Our results demonstrated no changes of afterload induced hemodynamics by streptomycin, whereas SFR was blunted after sustained stretch (Fig. 7A). The latter indicates that transient stretch and sustained stretch cannot be compared in their biological impact, presumably serving different targets.
Increased coronary perfusion flow with crystalloid solutions has been reported to increase LV contractile function (Gregg phenomenon) (Gregg, 1963) based on microvascular volume changes with subsequent stimulation of SACs to increase intracellular Ca2+ transient (Lamberts et al., 2002; Westerhof et al., 2006). The onset of contractility owing to the Gregg phenomenon was reported to arise in about 5 s and reached maximal developed force after about 40 s using a sustained perfusion step (Schouten et al., 1992; Lamberts et al., 2002). Consequently, the instantaneous start of the Anrep effect at IMA was too rapid to explain it by the Gregg effect. Later changes of LV contractility would have been indicated by increasing SV curve at higher afterload between IMA and SS2. After completed recovery of SV after about 10 s, SV and dP/dtmax curves showed a stable plateau (Fig. 3C,D), excluding any additional increase in LV contractility probably due to saturation of the Gregg phenomenon which was demonstrated in the arterially perfused rat papillary muscle (Schouten et al., 1992; Westerhof et al., 2006). In our model coronary baseline flow (SS1) is extremely high (2–3 ml/min) showing a 10-fold increase compared to in vivo conditions (0.2–0.3 ml/min) (Teng et al., 2016) possibly exhausting the Gregg phenomenon. Additionally, streptomycin did not influence afterload induced increase in LV contractility. Therefore, Gregg phenomenon was completely activated at SS1, and did not - or only negligibly - affect LV contractility at SS2.
Sub- and cellular mechano-chemical changes contribute to the Anrep effect
In this work we characterize two separate, but potential synergistic phases, of the Anrep effect, that are the initial myofilament mechanical-dependent phase (IMA) followed by a secondary posttranslational-dependent phase (phosphorylation and oxidation, SS2). First, when afterload is elevated, wall stress increases and energy demand due to increased PE is considerably higher to compensate for the enhanced LV ejection resistance (IMA). The initial mechanical-dependent phase is largely dependent on the strain sensitive myosin cross-bridges to enhance myofilament force generation (Fig 11A–B). During afterload augmentation the dissociation of the actin-myosin interaction is substantially delayed as means to maintain a prolonged strongly-bound cross-bridge formation (i.e. extended myosin-ADP state) and increased force generation (Nyitrai & Geeves, 2004). The latter increases myosin’s ejection stroke time reflected in our experiments by deceleration of cross-bridge cycling at the myofilament level (i.e. lower ktr, Fig 11D), but also in the whole heart experiments by the elastance-time curve of IMA showing significantly prolonged LV ejection time compared to SS1 (Fig 4H). Furthermore, there is the likelihood that the prolonged formation of strongly-bound cross-bridges increases the cooperative recruitment of other rested-to-ready cross-bridges at the thick-filament area (Fitzsimons & Moss, 1998). This is accounted by the increased Ca2+-cooperative activation observed in SS2 (Fig 11B,C).
Consequently, the second phase of the Anrep effect appears to be dominated by posttranslational modulators: 1) direct MLC2 phosphorylation (Fig 11G) that is both capable to increase myosin’s approximation towards actin (and re-structure of myosin heads for activation) and hence, greater force generation (Kampourakis et al., 2016), in addition to the potential further recruitment of cross-bridges from a subset population of super rested myosins (Naber et al., 2011); and 2) increased CaMKII activation partly dependent on oxidative stress with subsequent downstream phosphorylation of cMyBP-C, cTnI and Ca2+ handling proteins, as well as titin oxidation. Increased formation of oxidative radicals occurs because during afterload elevation ATP regeneration is prioritized at the expense of the mitochondrial anti-oxidative capacity (Nickel et al., 2015). The resulting mitochondrial overflow of H2O2 produces oxidative stress. In addition, NADPH oxidases (NOX) are also important sources of ROS formation. The ability of CaMKII to phosphorylate and activate NOX5 may significantly reinforce up-regulation of ROS production (Pandey et al., 2011). Both mechanisms likely account for the CaMKII alterations observed. Evidence of a causal relationship between ROS and CaMKII activity has been shown by other studies (Wu et al., 2019).
While MLC2 phosphorylation is well established to increase myofilament Ca2+-sensitivity, cMyBP-C and cTnI phosphorylation instead promote its reduction (Verduyn et al., 2007). The normalized Ca2+ activated force-pCa relationship demonstrated a considerable leftward shift for SS2 indicating increased Ca2+-sensitivity at higher afterload. The latter likely reflects that differences in absolute levels of phosphorylation of MLC2 in quantitative terms were larger than those of cMyBP-C and cTnI phosphorylation. Langendorff-perfused rat hearts showed a 2-fold increase in MLC2 phosphorylation, while cMyBP-C and cTnI phosphorylation remained unchanged (Verduyn et al., 2007). While cTnI phosphorylation (secondarily) improves cardiac contractility via acceleration of Ca2+-reuptake, CaMKII-dependent cMyBP-C phosphorylation is well known to markedly improve and accelerate recruitment of cross-bridges (Campbell, 1997; Moss et al., 2015), a cooperative process speeding the increment of myosin work and contractility (Moss et al., 2015). This is reflected by enhanced SW and the leftward shift of Ees at SS2. Hence, Moss and co-workers introduced the term “myofilament phosphoregulation” beside “Ca2+ transient” as the determining component for increased myocardial contractility of the Bowditch effect (Tong et al., 2015) presumably also valid for the Anrep effect.
The declined Fpassive in SS2 and SS3 seems to be mainly attributed to increased titin oxidation in myocytes as oxidative stress was elevated in both states, consisting with previous findings on isolated human cardiomyocytes that S-glutathionylation causes a decrease in titin-based stiffness (Alegre-Cebollada et al., 2014). As CaMKII was activated and also site-dependent phosphorylation of titin were high in SS2 and SS3, we are confident that reduced Fpassive in SS2 and SS3 is related to titin phosphorylation and oxidation (Hamdani et al., 2013c). Reduced Fpassive may also support systolic function due to minor impairment of filament sliding, thereby facilitating the Anrep effect.
The Anrep effect in mice and men
The Anrep effect can be illustrated by the biphasic SV curve, governed by two separable processes (Fig. 3B). The first occurred momentary when afterload was raised (increase in LVP) and was tightly associated with an instant decline of SV, but markedly elevated PE. The immediate increase in PE was indicated by prolonged LV ejection time at IMA accomplished by the enhanced force of the delayed strongly-bound myosin stroke (Geeves & Lehrer, 1994). LV contractility effected the leftward shift of ESV100 to equilibrate increased afterload and thereby preventing a more pronounced SV decline. The second process was dominated by markedly increasing SW, occurring with a short plateau-like delay after IMA, after that SW and lower SV steadily rose up to the final stable plateau phase within 10 s (Fig. 3D,E). The increase of SW and recovery of SV were characterized by an additional leftward shift of single-beat ESPVR due to decreased V0, concomitantly with enhanced dp/dtmax, and PVA in SS2 showing further increase of LV contractility. SW in SS1 and IMA remained unchanged. Further increase in SW therefore required considerably higher recruitment of cross-bridge binding. This is presumably accomplished by increased MLC2 phosphorylation and CaMKII oxidation with selective phosphorylation of cMyBP-C, while Ca2+ handling proteins RyR2 and PLB at Thr-17 and titin oxidation/ phosphorylation were also involved. The second phase showed the specific mechanism of preserving SV, the principle of the Anrep effect.
Myocardial relaxation (τ) and peak filling rate were initially depressed due to increased afterload in the first phase (IMA) but were gradually restored during the second phase of enhanced SW and contractility (SS2). Improvement of relaxation is also indicated by a significant increase in dp/dtmin. Beside presumably accelerated cytosolic Ca2+ re-uptake into SR, cMyBP-C phosphorylation was primarily shown in diastole to promote positive lusitropy by increasing the rate of myosin cross-bridge detachment (Moss et al., 2015; Rosas et al., 2015).
The reversal of the Anrep effect from SS2 to SS3 might broadly be explained by the rapid release of PE and SW near to baseline values thereby normalizing the expanded population of rigor-like myosin and myosin cross bridges. With increased phosphorylation of MLC2 at SS2 myosin heads were closer directed to actin (“on” conformation), thereby increasing myocardial contractility by enhancing the availability of recruited cross-bridge bindings (Kampourakis et al., 2016). This effect is reversed by lower MLC2 phosphorylation (“off” conformation) (Kampourakis et al., 2016). In our study MLCK activity and MLC2 phosphorylation as well as phosphorylation of Ca2+ handling proteins and titin were all significantly decreased from SS2 to SS3 according to the hemodynamic findings at SS3. The latter may explain the return of LV contractility to the baseline state, and is presumably further supported by decreased rate of CaMKII activity and the drop of H2O2 in mitochondria at SS3 compared to SS2 (Fig. 7B,E).
Biochemical and hemodynamic analyses of DKOCaMKII showed a complete loss of CaMKII activity in cardiomyocytes with normal cardiac function at rest previously published by our group (Kreusser et al., 2014). After acutely enhanced afterload in our model, these mice developed less systolic pressure, less SV gain and less contractility gain (ΔESV100) compared to WL at IMA and SS2, demonstrating that the lack of CaMKII δ and γ strongly attenuates the Anrep effect.
The Anrep effect is also evident in vivo in healthy human volunteers. Increase in cardiac contractility was indicated by a positive correlation between Ees and Ea and an increased LV ejection period as well, similar to WT/WL mice. Additionally, the Anrep effect is shown by increased ESPVR resulting in a nearly preserved SV with increased LV ejection period and slightly reduced preload, thereby excluding any β-adrenoceptor tone as well as any contribution of the Frank-Starling mechanism. Increased LV ejection period and SW possibly also point out to increased numbers of strongly-bound myosins, showing the autoregulatory inotropic capabilities of human hearts in vivo.
Elastance-time curve in relation to myofilament phosphorylation status
Based on findings of the time-varying elastance technique differences of Emax and time to Emax were reported for myofilament activators, Ca2+sentizisers and catecholamines (Nagayama et al., 2007; Borlaug & Kass, 2009). In comparison to normal elastance-time curves, β-adrenoceptor stimulation enhanced the steepness of initial rise and fall of the elastance-time curve, and additionally attained earlier its higher peak (Emax), thus abbreviating systolic ejection period. The adrenergic mode of action is promoted by activation of PKA with coordinated increase in Ca2+ transients and myofilament proteins phosphorylation (Nagayama et al., 2007; Borlaug & Kass, 2009). In contrast, myofilament activators and Ca2+ sensitizers, like Omecamtiv mecarbil and levosimendan increase Emax and prolong time to Emax thereby extending LV ejection period, likely accomplished by enhanced recruitment of strongly-bound cross-bridges (Borlaug & Kass, 2009; Nagy et al., 2015). The time dependent elastance curve of SS2, and that of Ca2+ sensitizers showed striking similarities. Thus, the prolonged systolic ejection period at higher afterload (SS2) may be mainly assigned to the enhanced phosphorylation of MLC2 and synergistically to cMyBP-C. Interestingly, the broader “shoulder” of the elastance-time curve was lacking in DKOCaMKII at higher afterload, hence probably emphasizing the importance of CaMKII oxidation and dependent phosphorylation of cMyBP-C for the Anrep effect. Therefore, the different profiles of the elastance-time curves may give important insights to the underlying molecular mechanism of different inotropic drugs and effects even in patients.
Limitations
Our results suggest only correlation between oxidative stress and CaMKII activity with downstream target phosphorylation, but no causation. Nevertheless, evidence of a causal relationship between ROS and CaMKII activity has been shown by other studies. In MMVV-mice with knock-in replacement of the methionines of the regulatory domain of CaMKII with valines, ischemia/reperfusion injury was significantly reduced showing less apoptosis and improved myocardial function compared to wild-type controls (Wu et al., 2019). Generally, CaMKII activity can be triggered by four post-translational modifications (PTM) in the regulatory domain after initial Ca2+/calmodulin interaction resulting in autonomous activity: 1. Phosphorylation (Thr 287), 2. Oxidation (Met 281/282), 3. O-GLCNAcylation (Ser 279) 4. Nitrosylation (Cys 290) (Erickson, 2014; Beckendorf et al., 2018). Due to the increased wall stress with elevated ROS production and oxidation of Met 281/282 residues of CaMKII in our model the other described mechanisms seem to be unlikely. In particular, we can exclude hyperglycemia in our experimental set up, ruling out O-GlcNAcylation at Ser 279. In the presence of increased oxidative stress in our model, NO as a ROS scavenger is expected to be low in our mice hearts, excluding S-Nitrosylation of Cys 290. According to (Erickson, 2014), oxidation of Met 281/282 precludes autophosphorylation of Thr 287 thereby ruling out direct activation of CaMKII via Ca2+/calmodulin interaction
Conclusion
The Anrep effect represents the alterations of LV contractility to acutely enhanced afterload in a few seconds thereby preserving SV at constant preload and HR. Due to the missing transient preload stretch in our model, the Anrep effect and SFR act independently of each other based on different triggers and subcellular mechanisms.
The murine working heart demonstrated two interlocking, but separable mechanisms. Firstly, the sudden increased afterload was momentary equilibrated by the enhanced LV contractility and was presumably accomplished by the increased force generation and higher power strokes due to strongly-bound cross-bridges, overcoming the high potential energy. Secondly, the slightly delayed recovery of SV is perhaps depending on phosphorylation of cMyBP-C and MLC2 and CaMKII oxidation, producing increased SW by maximizing the recruitment of available strongly-bound cross-bridges. These results were supported by the single cell measurements and the prolonged LV ejection period of the wild-type hearts. Therefore, short-lived oxidative stress might present a new facet of subcellular signaling in cardiovascular regulation. Relevance for human physiology was demonstrated by echocardiography disclosing the Anrep effect in humans during handgrip exercise.
Supplementary Material
Key points.
The Anrep effect represents the alterations of left ventricular (LV) contractility to acutely enhanced afterload in a few seconds thereby preserving stroke volume (SV) at constant preload. Due to the missing preload stretch in our model, the Anrep effect differs from slow force response and has a different mechanism.
The Anrep effect demonstrated two different phases. Firstly, the sudden increased afterload was momentary equilibrated by the enhanced LV contractility caused by higher power strokes of strongly-bound myosin cross-bridges. Secondly, the slightly delayed recovery of SV is perhaps depending on Ca2+/calmodulin-dependent protein kinase II (CaMKII) activation caused by oxidation and myofilament phosphorylation (cardiac myosin-binding protein-C, myosin light chain 2), maximizing the recruitment of available strongly-bound myosin cross-bridges.
Short-lived oxidative stress might present a new facet of subcellular signaling to cardiovascular regulation.
Relevance for human physiology was demonstrated by echocardiography disclosing the Anrep effect in humans during handgrip exercise
Acknowledgements
The authors thank Jeanette Zimolong, Homburg/Saar, and Ramona Nagel, Essen, for excellent technical assistance. The authors thank Johannes Backs, Heidelberg, for providing the DKOCaMKII mice.
Funding
D.L and M.H were supported by German Research Foundation (DFG SFB/TRR219-M02), N.H was supported by DFG7512/2-1. N.V is supported by DFG (VO1568/3–1, IRTG1816-RP12 SFB1002-A13) and the Else-Kröner-Fresenius Foundation (EKFS 2016_A20). D.D. was supported by the DFG (Do 769/4–1) and the National Institutes of Health (R01-HL131517, R01-HL136389 and and R01-HL089598).
Abbreviations
- ATF
activating transcription factor-1
- BP
blood pressure
- Ca2+
calcium
- CaMKII
Ca2+/calmodulin-dependent protein kinase-II
- CaN
calcineurin
- cMyBP-C
cardiac myosin-binding protein-C
- CREB
cAMP/calcium response element binding protein
- DKOCaMKII
CaMKII-double knock out mice
- DPR
ynamin-related protein
- Ea
effective arterial elastance
- ECC
excitation- contraction coupling
- EDPVR
end-diastolic pressure-volume relationship
- Ees
end-systolic elastance
- EF
ejection fraction
- ESP
end-systolic pressure
- ESV
end-systolic volume
- ESV100
end-systolic volume at 100mmHg
- ESPVR
end-systolic pressure-volume relationship
- EDV
end-diastolic volume
- E(t)
elastance at time (t)
- E(t)max
maximal elastance at time (t)
- Fpassive
single cardiomyocyte passive force
- HR
Heart rate
- IM
intermediate state
- ktr
rate constant of force redevelopment
- LVEDP
left ventricular end-diastolic pressure
- LV
left ventricle
- LVOT
left ventricular outflow tract
- HDAC
histone deacetylases
- HSF
heat shock factor
- H3
histone 3
- MAPK
mitogen-activated protein kinase
- MLCK
Myosin light chain kinase
- MLC2
Myosin light chain 2
- MVC
maximal voluntary handgrip capacity
- NFAT
nuclear factor of activated T-cells
- nHill
Hill coefficient
- ROS
reactive oxygen species
- pCa
–log10[Ca2+]
- pCa50
pCa value for the half-maximal Ca2+-induced contraction
- PE
potential energy
- PK
protein kinase
- PLB
phospholamban
- PV
pressure volume
- PVA
pressure- volume area
- PPI
peak power index
- RyR2
ryanodine receptor type-2
- SACs
non-specific stretch-activated ion channels
- Ser
serine
- Serca 2A
sarcoplasmic/endoplasmic reticulum Ca2+ ATPase 2a
- SFR
slow force response
- SR
sarcoplasmatic reticulum
- SRF
serum response factor
- SS
steady state
- SV
stroke volume
- SW
stroke work
- Thr
threonine
- VTI
velocity time integral
- WT
wild type
- WL
wild type littermate
Footnotes
Conflicts of interest
All authors have declared that no conflict of interest exists.
References
- Alegre-Cebollada J, Kosuri P, Giganti D, Eckels E, Rivas-Pardo JA, Hamdani N, Warren CM, Solaro RJ, Linke WA & Fernandez JM. (2014). S-glutathionylation of cryptic cysteines enhances titin elasticity by blocking protein folding. Cell 156, 1235–1246. [DOI] [PMC free article] [PubMed] [Google Scholar]
- Alvarez BV, Perez NG, Ennis IL, Camilion de Hurtado MC & Cingolani HE. (1999). Mechanisms underlying the increase in force and Ca(2+) transient that follow stretch of cardiac muscle: a possible explanation of the Anrep effect. Circ Res 85, 716–722. [DOI] [PubMed] [Google Scholar]
- Barefield D & Sadayappan S. (2010). Phosphorylation and function of cardiac myosin binding protein-C in health and disease. J Mol Cell Cardiol 48, 866–875. [DOI] [PMC free article] [PubMed] [Google Scholar]
- Beckendorf J, van den Hoogenhof MMG & Backs J. (2018). Physiological and unappreciated roles of CaMKII in the heart. Basic research in cardiology 113, 29. [DOI] [PMC free article] [PubMed] [Google Scholar]
- Borlaug BA & Kass DA. (2009). Invasive Hemodynamic Assessment in Heart Failure. Heart Failure Clinics 5, 217–228. [DOI] [PMC free article] [PubMed] [Google Scholar]
- Borlaug BA, Lam CS, Roger VL, Rodeheffer RJ & Redfield MM. (2009). Contractility and ventricular systolic stiffening in hypertensive heart disease insights into the pathogenesis of heart failure with preserved ejection fraction. Journal of the American College of Cardiology 54, 410–418. [DOI] [PMC free article] [PubMed] [Google Scholar]
- Calaghan S & White E. (2004). Activation of Na+-H+ exchange and stretch-activated channels underlies the slow inotropic response to stretch in myocytes and muscle from the rat heart. J Physiol 559, 205–214. [DOI] [PMC free article] [PubMed] [Google Scholar]
- Campbell K (1997). Rate constant of muscle force redevelopment reflects cooperative activation as well as cross-bridge kinetics. Biophys J 72, 254–262. [DOI] [PMC free article] [PubMed] [Google Scholar]
- Chen CH, Fetics B, Nevo E, Rochitte CE, Chiou KR, Ding PA, Kawaguchi M & Kass DA. (2001). Noninvasive single-beat determination of left ventricular end-systolic elastance in humans. Journal of the American College of Cardiology 38, 2028–2034. [DOI] [PubMed] [Google Scholar]
- Dowrick JM, Tran K, Loiselle DS, Nielsen PMF, Taberner AJ, Han JC & Ward ML. (2019). The slow force response to stretch: Controversy and contradictions. Acta physiologica (Oxford, England) 226, e13250. [DOI] [PubMed] [Google Scholar]
- Erickson JR. (2014). Mechanisms of CaMKII Activation in the Heart. Frontiers in pharmacology 5, 59. [DOI] [PMC free article] [PubMed] [Google Scholar]
- Erickson JR, Joiner ML, Guan X, Kutschke W, Yang J, Oddis CV, Bartlett RK, Lowe JS, O’Donnell SE, Aykin-Burns N, Zimmerman MC, Zimmerman K, Ham AJ, Weiss RM, Spitz DR, Shea MA, Colbran RJ, Mohler PJ & Anderson ME. (2008). A dynamic pathway for calcium-independent activation of CaMKII by methionine oxidation. Cell 133, 462–474. [DOI] [PMC free article] [PubMed] [Google Scholar]
- Fitzsimons DP & Moss RL. (1998). Strong binding of myosin modulates length-dependent Ca2+ activation of rat ventricular myocytes. Circ Res 83, 602–607. [DOI] [PubMed] [Google Scholar]
- Freeman GL. (1990). Effects of increased afterload on left ventricular function in closed-chest dogs. The American journal of physiology 259, H619–625. [DOI] [PubMed] [Google Scholar]
- Geeves MA & Lehrer SS. (1994). Dynamics of the muscle thin filament regulatory switch: the size of the cooperative unit. Biophysical Journal 67, 273–282. [DOI] [PMC free article] [PubMed] [Google Scholar]
- Gregg DE. (1963). EFFECT OF CORONARY PERFUSION PRESSURE OR CORONARY FLOW ON OXYGEN USAGE OF THE MYOCARDIUM. Circ Res 13, 497–500. [DOI] [PubMed] [Google Scholar]
- Hamdani N, Bishu KG, von Frieling-Salewsky M, Redfield MM & Linke WA. (2013a). Deranged myofilament phosphorylation and function in experimental heart failure with preserved ejection fraction. Cardiovascular Research 97, 464–471. [DOI] [PubMed] [Google Scholar]
- Hamdani N, Bishu KG, von Frieling-Salewsky M, Redfield MM & Linke WA. (2013b). Deranged myofilament phosphorylation and function in experimental heart failure with preserved ejection fraction. Cardiovascular research 97, 464–471. [DOI] [PubMed] [Google Scholar]
- Hamdani N, Krysiak J, Kreusser MM, Neef S, Dos Remedios CG, Maier LS, Kruger M, Backs J & Linke WA. (2013c). Crucial role for Ca2+/calmodulin-dependent protein kinase-II in regulating diastolic stress of normal and failing hearts via titin phosphorylation. Circ Res 112, 664–674. [DOI] [PubMed] [Google Scholar]
- Jian Z, Han H, Zhang T, Puglisi J, Izu LT, Shaw JA, Onofiok E, Erickson JR, Chen YJ, Horvath B, Shimkunas R, Xiao W, Li Y, Pan T, Chan J, Banyasz T, Tardiff JC, Chiamvimonvat N, Bers DM, Lam KS & Chen-Izu Y. (2014). Mechanochemotransduction during cardiomyocyte contraction is mediated by localized nitric oxide signaling. Science signaling 7, ra27. [DOI] [PMC free article] [PubMed] [Google Scholar]
- Kampourakis T, Sun YB & Irving M. (2016). Myosin light chain phosphorylation enhances contraction of heart muscle via structural changes in both thick and thin filaments. Proceedings of the National Academy of Sciences of the United States of America 113, E3039–3047. [DOI] [PMC free article] [PubMed] [Google Scholar]
- Kelly RP, Ting CT, Yang TM, Liu CP, Maughan WL, Chang MS & Kass DA. (1992). Effective arterial elastance as index of arterial vascular load in humans. Circulation 86, 513–521. [DOI] [PubMed] [Google Scholar]
- Kreusser MM, Lehmann LH, Keranov S, Hoting MO, Oehl U, Kohlhaas M, Reil JC, Neumann K, Schneider MD, Hill JA, Dobrev D, Maack C, Maier LS, Grone HJ, Katus HA, Olson EN & Backs J. (2014). Cardiac CaM Kinase II genes delta and gamma contribute to adverse remodeling but redundantly inhibit calcineurin-induced myocardial hypertrophy. Circulation 130, 1262–1273. [DOI] [PMC free article] [PubMed] [Google Scholar]
- Lamberts RR, van Rijen MH, Sipkema P, Fransen P, Sys SU & Westerhof N. (2002). Increased coronary perfusion augments cardiac contractility in the rat through stretch-activated ion channels. Am J Physiol Heart Circ Physiol 282, H1334–1340. [DOI] [PubMed] [Google Scholar]
- Lang RM, Badano LP, Mor-Avi V, Afilalo J, Armstrong A, Ernande L, Flachskampf FA, Foster E, Goldstein SA, Kuznetsova T, Lancellotti P, Muraru D, Picard MH, Rietzschel ER, Rudski L, Spencer KT, Tsang W & Voigt JU. (2015). Recommendations for cardiac chamber quantification by echocardiography in adults: an update from the American Society of Echocardiography and the European Association of Cardiovascular Imaging. European heart journal cardiovascular Imaging 16, 233–270. [DOI] [PubMed] [Google Scholar]
- Mark AL, Victor RG, Nerhed C & Wallin BG. (1985). Microneurographic studies of the mechanisms of sympathetic nerve responses to static exercise in humans. Circ Res 57, 461–469. [DOI] [PubMed] [Google Scholar]
- Martin CE, Shaver JA, Leon DF, Thompson ME, Reddy PS & Leonard JJ. (1974). Autonomic mechanisms in hemodynamic responses to isometric exercise. J Clin Invest 54, 104–115. [DOI] [PMC free article] [PubMed] [Google Scholar]
- Moss RL, Fitzsimons DP & Ralphe JC. (2015). Cardiac MyBP-C regulates the rate and force of contraction in mammalian myocardium. Circ Res 116, 183–192. [DOI] [PMC free article] [PubMed] [Google Scholar]
- Naber N, Cooke R & Pate E. (2011). Slow myosin ATP turnover in the super-relaxed state in tarantula muscle. J Mol Biol 411, 943–950. [DOI] [PMC free article] [PubMed] [Google Scholar]
- Nagayama T, Takimoto E, Sadayappan S, Mudd JO, Seidman JG, Robbins J & Kass DA. (2007). Control of in vivo left ventricular [correction] contraction/relaxation kinetics by myosin binding protein C: protein kinase A phosphorylation dependent and independent regulation. Circulation 116, 2399–2408. [DOI] [PubMed] [Google Scholar]
- Nagy L, Kovacs A, Bodi B, Pasztor ET, Fulop GA, Toth A, Edes I & Papp Z. (2015). The novel cardiac myosin activator omecamtiv mecarbil increases the calcium sensitivity of force production in isolated cardiomyocytes and skeletal muscle fibres of the rat. British journal of pharmacology. [DOI] [PMC free article] [PubMed] [Google Scholar]
- Nickel AG, von Hardenberg A, Hohl M, Loffler JR, Kohlhaas M, Becker J, Reil JC, Kazakov A, Bonnekoh J, Stadelmaier M, Puhl SL, Wagner M, Bogeski I, Cortassa S, Kappl R, Pasieka B, Lafontaine M, Lancaster CR, Blacker TS, Hall AR, Duchen MR, Kastner L, Lipp P, Zeller T, Muller C, Knopp A, Laufs U, Bohm M, Hoth M & Maack C. (2015). Reversal of Mitochondrial Transhydrogenase Causes Oxidative Stress in Heart Failure. Cell metabolism 22, 472–484. [DOI] [PubMed] [Google Scholar]
- Nyitrai M & Geeves MA. (2004). Adenosine diphosphate and strain sensitivity in myosin motors. Philosophical transactions of the Royal Society of London Series B, Biological sciences 359, 1867–1877. [DOI] [PMC free article] [PubMed] [Google Scholar]
- Pandey D, Gratton JP, Rafikov R, Black SM & Fulton DJ. (2011). Calcium/calmodulin-dependent kinase II mediates the phosphorylation and activation of NADPH oxidase 5. Molecular pharmacology 80, 407–415. [DOI] [PMC free article] [PubMed] [Google Scholar]
- Parmley WW & Chuck L. (1973). Length-dependent changes in myocardial contractile state. The American journal of physiology 224, 1195–1199. [DOI] [PubMed] [Google Scholar]
- Patterson SW & Starling EH. (1914). On the mechanical factors which determine the output of the ventricles. The Journal of Physiology 48, 357–379. [DOI] [PMC free article] [PubMed] [Google Scholar]
- Reil JC, Hohl M, Reil GH, Granzier HL, Kratz MT, Kazakov A, Fries P, Muller A, Lenski M, Custodis F, Graber S, Frohlig G, Steendijk P, Neuberger HR & Bohm M. (2013). Heart rate reduction by If-inhibition improves vascular stiffness and left ventricular systolic and diastolic function in a mouse model of heart failure with preserved ejection fraction. European heart journal 34, 2839–2849. [DOI] [PMC free article] [PubMed] [Google Scholar]
- Rosas PC, Liu Y, Abdalla MI, Thomas CM, Kidwell DT, Dusio GF, Mukhopadhyay D, Kumar R, Baker KM, Mitchell BM, Powers PA, Fitzsimons DP, Patel BG, Warren CM, Solaro RJ, Moss RL & Tong CW. (2015). Phosphorylation of cardiac Myosin-binding protein-C is a critical mediator of diastolic function. Circ Heart Fail 8, 582–594. [DOI] [PMC free article] [PubMed] [Google Scholar]
- Ross J Jr. (1976). Afterload mismatch and preload reserve: a conceptual framework for the analysis of ventricular function. Progress in cardiovascular diseases 18, 255–264. [DOI] [PubMed] [Google Scholar]
- Sarnoff SJ, Mitchell JH, Gilmore JP & Remensnyder JP. (1960). Homeometric Autoregulation in the Heart. Circulation Research 8, 1077–1091. [DOI] [PubMed] [Google Scholar]
- Schouten VJ, Allaart CP & Westerhof N. (1992). Effect of perfusion pressure on force of contraction in thin papillary muscles and trabeculae from rat heart. J Physiol 451, 585–604. [DOI] [PMC free article] [PubMed] [Google Scholar]
- Suga H (1990). Ventricular energetics. Physiological reviews 70, 247–277. [DOI] [PubMed] [Google Scholar]
- Ten Brinke EA, Klautz RJ, Verwey HF, Van Der Wall EE, Dion RA & Steendijk P. (2010). Single-beat estimation of the left ventricular end-systolic pressure–volume relationship in patients with heart failure. Acta Physiologica 198, 37–46. [DOI] [PubMed] [Google Scholar]
- Teng B, Tilley SL, Ledent C & Mustafa SJ. (2016). In vivo assessment of coronary flow and cardiac function after bolus adenosine injection in adenosine receptor knockout mice. Physiological reports 4. [DOI] [PMC free article] [PubMed] [Google Scholar]
- Tong CW, Wu X, Liu Y, Rosas PC, Sadayappan S, Hudmon A, Muthuchamy M, Powers PA, Valdivia HH & Moss RL. (2015). Phosphoregulation of Cardiac Inotropy via Myosin Binding Protein-C During Increased Pacing Frequency or beta1-Adrenergic Stimulation. Circ Heart Fail 8, 595–604. [DOI] [PMC free article] [PubMed] [Google Scholar]
- Verduyn SC, Zaremba R, van der Velden J & Stienen GJ. (2007). Effects of contractile protein phosphorylation on force development in permeabilized rat cardiac myocytes. Basic research in cardiology 102, 476–487. [DOI] [PMC free article] [PubMed] [Google Scholar]
- von Anrep G (1912). On the part played by the suprarenals in the normal vascular reactions of the body. The Journal of Physiology 45, 307–317. [DOI] [PMC free article] [PubMed] [Google Scholar]
- Ward ML, Williams IA, Chu Y, Cooper PJ, Ju YK & Allen DG. (2008). Stretch-activated channels in the heart: contributions to length-dependence and to cardiomyopathy. Progress in biophysics and molecular biology 97, 232–249. [DOI] [PubMed] [Google Scholar]
- Westerhof N, Boer C, Lamberts RR & Sipkema P. (2006). Cross-talk between cardiac muscle and coronary vasculature. Physiological reviews 86, 1263–1308. [DOI] [PubMed] [Google Scholar]
- Wu Y, Wang Q, Feng N, Granger JM & Anderson ME. (2019). Myocardial death and dysfunction after ischemia-reperfusion injury require CaMKIIdelta oxidation. Sci Rep 9, 9291. [DOI] [PMC free article] [PubMed] [Google Scholar]
Associated Data
This section collects any data citations, data availability statements, or supplementary materials included in this article.