

Summary
Cholesterol plays two critical roles in Hedgehog signaling, a fundamental pathway in animal development and cancer: it covalently modifies the Sonic hedgehog (SHH) ligand, restricting its release from producing cells, and directly activates Smoothened in responding cells. In both contexts, a membrane protein related to bacterial RND transporters regulates cholesterol: Dispatched1 controls release of cholesterylated SHH, and Patched1 antagonizes Smoothened activation by cholesterol. The mechanism and driving force for eukaryotic RND proteins, including Dispatched1 and Patched1, are unknown. Here, we show that Dispatched1 acts enzymatically to catalyze SHH release. Dispatched1 uses the energy of the plasma membrane Na+ gradient, thus functioning as an SHH/Na+ antiporter. In contrast, Patched1 repression of Smoothened requires the opposing K+ gradient. Our results clarify the transporter activity of essential eukaryotic RND proteins, and demonstrate that the two main cation gradients of animal cells differentially power cholesterol transport at two crucial steps in the Hedgehog pathway.
Keywords: Hedgehog, cholesterol transport, cation gradient, RND transporter, cell signaling
In Brief
Petrov, Wierbowski et al. show that eukaryotic RND proteins Dispatched1 and Patched1, key regulators of the Hedgehog developmental signaling pathway, are transporters powered by distinct ion gradients across the plasma membrane: Dispatched1 uses Na+ to catalyze cholesterol-modified Sonic hedgehog secretion, while Patched1 uses K+ to antagonize Smoothened activation by cholesterol.
Graphical Abstract
Introduction
The Hedgehog (Hh) signaling pathway is essential in embryogenesis of most metazoans (Ingham and McMahon, 2001; Lum and Beachy, 2004), while aberrant Hh activity is responsible for several cancers, including basal cell carcinoma and medulloblastoma (Rubin and de Sauvage, 2006). When the Hh pathway is not stimulated, the membrane protein Patchedl (PTCH1) (Nakano et al., 1989) inhibits the GPCR-like protein Smoothened (SMO) (Alcedo et al., 1996; van den Heuvel and Ingham, 1996), thus ensuring that the downstream Hh pathway is idle. Signaling is initiated by a secreted Hedgehog ligand, such as the vertebrate prototype, Sonic hedgehog (SHH) (Chang et al., 1994; Echelard et al., 1993; Krauss et al., 1993; Riddle et al., 1993). SHH binds and inhibits PTCH1, causing SMO to become active. Active SMO then triggers activation of the downstream zinc finger GLI proteins (Humke et al., 2010; Tukachinsky et al., 2010), which turn on transcription of specific target genes.
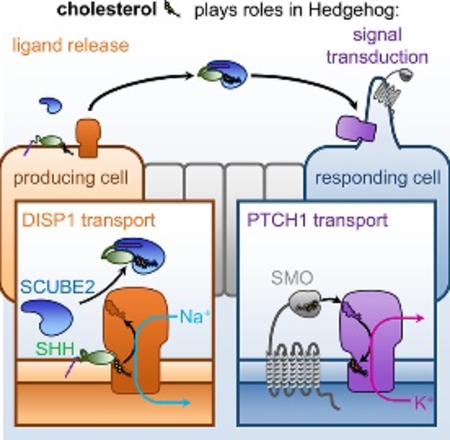
A unique aspect of Hh signaling is the critical involvement of cholesterol at two distinct steps (Fig.1A). First, in signal-producing cells, cholesterol is covalently attached to SHH (Porter et al., 1996), causing it to strongly associate with membranes; thus cholesterol is crucial for regulating SHH production and distribution. Second, in responding cells, cholesterol activates SMO (Huang et al., 2016; Luchetti et al., 2016) by binding to its extracellular cysteine-rich domain (CRD) (Byrne et al., 2016; Huang et al., 2016; Myers et al., 2013; Nachtergaele et al., 2013; Nedelcu et al., 2013); thus cholesterol is required for Hh signal transduction (Cooper et al., 2003).
Figure 1.

Reconstitution of DISP1-dependent SHH release in cultured cells
(A) Schematic of the Hh signaling pathway, showing the two RND-related proteins, DISP1 and PTCH1, which play essential roles in SHH ligand release and in signal transduction, respectively.
(B) DISP1 is required for release of SHH as a soluble complex with a SCUBE family protein. Whether DISP1 acts as a catalytic transporter of cholesterylated SHH, and how DISP1 is powered, are open questions.
(C) Wild-type or DISP1 knockout (DISP1KO) HEK293T cells were co-transfected with SHH, HA-tagged SCUBE2, and the indicated EGFP-tagged DISP1 constructs. SHH release into serum-free media was assayed by immunoblotting. SHH is not released in the absence of DISP1, which is reversed by wild-type DISP1, but not by the inactive DISP1-NNN mutant. Arrowheads indicate the band corresponding to dually lipid-modified SHH.
(D) Schematic of the SHH-NL5 fusion (PDB ID: 6e1h.c and 5ibo).
(E) SHH-NL5 or SHH was stably expressed in HEK293T cells, and release by purified SCUBE2 (500nM) was measured by anti-SHH immunoblotting and densitometry. Released amounts were normalized to the level of SHH species in each cell line. SHH-NL5 and untagged SHH are released with similar kinetics. See also Fig.S1G–J for blots and luminescence measurements.
(F) SHH-NL5 was stably expressed in wild-type or DISP1KO HEK293T cells, and SHH-NL5 release by purified SCUBE2 (300nM) into serum-free media was measured by luminescence. SHH-NL5 release by bovine serum albumin (BSA, 300nM) served as negative control. Defective SHH-NL5 release in DISP1KO cells is rescued by expression of wild-type DISP1, but not by the inactive DISP1-NNN mutant. Data represent mean of two biological replicates and error bars show standard deviation around the mean.
See also Figure S1 for characterization of SHH-NL fusions and for recombinant SCUBE2 purification.
Each of the two cholesterol-dependent aspects in Hh signaling involves a protein related to the Resistance–Nodulation–Division (RND) superfamily of transporters (Nikaido, 2018). In signal-producing cells (Fig.1B), the RND-related Dispatched1 (DISP1) (Amanai and Jiang, 2001; Burke et al., 1999; Caspary et al., 2002; Kawakami et al., 2002; Ma et al., 2002; Nakano et al., 2004) is necessary for SHH release in a diffusible form capable of long-distance signaling. DISP1 interacts with the cholesteryl moiety of SHH (Creanga et al., 2012; Tukachinsky et al., 2012), transferring it from the membrane to a secreted SCUBE family protein, such as SCUBE2 (Hollway et al., 2006; Kawakami et al., 2005; Woods and Talbot, 2005). In Hh-responding cells (Fig.4A), PTCH1, itself RND-related, is thought to inhibit SMO by transporting cholesterol. The idea that cholesterol is the PTCH1 substrate is supported by the observation of sterol molecules in recent cryo-EM structures of PTCH1 (Gong et al., 2018; Qi et al., 2018a; Qi et al., 2018b; Qian et al., 2019; Zhang et al., 2018), although the manner and direction of the presumed cholesterol movement are unclear.
Figure 4.

The Na+ gradient is dispensable for PTCH1 function
(A) PTCH1 is required for repressing SMO in Hh-responding cells, by antagonizing SMO activation by cholesterol. It is unknown what powers the essential activity of PTCH1.
(B) Confluent NIH-3T3 cells were serum-starved overnight, to promote ciliogenesis, and were then incubated for 3 hours in normal Tyrode’s media (4KT) or in media in which Na+ was replaced by choline+ (140CholT). Ciliary levels of endogenous SMO were measured by immunofluorescence microscopy. Staining for the cilium-resident protein ARL13B was used to identify cilia. Abolishing the Na+ gradient does not cause SMO ciliary accumulation. The SMO agonist SAG (500nM) causes ciliary accumulation of SMO in the absence of the Na+ gradient. Data show mean of three biological replicates, and error bars show standard deviation around the mean. At least 100 cilia were recorded per replicate.
(C) As in (B), but varying the concentration of choline+ replacing extracellular Na+. Varying the Na+ gradient does not lead to SMO ciliary accumulation. SMO responds to SAG irrespective of Na+ concentration. Data show mean of three biological replicates, and error bars show standard deviation around the mean. At least 100 cilia were recorded per replicate.
(D) As in (B), but measuring fluorescence intensity of endogenous GLI proteins in cilia. Low Na+ does not lead to GLI accumulation in cilia, in contrast to SAG or high extracellular K+ (110KT, see below). At least 300 cilia per condition were measured in a single biological replicate. * p<0.05, unpaired, two-tailed t-test.
(E) As in (B), but replacing extracellular Na+ with NMDG+ (110NMDG-T) or K+. SMO is not recruited to cilia in 110NMDG-T, in contrast to SAG or 110KT.
The RND superfamily includes both prokaryotic and eukaryotic members. Prokaryotic RNDs function as proton (H+)-driven antiporters, in which expulsion of small molecule substrates from the periplasm of Gram-negatives to the extracellular space is coupled with inward H+ flow, from the periplasm into the cytoplasm (Aires and Nikaido, 2005; Delmar et al., 2015; Seeger et al., 2006). Eukaryotic RND-related proteins include Niemann-Pick Disease Protein C1 (NPC1) (Carstea et al., 1997) and NPC1L1 (Davis et al., 2004), which play fundamental roles in cholesterol metabolism, and DISP1 and PTCH1, which are essential for embryonic development. In contrast to bacterial RNDs, however, eukaryotic RND-related proteins remain poorly understood mechanistically. Catalytic substrate transport has not been directly demonstrated for any eukaryotic RND, and, furthermore, it is unknown if and how eukaryotic RNDs are powered by ionic gradients. Two residues required for H+ conductance in bacterial RNDs are conserved and required for DISP1 (Ma et al., 2002) and PTCH1 (Taipale et al., 2002) function; in the case of PTCH1, mutations in these residues cause Gorlin Syndrome, a genetic predisposition to cancers caused by hyperactive Hh signaling (Taipale et al., 2002). However, unlike bacteria, most eukaryotic cells do not maintain an H+ gradient across the plasma membrane, suggesting that eukaryotic RNDs, including DISP1 and PTCH1, perhaps rely on different ionic gradients. A recent report suggested that PTCH1 activity requires Na+ gradient (Myers et al., 2017), but this study was not performed in Hh-responsive cells and did not use a physiological Hh readout, leaving unresolved the issue of how PTCH1 is powered in cells undergoing normal Hh signaling.
Here, we address two major open questions concerning eukaryotic RND-related proteins: do they catalyze substrate transport, and what is their energy source? We start by developing a fast and quantitative assay for DISP1 activity, which we use to demonstrate that DISP1 acts catalytically to transport cholesterylated SHH during its release from cells. We find that the plasma membrane Na+ gradient is absolutely required for DISP1 activity, while the K+ gradient is dispensable; furthermore, increasing the steepness of the Na+ gradient potentiates DISP1 activity. Since cholesterylated SHH is released to the extracellular space while Na+ enters the cell, this indicates that DISP1 functions as a Na+-powered antiporter. In contrast, in the case of PTCH1, we find that its inhibitory effect on SMO requires the K+ gradient, but not the Na+ gradient; this suggests that PTCH1 operates as a K+-powered cholesterol transporter. Both for DISP1 and PTCH1, mutagenesis and functional assays support the role of a cation different from H+. Our results demonstrate catalytic transporter activity for a crucial eukaryotic RND, and show that the two critical steps in the Hh pathway involving cholesterol transport are powered by two distinct monovalent cationic gradients across the plasma membrane.
Results
A quantitative cellular system for DISP1-dependent SHH release
In spite of the critical importance of eukaryotic RND-related proteins, catalytic transporter function has not been directly demonstrated for any of them. To tackle this problem, we focused on developing a biochemical system for measuring DISP1 activity. The choice of DISP1 was based on the following rationales: (1) DISP1 functions at the plasma membrane, thus is immediately accessible to factors added exogenously; (2) the movement of the cholesterylated SHH substrate is well-defined, from the outer membrane leaflet to the extracellular SCUBE2 acceptor; and (3) uniquely among eukaryotic RNDs, DISP1 acts on a cholesterol substrate attached to a protein, which should greatly simplify quantification (Fig.1B).
SHH release by SCUBE2 has been observed in cultured HEK293T cells (Creanga et al., 2012; Tukachinsky et al., 2012), but it is unclear if this process requires endogenous DISP1. We thus generated DISP1 knockout (DISP1KO) HEK293T cells (Fig.S1A), and measured SHH release. As shown in Fig.1C, SCUBE2 did not release SHH from DISP1KO cells, in contrast to the robust release observed in parental wild-type cells. Importantly, SCUBE2-dependent SHH release was fully rescued by transfecting DISP1KO cells with a construct expressing wild-type DISP1, but not the inactive DISP1-NNN mutant (Ma et al., 2002) (Fig.1C), indicating the specificity of the SHH release defect. Thus SHH release from HEK293T cells recapitulates the strict requirement for DISP1 and SCUBE family proteins observed in in vivo studies of the Hh pathway.
In the experiments above, SHH was collected after several hours and then assayed by immunoblotting. To develop a faster and more sensitive system capable of measuring release kinetics, we tagged SHH with the highly active, ATP-independent NanoLuc luciferase (NL) (Hall et al., 2012), as previously done using Renilla luciferase (Ma et al., 2002). The NL tag was introduced internally (Fig.S1B, C), to preserve SHH modification with palmitate at the N-terminus (Chamoun et al., 2001; Pepinsky et al., 1998) and cholesterol at the C-terminus (Porter et al., 1996). A total of nine SHH-NL fusions were generated, with different NL insertion sites into SHH (Fig.S1B, C) (Ma et al., 2002), and were screened for SCUBE2-dependent release from cells. As shown in Fig.S1D, release of three of the SHH-NL fusions was stimulated by SCUBE2 co-expression. The two best-behaved fusions, SHH-NL5 and SHH-NL7, were then tested using purified recombinant SCUBE2 (Fig.S1E). As shown in Fig.S1F, SHH-NL5 and SHH-NL7 were released in a SCUBE2-dependent manner, and could be detected in the culture media by luminescence after much shorter times than SHH detection by immunoblot (Fig.1C). Subsequent experiments were performed using SHH-NL5 (Fig.1D). Significantly, SHH-NL5 was released from cells at similar levels and with the same kinetics as untagged SHH (Fig.1E; Fig.S1G–I), and luminescence and immunoblot measurements of SHH-NL5 were strongly correlated (Fig.S1J). Importantly, SHH-NL5 release from cells requires both DISP1 and SCUBE2 (Fig.1F), indicating its suitability for studying physiological SHH release.
DISP1 catalyzes SHH release from cells
To determine if DISP1 functions as a transporter, we first characterized the kinetics of SHH-NL5 release from cells. To avoid the potentially confounding effect of continued SHH-NL5 production, protein synthesis was blocked with cycloheximide (Fig.2A). Adding a fixed concentration of purified SCUBE2 caused an increase in SHH-NL5 release that was linear with time (Fig.2B, C). Although release by SCUBE2 could be robustly measured after less than 1 minute, strictly linear release continued for the entire 30-minute duration of the experiment (Fig.2B). Furthermore, the 30-minute incubation with SCUBE2 had a negligible effect on cellular SHH-NL5 levels (Fig.S2A, B), indicating that the SHH-NL5 substrate was saturating under these experimental conditions. Similar DISP1- and SCUBE2-dependent initial release rates were observed for SHH(C24A)-NL5, which is cholesterylated but not palmitoylated, consistent with the idea that the SHH cholesterol moiety serves as substrate for DISP1 (Fig.S2C). Together, these results indicate that our system can be used to precisely measure initial rates of DISP1- and SCUBE2-dependent SHH release (Fig.2C).
Figure 2.

DISP1 catalyzes SHH release from cells
(A) Schematic of the release assay. Cells stably expressing SHH-NL5 are washed of serum, and protein synthesis is inhibited by pre-incubation with cycloheximide (CHX). SHH-NL5 release is initiated by addition of purified SCUBE2, and SHH-NL5 in the media is measured at various time points, by NanoLuc luminescence. Bovine serum albumin (BSA) and methyl-β-cyclodextrin (MβCD) serve as controls.
(B) Kinetics of SHH-NL5 release by a fixed concentration of purified SCUBE2 (1μM). SCUBE2 strongly stimulates SHH-NL5 release, while BSA (1μM) has no effect. SHH-NL5 release by SCUBE2 is linear over the 30-minute duration of the experiment. Inset shows SHH-NL5 release can be robustly detected 1 minute after addition of SCUBE2.
(C) SHH-NL5 initial release rates. Data represent slope estimates in (B) with error bars showing standard error of the estimate.
(D) Time course of SHH-NL5 release by different concentrations of purified SCUBE2.
(E) SHH-NL5 initial release rates from the experiment in (D), plotted as function of SCUBE2 concentration. Data represent slope estimates and error bars standard error of the estimate. Data were fit to the Michaelis–Menten equation using least-squares, non-linear regression.
(F) As in (E), but with SHH-NL5 stably expressed in wild-type cells, DISP1KO cells, or cells overexpressing wild-type DISP1. Initial release rates were normalized to SHH-NL5 expression levels in each cell line, and to total cell numbers (total protein) in each experimental condition. SHH-NL5 initial release rates increase with increasing DISP1 levels, while displaying saturation relative to SCUBE2. Curves show fits either to the Michaelis–Menten equation, or to a line in the case of DISP1KO cells. Vertical dotted line shows KM estimate. See also Fig.S2D, E.
(G) Estimates of Vmax for the indicated conditions in (F). Error bars indicate standard error of the estimate.
(H) Estimates of KM for the indicated conditions in (F). Error bars indicate standard error of the estimate. ns. – not statistically significant
(I) as in (F), but with SHH-NL5, DISP1-expressing cells sorted into low- or high-expressers. See also Fig. S2F, G.
(K) as in (G), but with data from (I).
(J) as in (H), but with data from (I).
(L) SCUBE2-dependent SHH-NL5 release as a function of increasing SHH-NL5 levels. Variable amounts of SHH-NL5 were expressed in cells with endogenous DISP1 and initial release rates recorded for low (1μM) and high (10μM) SCUBE2. At high SCUBE2 concentrations, release saturates as a function of SHH-NL5 level, as indicated by good hyperbolic fit (R2=0.998). Inset shows Lineweaver–Burk plot of the data with accompanying linear fits (R2=0.996 and R2=0.995 for low and high SCUBE2 respectively). Data represent rate estimates versus mean SHH-NL5 level. Vertical error bars represent standard error of the estimate; horizontal error bars represent standard deviation of the mean. See also Fig.S2O.
See also Figure S2 for additional characterization of SHH-NL5 release.
Upon titration of purified SCUBE2 added to SHH-NL5-expressing cells, we observed a saturable increase in the initial rate of SHH-NL5 release (Fig.2D, E). Importantly, though the rate of release saturated, SHH-NL5 release did not, in accord with our finding that cellular SHH-NL5 levels were not limiting (Fig.S2A, B). This kinetic behavior is not consistent with a simple SHH–SCUBE2 binding equilibrium, where SHH release rate would be a linear function of SCUBE2; it is consistent, however, with an enzymatic process, whereby formation of the SHH–SCUBE2 complex is catalyzed by a saturable (i.e. rate-limiting) enzyme. Indeed, the rate of SHH-NL5 release is fit well by a simple Michaelis-Menten equation (R2 =0.9954), with the KM in the low micromolar range of SCUBE2 (Km~3μM) (Fig.2E; see STAR Methods).
We next asked if DISP1 is the enzyme catalyzing SHH release. To this end, we compared the rate of SCUBE2-dependent SHH-NL5 release from cells expressing different levels of DISP1 (Fig.2F–K; Fig.S2H–K). DISP1 was titrated either by expressing additional DISP1 on top of endogenous DISP1 (Fig.2F–H; Fig.S2D, E), by isolating low and high DISP1-expressing cells by fluorescence-activated sorting (Fig.2I–K; Fig.S2F, G), or by expressing DISP1 by transient transfection of DISP1KO cells (Fig.S2H–K). In all cases, the rate of SHH-NL5 release was potentiated by increasing DISP1 levels, and was saturable by SCUBE2 (Fig.2F, I; Fig.S2H). Crucially, increasing DISP1 levels increased the maximal rate of SHH-NL5 release (Vmax) (Fig.2G, J; Fig.S2I), but not the KM, which remained 2–3μM (Fig.2H, K; Fig.S2J); this result strongly implies that DISP1 catalyzes SHH release (see STAR Methods). SHH-NL5 release by DISP1 and SCUBE2 is in stark contrast to SHH-NL5 release by methyl-β-cyclodextrin (MβCD), a sterol-binding cyclic oligosaccharide that efficiently solubilizes cholesterylated SHH from membranes (Tukachinsky et al., 2012). SHH-NL5 release by MβCD was DISP1-independent (Fig.S2L–N), and the rate was a linear function of MβCD concentration, as expected for an uncatalyzed process. Furthermore, SHH-NL5 release by MβCD was more than an order of magnitude slower, pointing to the specificity of the DISP1–SCUBE2 system for SHH transport.
Finally, if DISP1 acts as an enzyme to catalyze SCUBE2-dependent SHH release, we would expect the formation of a DISP1–SHH–SCUBE2 ternary complex, which predicts release rate saturation at high concentrations of SCUBE2 and SHH-NL5 (see STAR Methods). To test this, we titrated SHH-NL5 expression by transient transfection in cells with endogenous DISP1 (Fig.S2O), and measured the rate of SHH-NL5 release at low (1μM) and high (10μM) SCUBE2 (Fig.2L). Importantly, at high SCUBE2 concentrations the rate saturated as a function of SHH-NL5. These data are further consistent with DISP1 enzymatic activity and suggest the formation of a ternary DISP1–SHH–SCUBE2 complex. Together, these results indicate that DISP1 catalyzes release of SHH from cells.
The transmembrane Na+ gradient is necessary for DISP1 activity
Given the homology between DISP1 and bacterial RND transporters, we asked whether SHH transport by DISP1 is powered by a cation gradient at the plasma membrane. Na+ and K+ are the two monovalent cations with appreciable concentration gradients across the plasma membrane of metazoan cells; at rest, Na+ concentration is high outside the cell and low inside, while K+ concentration shows the opposite distribution (Fig.3A). We first measured SHH-NL5 release in cells treated with gramicidin, a pore-forming antibiotic specific for monovalent cations, which abolishes both Na+ and K+ gradients. As shown in Fig.3B, the SHH release rate was greatly reduced by gramicidin; importantly, gramicidin did not affect cell viability (Fig.S3A) over the course of the experiment. A similar result was observed when cells were incubated in isotonic media in which Na+ was replaced with K+ (Table S1), a treatment that also diminishes both Na+ and K+ gradients (Fig.3B). Importantly, the H+-specific ionophore carbonyl cyanide 3-chlorophenylhydrazone (CCCP), which equilibrates H+ gradients across membranes, had a minimal effect on SHH release (Fig.S3B), thus excluding H+ as a potential driver of DISP1 activity. Together, these results suggest that a monovalent, non-H+ cation gradient is necessary for SHH release, although they do not identify which ion is involved.
Figure 3.

The Na+ gradient drives DISP1-catalyzed SHH release
(A) Schematic of Na+ and K+ gradients at the plasma membrane in resting mammalian cells.
(B) Cells stably expressing SHH-NL5 were incubated with SCUBE2 (1μM), in normal Tyrode’s media (4KT), 4KT supplemented with gramicidin (2μg/mL), or media with high K+ and low Na+ (Tyrode’s containing 125 mM KCl, 125KT), and SHH-NL5 release was measured. Protein synthesis was inhibited with CHX (100μg/mL). Dissipating Na+ and K+ gradients with gramicidin or 125KT inhibits SHH-NL5 release. Data represent rate estimates with error bars showing the standard error of each estimate.
(C) As in (B), but with incubation in Tyrode’s media in which Na+ is replaced with K+, Cs+, or choline+. Replacement of extracellular Na+ inhibits SHH-NL5 release in a dose-dependent manner, indicating that the Na+ gradient is required for DISP1 activity. Electrochemical driving force (EDF) was calculated as described in STAR Methods. Data represent rate estimates; error bars are small and obscured, but indicate the standard error of each estimate.
(D) Decreasing extracellular Na+ concentration causes rapid and reversible inhibition of SHH-NL5 release. SCUBE2-dependent SHH-NL5 release was measured as in (B), from cells successively incubated in media with physiological Na+ (4KT), then with low Na+ and high choline+ (140ChoT), and finally with physiological Na+ again (Well B). In parallel, cells were incubated successively only in media with physiological Na+ (Well A), or only in media with low extracellular Na+ (Well C). Data represent rate estimates with error bars showing the standard error of each estimate.
(E) As in (B), but with incubation in media with varying Na+ concentration. Equal osmolarity was maintained with addition of either Cs+ or choline+. SHH-NL5 release is accelerated by a steeper than normal Na+ gradient. Data represent rate estimates; error bars are small and obscured, but indicate the standard error of each estimate. Curves show linear fits with associated R2 values. Vertical dotted lines indicate the physiological value of EDFNa+.
(F) As in (E), but using SHH-NL5-expressing DISP1KO cells. SHH-NL5 release is not accelerated by a steeper Na+ gradient in the absence of DISP1.
(G) As in (E), but using MβCD (1mM) or BSA (5μM) instead of SCUBE2. SHH-NL5 release is not accelerated by a steeper Na+ gradient in the absence of SCUBE2.
(H) As in (E), but with L cell stably expressing WNT3A-NL, and measuring WNT3A-NL release into media containing 2% FBS. WNT3A-NL release is unaffected by changes in the Na+ gradient. WNT3A-NL faithfully mimics serum- and palmitoylation-dependent release of untagged WNT3A (see Fig.S3K, L).
(I) As in (E), but with incubation in media with varying K+ concentration, and constant Na+ gradient. The rate of SHH-NL5 release is unaffected by changes in the K+ gradient.
See also Figure S3 for additional experiments demonstrating the role of the Na+ gradient and for additional controls.
To test the possible role of the Na+ gradient, we measured SHH-NL5 release from cells incubated in defined low-Na+ media, adjusted to isotonicity with the chloride salts of the cations K+, Cs+, choline+, or N-methyl-D-glucamine (NMDG+) (Table S1). In all cases, we observed a dose-dependent decrease in the release rate with decreasing extracellular Na+ (Fig.3C; Fig S3C, D). This effect cannot be attributed to decreases in the membrane potential because Cs+, choline+, and NMDG+ ions are not membrane-permeant at short timescales, and thus do not depolarize the cells, as high extracellular K+ does (Fig.S3E). Importantly, the observed effect was not caused by cellular toxicity, as shown by measurements of cellular ATP levels (Fig.S3F), and of NAD(P)H levels (Fig.S3G). Furthermore, inhibition of Na+-dependent SHH-NL5 release was rapidly reversible: release rate was greatly reduced upon replacement of extracellular Na+ with choline+, and then quickly recovered (<1min) when cells were returned to media with high extracellular Na+ (Fig.3D). Finally, DISP1-independent SHH-NL5 release by MβCD occurred normally in low-Na+ media (Fig.S3H), indicating that the SHH-NL5 substrate remains accessible to extracellular factors, on the cell surface. Together, these results indicate that the Na+ gradient is required for DISP1-dependent SHH release.
The Na+ gradient drives SHH release from cells
The acute response of SHH release to transient perturbations of the Na+ gradient (Fig.3D) suggests that perhaps Na+ directly drives the function of DISP1. One implication of this hypothesis is that the rate of SHH release should be potentiated by a steeper than normal Na+ gradient across the plasma membrane. To test this prediction, we measured Vmax for SHH release when extracellular Na+ concentration was increased above normal. Since the Na+ concentrations that we tested cause the media to be slightly hypertonic (370 mOsm), all media used in this experiment were adjusted to the same osmolarity, using either choline+ or Cs+ cations instead of Na+. Vmax was measured by adding saturating levels of purified SCUBE2 (15μM, corresponding to ~5 times the KM value). Strikingly, increasing the strength of the Na+ gradient accelerated SHH-NL5 release, with the rate displaying a linear (R2 >0.999) dependence on the Na+ electrochemical driving force (EDFNa+) (Fig.3E). Significantly, media in which Na+ was replaced with choline+ do not exhibit changes in membrane potential (Fig.S3I), thus excluding membrane potential change as cause of the accelerated SHH release. We were unable to detect DISP1- and SCUBE2-dependent uptake of radioactive 22Na+ into cells (Lee, 1984a, b); perhaps the DISP1 turnover number is too low relative to background ion fluxes across the plasma membrane.
We performed several experiments to test the specificity of Na+ perturbations on DISP1- and SCUBE2-dependent SHH-NL5 release. First, we assayed the effect of Na+ gradient change on residual SHH-NL5 release from DISP1 deficient (DISP1KO) cells (Fig.3F). Second, we assayed the effect of Na+ gradient change on SHH-NL5 release by MβCD, which is SCUBE2-independent (Fig.3G). Third, we assayed the effect of Na+ gradient change on the release of NL-tagged WNT3A, a lipidated Wnt family ligand unrelated to SHH (Fig.3H; Fig.S3J–L). Finally, we assayed the effect of K+ gradient change on DISP1- and SCUBE2-dependent SHH-NL5 release, using hypertonic media in which Na+ was maintained at physiological levels, but extracellular K+ was varied (Fig.3I). In none of these experiments did we observe changes in the release rate of either SHH or WNT3A. Together, these results indicate that the Na+ gradient specifically drives DISP1- and SCUBE2-dependent release of SHH, consistent with DISP1 being powered by Na+ influx.
The transmembrane Na+ gradient is not required for PTCH1 activity
We next asked if and how PTCH1, the other RND-related protein involved in Hh signaling, might also act as a cation-driven transporter, a longstanding hypothesis in the field (Ingham et al., 2000; Taipale et al., 2002). In the absence of SHH, PTCH1 localizes to primary cilia (Rohatgi et al., 2007) and prevents accumulation of SMO in cilia. Upon binding SHH, PTCH1 is inhibited and removed from cilia. This results in SMO activation and accumulation in cilia (Corbit et al., 2005), leading to ciliary recruitment and activation of GLI-family transcription factors (Humke et al., 2010; Tukachinsky et al., 2010), which ultimately turn on transcription of Hh target genes, such as Gli1 (Fig.4A). Since SMO is the most proximal downstream target of PTCH1, and SMO accumulation in cilia is the fastest readout for Hh pathway activation, we used it to measure PTCH1 activity and its sensitivity to cation gradient perturbations. In some instances, we used additional readouts of SMO and Hh pathway activation, namely ciliary accumulation of GLI proteins and transcription of the Hh target gene, Gli1.
SMO and downstream Hh signaling were not activated when the Na+ gradient was abolished by incubating cells in media in which Na+ was replaced with choline+ (Fig.4B–E), or NMDG+ (Fig.4E); this shows that, in the absence of the Na+ gradient, SMO is efficiently repressed, thus PTCH1 is active. Importantly, even in the absence of the Na+ gradient, the cells retained their ability to robustly activate Hh signaling in response to the small-molecule SMO agonist, SAG (Chen et al., 2002) (Fig.4B–E). Thus, in contrast to DISP1, the Na+ gradient is not required for PTCH1 function.
The transmembrane K+ gradient is necessary for PTCH1 activity
Dramatically, replacing extracellular Na+ with K+ or Rb+ caused Hh pathway activation in NIH-3T3 cells, as indicated by ciliary accumulation of SMO (Fig.5A, B; Fig.S4A) and GLI proteins (Fig.5C; Fig.S4B), and stimulation of Gli1 transcription (Fig.5D). In all cases, the small-molecule SMO antagonist, SANT-1 (Chen et al., 2002), reversed these effects (Fig.5A, C, D; Fig.S4B), indicating that Hh pathway activation was SMO-dependent. SMO activation by high extracellular K+ was also observed in mouse embryonic fibroblasts (MEFs) (Fig.S4C). Together, these results suggest that the K+ gradient might be required for PTCH1 function.
Figure 5.

The K+ gradient is necessary for PTCH1 function
(A) Ciliated NIH-3T3 cells were incubated for 3 hours in media with either low (4KT, 4RbT) or high (110KT, 110RbT) K+ or Rb+, and endogenous SMO at cilia was measured by immunofluorescence. High K+ or Rb+ lead to SMO accumulation in cilia, which is reversed by the SMO antagonist, SANT-1 (1μM). SAG (500nM) was used as positive control. Data represent mean of at least two biological replicates; error bars show standard deviation around the mean. At least 100 cilia were assayed per replicate. * p<0.05, unpaired, two-tailed t-test.
(B) As in (A), but with incubation in isotonic media in which Na+ is replaced with various concentrations of monovalent cations (Li+, K+, Rb+, Cs+). Hill equation curves with Hill slope of 3 and maximum value of 100% were fit to the data. Data represent mean of at two biological replicates; error bars show standard deviation around the mean. At least 100 cilia were assayed per replicate.
(C) As in (A), but measuring endogenous GLI proteins in cilia. GLI proteins are recruited to cilia in media with high extracellular K+ (110KT), which is reversed by SANT-1. The Hh pathway activators SHH and SAG were used as positive controls. At least 250 cilia were assayed per treatment condition in a single biological replicate. * p<0.001, one-way ANOVA.
(D) As in (A), but measuring transcription of Gli1 by quantitative RT-PCR, after incubation for 3 and 6 hours. Gli1 transcription is activated in 110KT media, which is reversed by SANT-1. SHH was used as positive control.
(E) Reducing the K+ gradient causes reversible inhibition of PTCH1. NIH-3T3 cells were stimulated overnight with SHH, after which they were chased in media of varying K+ concentration, and ciliary SMO was measured at different times. Ciliary SMO levels drop quickly in 4KT media, but persist in 110KT, in which PTCH1 is inactive. Switching cells from 4KT to 110KT inhibits PTCH1 and thus SMO removal from cilia, which is reactivated by switching back to 4KT media. At least 250 cilia were assayed per condition in a single biological replicate.
(F) Ciliated NIH-3T3 cells stably expressing EGFP-tagged PTCH1 were incubated for 3 hours in the indicated media, in the presence or absence of SHH, and PTCH1 levels in cilia were measured by immunofluorescence. High levels of extracellular K+, Rb+, or Cs+ do not perturb SHH-induced removal of PTCH1 from cilia. PTCH1 fluorescence intensity at cilia is shown as box-and-whisker plots for a single biological replicate. The dotted line shows the threshold used to compute the percent PTCH1-positive cilia (Fig.S4D). At least 100 cilia were assayed per condition.
See also Figure S4 for additional experiments demonstrating the role of the K+ gradient in Hh signaling
We also tested whether reducing the K+ gradient inhibits PTCH1 reversibly. Hh signaling was activated with SHH, which caused accumulation of SMO in cilia (Fig.5E). SHH was then washed out, and we measured the decay of ciliary SMO, a process dependent on PTCH1 activity. As shown in Fig.5E, ciliary SMO was removed from cilia in media of normal ionic composition, but not in high K+ media. Importantly, PTCH1 activity was recovered when cells were switched from high to low K+, indicating that the inhibitory effect is reversible.
The treatments above alter not only the K+ gradient, but have other effects on cells, including possible perturbations of ciliary trafficking, energy metabolism, Ca2+ levels, and resting membrane potential (Em). To exclude the possibility that one of these perturbations might have caused SMO activation, we performed a number of control experiments. First, we assayed the effect of high extracellular K+ or Rb+ on ciliary trafficking, by measuring PTCH1 removal from cilia upon SHH binding, as well as by assaying the constitutive ciliary localization of serotonin receptor 6 (HTR6). High K+ or Rb+ allowed normal SHH-induced PTCH1 exit from cilia (Fig.5F; Fig.S4D), while high K+ did not change ciliary HTR6 levels (Fig.S4E). These results indicate that high extracellular K+ or Rb+ do not generally perturb ciliary trafficking.
Second, we measured cellular ATP levels in cells incubated with high extracellular K+ or Rb+. We found that high extracellular K+ or Rb+ reduced cellular ATP by 40–50% compared to low extracellular K+ (Fig.S3F). We speculate that reduction in cellular ATP may be responsible for the blunted pathway activation that we observe with these treatments; however, it is not sufficient to explain the observed pathway activation.
Third, we investigated whether divalent cations, Ca2+ and Mg2+, affect SMO ciliary dynamics, and whether they are required for SMO activation in the presence of high extracellular K+ or Rb+. By incubating cells in media lacking extracellular Ca2+ and Mg2+, we observed that extracellular pools of Ca2+ and Mg2+ are dispensable for SMO inhibition by PTCH1, for SMO activation in response to SHH, as well as for SMO activation by high levels of extracellular K+ and Rb+ (Fig.S4F). These data suggest that any putative Ca2+ and Mg2+ fluxes are not necessary for SMO inhibition by PTCH1.
Fourth, we asked if membrane depolarization caused by high extracellular K+ or Rb+ (Fig.S3E), rather than a decrease in K+ gradient, is the cause of SMO activation. Treating cells with the sodium channel agonist veratridine, which depolarizes cells without collapsing the K+ gradient (Fig.S4G), led only to a very slight increase in ciliary SMO (Fig.S4H); thus, cellular depolarization cannot account for SMO activation by high K+ and Rb+.
Finally, we discovered that cesium ions (Cs+) cause dose-dependent accumulation of SMO in cilia (Fig.5B; Fig.S4A, I), which was reversed by SANT-1 (Fig.S4I). Cs+ was also more potent than K+ or Rb+ in activating SMO (Fig.5B; Fig.S4I). Cs+ did not perturb PTCH1 ciliary trafficking (Fig.5F; Fig.S4D), cellular ATP levels (Fig.S3F), and did not depolarize cells (Fig.S3E), consistent with a specific inhibitory effect on PTCH1. Interestingly, Cs+ does not collapse the K+ gradient, suggesting a different explanation for its effect. We note that the potency of PTCH1 inhibition increases as function of van der Waals radius for K+, Rb+ and Cs+ (Fig.S4J); we speculate that Cs+, and to a lesser extent Rb+, might inhibit PTCH1 by occluding a putative cation-conducting pore in PTCH1.
A possible mechanism for cation-dependent DISP1 and PTCH1 function
We used structure-guided mutagenesis and functional assays to probe the role of cations in DISP1 and PTCH1 function. Homology between DISP1, PTCH1, and H+-powered bacterial RNDs is highest within their transmembrane (TM) domains. In particular, there is striking conservation of three sets of polar residues within helices TM4, TM10 and TM11 (Fig.6A). In AcrB (Murakami et al., 2006; Seeger et al., 2006), these residues form an alternating hydrogen-bonding network (Fig.6B). In the absence of protons, the two neighboring aspartate residues in TM4 (D407 and D408) are ionized and coordinate the ε-amino group of the lysine residue in TM10 (K940). In the presence of protons, the glutamic acid residues in TM4 are titrated, and the ε-amino group of the lysine in TM10 now interacts with the serine and threonine residues in the neighboring TM11 (T978 and S979). By altering the hydrogen-bonding network of these TM-resident residues, AcrB couples proton binding to conformational changes that enable substrate pumping (Pos, 2009). Consistent with this mechanism, the three sets of polar residues are necessary for AcrB function (Su et al., 2006; Takatsuka and Nikaido, 2006).
Figure 6.

A conserved cation-sensitive network necessary for DISP1 and PTCH1 function
(A) Sequence alignment of DISP1, PTCH1, and E. coli AcrB and AcrD. TM helices are shown as yellow boxes, with red dots indicating polar residues necessary for DISP1, PTCH1 and AcrB function.
(B) Proton-dependent conformational changes in AcrB (PDB ID: 2gif). TM4-resident D407 and D408 residues alternate between being deprotonated and bound to the TM10-resident K940 (left), and being protonated and with K940 bound to T978/S979 in TM11 (right).
(C) Proposed model of cation-dependent conformational switching in DISP1 and PTCH1. TM10 hosts an aspartate in DISP1 and glutamate in PTCH1, instead of a lysine. This suggests that the deprotonated acidic residues in TM4 and TM10 form a cation-binding site. In the absence of cation, the first TM4 aspartate binds to the S/T cluster in TM11, to effect conformational change. Residue numbers are for mouse DISP1 and PTCH1.
(D) TM-resident polar residues in DISP1 are necessary for SHH release. DISP1KO HEK293T cells stably expressing SHH-NL5 were stably rescued with DISP1 mutants, and SCUBE2-dependent SHH-NL5 release was measured. Protein synthesis was inhibited with CHX (100μg/mL). Data show estimate of release rate normalized to DISP1 and SHH-NL5 levels in single biological replicate; error bars represent combined standard error and standard deviation around the mean.
(E) TM-resident polar residues in PTCH1 are necessary for SMO repression. PTCH1 mutants were stably expressed in Ptch1−/− MEFs, and their ability to reduce ciliary levels of endogenous SMO was assayed by immunofluorescence. SAG (500nM) and SANT-1 (1μM) served as positive and negative control, respectively. Error bars represent standard deviation around the mean of two biological replicates. At least 100 cilia were assayed per replicate. * p<0.01, unpaired, two-tailed t-test.
(F) As in (D), but HEK293T cells stably expressing SHH-NL5 were incubated with SCUBE2 (lμM), in modified Tyrode’s media with high Na+, choline+ or Cs+, buffered to different pH values. SHH-NL5 release is potentiated by increasing pH, but only if the Na+ gradient is present. Error bars are obscured, but indicate standard error of the estimate in single replicate.
See also Figure S5 for evidence of an alternating hydrogen-bonding network in PTCH1, similar to AcrB. See also Figure S6 for characterization of cells used for DISP1 and PTCH1 mutant analysis.
While DISP1 and PTCH1 both contain the TM4-resident aspartate found in bacterial RNDs, they lack the opposing, TM10-resident lysine; instead this residue is replaced with an acidic one, either aspartate in DISP1 or glutamate in PTCH1 (Fig.6A). We hypothesize that the triad of acidic residues in TM4 and TM10 of DISP1 and PTCH1 forms a cation-binding pocket, such that, in the cation’s presence, a salt bridge forms between TM4 and TM10, analogous to the link between TM4 and TM10 in unprotonated AcrB (Fig.6C). Upon cation dissociation, the negative charge of these residues would lead to electrostatic repulsion and dissolution of the salt bridge, and formation of a hydrogen bond between the first TM4 aspartate of DISP1 and PTCH1 and the TM11 serine/threonine cluster (Fig.6C). At least for PTCH1, evidence of such an alternating hydrogen-bonding network can be found in recent cryo-EM structures (Fig.S5).
The prediction of this model is that this set of polar residues would be necessary for DISP1 and PTCH1 function. This was shown for the TM4 aspartate residues in both DISP1 (Ma et al., 2002) and PTCH1 (Taipale et al., 2002). Additionally, we find that the TM11 serine/threonine cluster is absolutely required for DISP1 (Fig.6D; Fig.S6A, B) and PTCH1 (Fig.6E; Fig.S6C) function. In accordance with the proposed mechanism (Fig.6C), introduction of a lysine residue (i.e. non-dissociating cation) within the TM4–TM10–TM11 network drastically inhibits both DISP1 (Fig.6D; Fig.S6A, B) and PTCH1 (Fig.6E; Fig.S6C). Finally, we find that low pH inhibits, while high pH potentiates DISP1 activity (Fig.6F), an effect that can be explained by protonation of TM-resident acidic residues inhibiting cation coordination. The observed pH dependence is consistent with the calculated pKa values (Kilambi and Gray, 2012) of the three TM-resident acidic residues in DISP1 (3.8, 3.5, and 4.1, for D571, D572, and D1049 respectively). A similar effect has been observed for the Na+-powered human choline symporter (hCHT) (Iwamoto et al., 2006). Together, these data support DISP1 and PTCH1 as transporters powered by non-H+ cations, and point to a possible mechanism for how cation-induced conformational changes in the TM domain are translated into substrate pumping.
Discussion
Among signaling pathways that orchestrate animal embryogenesis, the Hh pathway stands out for the critical role played by cholesterol, at two different steps. First, cholesterol is covalently attached to SHH, a unique modification catalyzed by the C-terminal domain of the SHH precursor (Porter et al., 1996). Second, the GPCR-like protein SMO, which conveys signals to the cytoplasm, is directly activated by cholesterol (Huang et al., 2016; Luchetti et al., 2016). In both instances, the pathway employs RND-related proteins: DISP1 interacts with cholesterylated SHH and hands it off to an extracellular SCUBE family protein (Creanga et al., 2012; Tukachinsky et al., 2012), resulting in SHH morphogen release, while PTCH1 interacts with cholesterol and antagonizes SMO, thus repressing Hh signal transduction. Two important open questions are whether eukaryotic RND-like proteins, such as DISP1 and PTCH1, function as transporters, and what is the energy source that powers them. Prokaryotic RNDs use the H+ gradient across the plasma membrane (Fig.7A), which does not exist in most eukaryotic cells. Here, we directly demonstrate transporter activity for a eukaryotic RND-like protein, DISP1. We then show that DISP1 is powered by the Na+ gradient at the plasma membrane, while the K+ gradient is dispensable (Fig.7B). Interestingly, we find that PTCH1 displays the opposite behavior: the K+ gradient is necessary for its activity in Hh signaling, but the Na+ gradient is dispensable (Fig.7C, D). Thus Na+ and K+, the two monovalent cations that form substantial gradients across the plasma membrane of animal cells, are used to power DISP1 and PTCH1, respectively. In spite of diverged cation specificity, however, the mechanism by which cation binding is translated into substrate pumping appears conserved between DISP1, PTCH1 and prokaryotic RNDs, as indicated by our functional studies.
Figure 7.

RND-catalyzed cholesterol transport in the Hh pathway
(A) Schematic of the prototypical prokaryotic H+-powered RND transporter, E.coli AcrB.
(B) DISP1 functions as a Na+-powered antiporter, transporting cholesterylated SHH from the outer leaflet of the plasma membrane and handing it off to extracellular SCUBE2.
(C, D) Two possible modes of K+-powered cholesterol transport by PTCH1. In (C), PTCH1 moves cholesterol between the two leaflets of the membrane, making it unavailable for SMO activation. In (D), PTCH1 transports cholesterol from SMO to the membrane, thus catalyzing SMO deactivation.
Past investigations of DISP1 (Creanga et al., 2012; Tukachinsky et al., 2012) lacked the sensitivity and temporal resolution needed to address the role of ion gradients. We therefore developed a fast and sensitive NanoLuc luciferase assay, inspired by an earlier Renilla luciferase assay (Ma et al., 2002), which allowed us to directly study the kinetics of SHH substrate release by DISP1 and purified SCUBE2, in media of defined ionic composition. Our measurements indicate that DISP1 is a transporter quantitatively described by Michaelis–Menten kinetics, with a catalytic rate constant (kcat) that is a function of the transmembrane Na+ gradient. Strikingly, a steeper Na+ gradient increases kcat and accelerates SHH release, indicating that the Na+ gradient directly controls DISP1.
Why would DISP1 need energy to catalyze SHH release, given that SHH is likely more concentrated on the membrane than in the extracellular space? We speculate that the cholesteryl anchor of SHH is strongly attached to membrane lipids, resulting in high activation energy for direct SHH transfer to SCUBE2. To catalyze SHH transfer, DISP1 would not only need to provide a pathway for the cholesteryl anchor to SCUBE2, but also to overcome the binding energy between anchor and membrane. Importantly, energy consumption would ensure that SHH transfer by DISP1 is unidirectional. Similar considerations apply for energy utilization during cholesterol transport by PTCH1 (see below).
The present kinetic data and previous crosslinking experiments using SHH modified with photoreactive cholesterol analogues (Tukachinsky et al., 2012), are consistent with the formation of a DISP1–SHH–SCUBE2 complex. SHH transfer from DISP1 to SCUBE2 resembles, in reverse, the transfer of cholesterol between the soluble NPC2 protein and NPC1 (Infante et al., 2008), for which a stable NPC1–NPC2 interaction has been observed (Deffieu and Pfeffer, 2011). We have so far been unable to detect DISP1–SCUBE2 binding, even in presence of SHH, possibly because such an interaction is transient. Further studies will be necessary to dissect SHH transfer from DISP1 to SCUBE2, and to capture and structurally characterize a possible ternary complex.
Unlike DISP1, the mode and direction of cholesterol transport by PTCH1 are unclear (see below). Thus, instead of directly assaying substrate transport by PTCH1, we measured PTCH1 activity using endogenous downstream readouts of the Hh pathway, primarily the activity state of SMO. We find that PTCH1 represses SMO efficiently and keeps the Hh pathway off even when the Na+ gradient is abolished, in contrast to DISP1. Strikingly, abolishing the K+ gradient leads to PTCH1 inhibition and Hh pathway activation, as assayed by SMO and GLI recruitment to primary cilia, and activation of target gene transcription. Importantly, other effects can be excluded as the cause of Hh pathway activation, including membrane depolarization, energy metabolism, or effects on ciliary trafficking. These results indicate that the K+ gradient powers PTCH1 activity.
Our observation that the Na+ gradient is dispensable for SMO repression by PTCH1 contrasts with a recent report claiming that PTCH1 activity requires the Na+ gradient (Myers et al., 2017). Although the reason for this discrepancy is not clear, it might be due to one of several differences in experimental design. We used MEFs that display robust cilia-dependent Hh signaling, while the other study used HEK293T cells, which lack endogenous Hh signaling. We assayed endogenous SMO, while the other study assayed truncated SMO fused to Gai, a construct of unclear physiological relevance in Hh signaling. Finally, we used physiological readouts of SMO activation, while the other study measured the reduction of forskolin-enhanced cAMP levels.
Our results clarify the relationship between the direction of substrate transport and ion flow in eukaryotic RND-related proteins. In the case of DISP1, cholesterylated SHH is transported from the membrane to the extracellular space, while Na+ ions flow along their concentration gradient, from the extracellular space inward. Thus DISP1 is a Na+/SHH antiporter, similar to bacterial RNDs, which are H+/substrate antiporters, pumping substrates out of the cell while H+ ions flow inward.
In the case of PTCH1, the pathway of cholesterol transport remains unresolved, a question with important implications for the mechanism of SMO repression. One suggestion is that PTCH1 moves cholesterol from the inner to the outer leaflet of the plasma membrane (Zhang et al., 2018); however, the imaging method for measuring cholesterol used in this study has been questioned, due to its strong dependence on the phospholipid composition of the membrane (Courtney et al., 2018). If PTCH1 is an antiporter, the fact that it is powered by the K+ gradient implies that it must transport cholesterol toward the cell, while K+ ions flow outward; this is similar to how cholesterol movement occurs in the NPC2–NPC1 system, from the lysosomal lumen into the limiting membrane. For a PTCH1 K+/cholesterol antiporter, we envision two possibilities: PTCH1 moves cholesterol from the outer to the inner leaflet of the membrane (Fig.7C), or PTCH1 accepts cholesterol directly from SMO, perhaps from the CRD, and transports it to the outer leaflet of the membrane (Fig.7D). The former model implies that PTCH1 prevents SMO activation by cholesterol, for example by lowering cholesterol concentration in the ciliary membrane. In contrast, the latter model implies that PTCH1 catalyzes deactivation of cholesterol-bound SMO. We note that cholesterol transport postulated by this latter model is consistent with recent cryo-EM studies (Gong et al., 2018; Qian et al., 2019), in which sterol densities are observed both in the extracellular domain and in an outer leaflet-proximal groove of PTCH1, suggesting a conduit from SMO to the membrane. An attractive aspect of this model is that it explains the specificity of PTCH1 for SMO and the Hh pathway, in contrast to a model in which PTCH1 transports cholesterol independent of SMO. Another implication of this model is that SMO can bind cholesterol early in the secretory pathway, and PTCH1 would remove it only when SMO reaches the cilium. Importantly, even though cholesterol-bound SMO might adopt an active conformation outside the cilium, it would not trigger Hh signaling, as that requires the presence of cilia-localized pathway components. Functional experiments will be required to elucidate this important aspect of the PTCH1–SMO interaction.
A useful estimate is that of the free energy that transmembrane Na+ and K+ gradients can provide for cholesterol transport by DISP1 and PTCH1, respectively. The power of an ionic gradient is expressed as Gibbs free energy, which can be calculated according to equation (1):
| (1) |
where z is the ion charge, F is the Faraday constant, and EDFion is the electrochemical driving force. In a typical fibroblast (Em=−54mV, [Na+]out = 150mM and [Na+]in = 15mM) the Na+ gradient has an EDFNa+=−115mV, which translates into ~11kJ/mol of free energy available for Na+-powered transport by DISP1. In the case of PTCH1, we must consider that it functions at the ciliary membrane (Rohatgi et al., 2007), which has electrophysiological properties slightly different from the plasma membrane (Delling et al., 2013); specifically, at the primary cilium, Em=−20mV, [K+]out = 4mM and [K]in = 70mM. These parameters yield an EDFK+= 54mV, corresponding to ~5.2 kJ/mol of free energy available for K+-powered cholesterol transport by PTCH1. To put these free energy values in perspective, we consider the Na+-powered glucose symporter SGLT2 (Coady et al., 2017) and the Na+-powered choline symporter hCHT (Iwamoto et al., 2006). These proteins transport one Na+ ion per substrate molecule, and voltage-current studies show that an EDFNa+> 5kJ/mol Na+ is sufficient to power these transporters. Thus, the energy supplied by the plasma membrane Na+ gradient, or by the ciliary K+ gradient is likely sufficient to power substrate transport by DISP1 and PTCH1, respectively.
STAR Methods
RESOURCE AVAILABILITY
Lead Contact
Further information and requests for reagents should be directed to, and will be fulfilled by, the Lead Contact, Adrian Salic (asalic@hms.harvard.edu).
Materials Availability
All newly generated plasmids and cell lines are available from the Lead Contact upon request.
Data and Code Availability
This study did not generate datasets. Custom MATLAB scripts utilized for image analysis are available from the Lead Contact upon request.
EXPERIMENTAL MODEL AND SUBJECT DETAILS
Cell culture
HEK293T, HEK293S GnTI-, NIH-3T3 and L cells were purchased from ATCC. L cells, HEK293T and HEK293S GnTI- cells, and Ptch1−/− MEFs (Goodrich et al., 1997) were grown in Dulbecco’s Modified Eagle’s Medium (DMEM) with 10% fetal bovine serum (FBS), penicillin, and streptomycin. NIH-3T3 cells were grown in DMEM with 10% bovine calf serum (BCS), penicillin, and streptomycin. HEK293T and HEK293S GnTI- cells are female. NIH-3T3 and L cells are male. The sex of Ptch1−/− MEFs has not been determined. Stable lines were generated by lentiviral transduction, followed by blasticidin selection (50 μg/mL), as described (Tukachinsky et al., 2012). Briefly, HEK293T cells were transiently transfected (TransIT-293, Mirus) with lentiviral constructs bearing transgenes of interest; lentivirus-conditioned medium was harvested after 48 h and used to infect cells of interest. For transient expression experiments, cells were transfected using polyethylenimine (PEI, Polysciences). For SHH-NL5 titration experiments, the amount of transfected DNA was equalized by mixing the SHH-NL5 expression construct with carrier plasmid DNA (pBluescript).
Generation of DISP1 knockout (DISP1KO) HEK293T cells by CRISPR/Cas9
Two gRNA sequences were chosen, in exons 2 and 4 (the first and third exons with coding sequence) of human DISP1 (crispr.mit.edu). Targeting constructs were generated in a derivative of pX330 (Cong et al., 2013) expressing EGFP-tagged Cas9. HEK293T cells were co-transfected with the two targeting plasmids, and EGFP-positive cells, isolated by fluorescence-activated sorting, were plated clonally. Genomic DNA was extracted from single clones, and was initially screened by PCR, to identify cells with large deletions spanning the two gRNA-targeted loci. A clonal line harboring a 47.7-kbp deletion allele was identified. Both gRNA loci were then PCR amplified and Sanger sequenced to define all lesions present. Lesions were further confirmed by sequencing target locus amplicons on a MiSeq instrument (Illumina). The DISP1KO line used in this study harbors a deletion allele, as well as alleles with frameshifts at both targeted loci. Two indels causing frameshifts were identified at the exon 2 locus, and one indel causing frameshift at the exon 4 locus. No wild-type sequences were observed by MiSeq at either locus. That two frameshifts were identified for exon 2 perhaps reflects the presence of 3 copies of the DISP1 locus in HEK293T cells.
METHOD DETAILS
Antibodies
The following antibodies were purchased: rabbit anti-SHH monoclonal antibody (Cell Signaling Technology), rabbit anti-WNT3A monoclonal antibody (Cell Signaling Technology), rabbit anti-GFP polyclonal antibody (Rockland), mouse monoclonal anti-tubulin (Sigma), mouse anti-acetylated tubulin monoclonal antibody (Sigma), rat anti-HA–HRP conjugate (Roche), sheep anti-mouse IgG–HRP conjugate (Jackson ImmunoResearch), donkey anti-rabbit IgG–HRP conjugate (GE Healthcare), donkey anti-goat IgG–Alexa Fluor 488 conjugate (Thermo), donkey anti-rabbit IgG-Alexa Fluor 555 conjugate (Thermo), and donkey anti-chicken IgY–Alexa Fluor 647 conjugate (Jackson ImmunoResearch). Antibodies against mCherry (Nedelcu et al., 2013) and against mouse SMO (Tukachinsky et al., 2010) were described previously. Polyclonal antibodies against mouse ARL13B (mARL13B), a marker of cilia, were raised in chickens. Briefly, 6xHis-tagged mARL13B was expressed in E. coli (BL21 DE3 pLysS, Novagen), was purified as a soluble protein, and was used to immunize hens (Abcore). Whole IgY was isolated from eggs laid by the immunized hens, as described (Pauly et al., 2011). Anti-mARL13B antibodies were isolated from whole IgY, by affinity purification against recombinant MBP-tagged mARL13B immobilized on Affi-Gel 10 beads (Bio-Rad).
DNA constructs
All constructs were subcloned into a lentiviral CMV promoter-driven expression vector. Overlapping PCR was used to introduce mutations and to assemble fusions, and the resulting constructs were confirmed by sequencing. Mouse DISP1 and PTCH1 were tagged with mCherry fluorescent protein at their C-termini. SHH-NL fusions were generated by inserting the coding sequence for NanoLuc (NL, Promega), flanked by two glycine residues on either end, between the following residues of the N-terminal signaling domain of human SHH: K32 and R33; N69 and S70; S70 and E71; P82 and D83; N91 and T92; P118 and G119; E130 and D131; R153 and D154; K194 and S195. WNT3A-NL consists of the influenza hemagglutinin signal sequence, one copy of the FLAG epitope, the NL sequence, followed by the sequence of mouse WNT3A without signal sequence; this is the same tagging location as used to generate epitope-tagged functional WNT3A (Farin et al., 2016). The expression construct for producing mouse SCUBE2 contained, from the N-terminus: the influenza hemagglutinin signal sequence, one copy of the FLAG epitope, the mutant bacterial dehalogenase HaloTag7 (Ohana et al., 2009), a PreScission protease cleavage site, and the sequence of SCUBE2 without the signal sequence. To increase the yield of full-length SCUBE2, the putative furin cleavage site was mutated (R274A, R276A, R277A).
Custom media formulations
Cell culture media of defined ionic composition were based on Tyrode’s solution, and are described in Table S1.
Fluorescence-activated cell sorting
A single cell suspension at 10×106 cells per mL in phenol red-free DMEM, supplemented with 0.5% FBS was made by trypsinizing, pelleting and resuspending cells. The suspension was passed through a 35μm nylon strainer and cells were sorted on a FACSAria III (BD Biosciences) cell sorter equipped with a 561nm yellow laser and multi-sort option. The population fluorescence distribution was measured for each population after the sort.
Protein expression and purification
SCUBE2 was affinity purified on anti-FLAG-M1 resin (Millipore), from media conditioned by HEK293S GnTI- cells stably transduced with the SCUBE2-expressing lentivirus. Briefly, conditioned media was clarified by centrifugation and filtration, and was then adjusted to 300 mM NaCl, 2 mM CaCl2 and 0.1% Triton X-100. The media was applied twice to a column packed with anti-FLAG-M1 resin, at 4°C. The column was washed with >10 column volumes of wash buffer with detergent (10 mM Tris pH 8, 150 mM NaCl, 2mM CaCl2, 0.1% Triton X-100), followed by >20 column volumes of wash buffer without detergent (10 mM Tris pH 8, 150 mM NaCl, 2mM CaCl2). The protein was eluted at room temperature, with 100 μg/mL FLAG peptide (Genscript) in Tris-buffered saline (TBS, 10 mM Tris pH 8, 150 mM NaCl). Fractions containing the protein were pooled and concentrated using centrifugal concentrators (Millipore), according to manufacturer’s instructions. SCUBE2 was further purified by gel filtration on a Superdex 200 column (GE Healthcare).
Luciferase-based SHH release assays
HEK293T cells stably expressing SHH-NL5 were plated on poly-D-lysine, in complete media. The next day, the cells were exchanged into DMEM, and were cultured overnight. The cells were washed three times with DMEM, to remove all serum, and were preincubated with cycloheximide (100μg/mL, Sigma) for 30 minutes. The release reaction was started by switching the cells into media supplemented with purified SCUBE2, BSA (negative control), or methyl-β-cyclodextrin (MβCD, Sigma), in the continued presence of cycloheximide. The cells were incubated at 37°C in a cell culture incubator, and aliquots of the supernatant were withdrawn at specified time points. Between time points, the plates were gently shaken to ensure even mixing of media. Collected supernatants were centrifuged, to remove possible cellular debris, and NanoLuc activity was measured on a Wallac Victor3 Microplate Reader (Perkin-Elmer), using Nano-Glo Luciferase Assay Substrate (Promega), according to the manufacturer’s instructions. Luminescence measurements were corrected for the decreasing supernatant volume during the assay. Only linear portions of release curves were used to calculate initial release rates. In experiments comparing SHH-NL5 release between different cell lines, the cells were also harvested at the end of the experiment (30 minutes), were lysed in TBS with 0.2% Triton X-100, and NanoLuc activity was measured, to determine SHH-NL5 expression levels. Only a small fraction (<5%) of total SHH-NL5 was released from cells during the 30-minute duration of the release assay. Specific modifications of this protocol used during initial assay development are noted in the associated figure legends. Luminescence dynamic range and standard curves were determined using recombinant NanoLuc, expressed and purified from bacteria.
WNT3A release assays
L cells stably expressing WNT3A or WNT3A-NL were grown overnight in complete media, and were washed thrice with DMEM. The cells were then incubated overnight in DMEM without serum or with 10% FBS, in the absence or presence of the Porcupine (PORCN) inhibitor, IWP-2 (2μM, Sigma). Media was harvested, was centrifuged to remove cellular debris, and released WNT3A was detected by SDS-PAGE and immunoblotting, while released WNT3A-NL was measured by luminescence, as for SHH-NL5. Total WNT3A-NL was measured in cell lysates, as for SHH-NL5. For measuring the effect of the Na+ gradient on WNT3A-NL release rates, after washing with DMEM, the cells were preincubated in DMEM with cycloheximide (100μg/mL) for 30 minutes, after which WNT3A-NL release was initiated by switching cells into the indicated Tyrode’s media, supplemented with cycloheximide and 2% FBS. Aliquots of the supernatant were withdrawn at specified time points, and released WNT3A-NL was measured as above. Remaining WNT3A-NL was measured in cell lysates.
Total protein measurements
Total protein was measured using a BCA assay (G Biosciences), according to manufacturer’s recommendations, using cell lysates harvested at the end of each experiment (see above). Briefly, 5–10μL of cell lysate was combined with 1mL BCA reagent and incubated at 37°C for 60min. Absorbance was read at 562nm using a Cary 300 UV-Vis spectrophotometer (Agilent). Protein concentration was determined according to a BSA standard curve.
Immunoblot-based SHH release
On day 1, wild-type or DISP1KO HEK293T cells were plated in 6-well format, such that they would reach 50% confluence the next day. On day 2, cells were transiently transfected with SHH and the indicated SCUBE2 and DISP1 constructs. On day 3, the cells were washed three times with DMEM at 2-hour intervals to remove serum and then into DMEM for overnight collection. Conditioned media was harvested, centrifuged to remove debris, and then subjected to trichloroacetic acid (TCA) precipitation. Precipitated proteins were separated by SDS-PAGE, and released SHH was detected by immunoblotting (Tukachinsky et al., 2012).
Microscopy and immunofluorescence
On day 1, cells were plated on gelatin-coated glass coverslips, such that they would reach confluence the next day. On day 2, the cells were serum-starved, by overnight incubation in DMEM. On day 3, the cells were incubated under the indicated conditions, after which they were fixed with 3.7% formaldehyde in phosphate-buffered saline (PBS, 10mM Na2HPO4, 1.8mM KH2PO4, 2.7mM KCl, 137mM NaCl) at room temperature, for 15 minutes. The cells were washed with TBS, were permeabilized with TBST (TBS with 0.2% Triton X-100), and were incubated in blocking solution (25mg/mL BSA in TBST). Immunofluorescence was performed as described (Tukachinsky et al., 2010). The primary antibodies were: chicken anti-ARL13B, rabbit anti-mCherry, goat anti-SMO, each at 2μg/mL final concentration. The secondary antibodies were: donkey anti-goat IgG–Alexa Fluor 488 conjugate, donkey anti-rabbit IgG–Alexa Fluor 555 conjugate, donkey anti-chicken IgY–Alexa Fluor 647, each at 1μg/mL final concentration. Images were acquired with a 40x Plan Apo 0.95 N.A. objective lens (Nikon), on a TE2000E microscope (Nikon) equipped with motorized stage (Prior Scientific) and an OrcaER camera (Hamamatsu Photonics). Ciliary fluorescence intensity was quantified using custom-built scripts implemented in MATLAB, as described (Nedelcu et al., 2013). At least 100 cilia were analyzed per condition. Details of statistical testing are described in figure legends.
Quantitative RT-PCR
Measurements of Gli1 expression, relative to the housekeeping gene Rpl27, were done by quantitative RT-PCR, as described (Tukachinsky et al., 2016). Briefly, cells were serum-starved overnight and treated as described in the figure legends. TRIzol (Thermo) was used to extract total RNA, which was treated with DNAse I (Promega) and re-extracted with TRIzol prior to reverse transcription (LunaScript RT SuperMix, NEB). cDNA samples were quantified with PowerUp SYBR Green Master Mix (Thermo) and the indicated primers (Key Resource Table). Biological triplicates were performed for all assays.
KEY RESOURCES TABLE.
| REAGENT or RESOURCE | SOURCE | IDENTIFIER |
|---|---|---|
| Antibodies | ||
| rabbit monoclonal anti-SHH (clone C9C5) | Cell Signaling Technology | Cat# 2207S; RRID: AB_2188191 |
| rabbit monoclonal anti-WNT3A (clone C64F2) | Cell Signaling Technology | Cat# 2721; RRID: AB_2215411 |
| rabbit polyclonal anti-GFP | Rockland | Cat# 600-401-215; RRID: AB_828167 |
| mouse monoclonal anti-tubulin (clone DM1A) | Sigma; Blose et al., 1984 | Cat# T6199; RRID: AB_477583 |
| mouse monoclonal anti-acetylated tubulin (clone 6-11B-1) | Sigma | Cat# T7451; RRID: AB_609894 |
| goat polyclonal anti-mSMO | Nedelcu et al., 2013 | N/A |
| rabbit polyclonal anti-mCherry | Nedelcu et al., 2013 | N/A |
| chicken polyclonal anti-mARL13B | This study | N/A |
| rat anti-HA (clone 3F10)–HRP conjugate | Roche | Cat# 12013819001; RRID: AB_390917 |
| sheep anti-mouse IgG–HRP conjugate | Jackson ImmunoResearch | Cat# 515-005-003; RRID: AB_2340287 |
| donkey anti-rabbit IgG–HRP conjugate | GE Healthcare | Cat# NA934; RRID: AB_772206 |
| donkey anti-goat IgG–Alexa Fluor 488 conjugate | Thermo | Cat# A-11055; RRID: AB_2534102 |
| donkey anti-rabbit IgG–Alexa Fluor 555 conjugate | Thermo | Cat# A-31572; RRID: AB_162543 |
| donkey anti-chicken IgY–Alexa Fluor 647 conjugate | Jackson ImmunoResearch | Cat# 703-605-155; RRID: AB_2340379 |
| Bacterial and Virus Strains | ||
| E. coli BL21 (DE3) pLysS | Sigma | Cat# 69451 |
| Chemicals, Peptides, and Recombinant Proteins | ||
| polyethylenimine (PEI), linear, MW 25000 | Polysciences | Cat# 23966 |
| TransIT®-293 Transfection Reagent | Mirus | Cat# MIR2700 |
| cycloheximide (≥94%) | Sigma | Cat# C7698 |
| methyl-β-cyclodextrin (MβCD) | Sigma | Cat# 332615 |
| IWP-2 (PORCN inhibitor) (≥98%) | Sigma; Wang et al., 2013 | Cat# I0536 |
| SAG (SMO agonist) (≥98%) | Axxora; Chen et al., 2002 | Cat# BV-1939 |
| SANT-1 (SMO antagonist) (≥95%) | Calbiochem; Chen et al., 2002 | Cat# 559303 |
| gramicidin A | Sigma | Cat# 50845 |
| veratridine (≥98%) | Tocris Bioscience | Cat# 2918 |
| bis-(1,3-dibutylbarbituric acid) trimethine oxonol (DiBAC4(3)) (≥95%) | Sigma | Cat# D8189 |
| carbonyl cyanide 3-chlorophenylhydrazone (CCCP) (≥97%) | Sigma | Cat# C2759 |
| staurosporine (>99%) | LC Laboratories | Cat# S-9300 |
| oligomycin A (≥99%) | Sigma | Cat# 75351 |
| See Table S1 for composition of modified Tyrode’s media utilized in this study. | This study | N/A |
| FLAG peptide: NH2-DYKDDDDK-OH | Genscript | N/A |
| 6xHis-mARL13B (antigen for immunization) | This study | N/A |
| MBP-mARL13B (for antibody affinity purification) | This study | N/A |
| FLAG-HT7-mSCUBE2-ΔFurin | This study | N/A |
| Critical Commercial Assays | ||
| MiSeq Reagent Kit v2 | Illumina | Cat# MS-102-2001 |
| Affi-Gel 10 Gel | Bio-Rad | Cat# 1536099 |
| anti-FLAG M1 resin | Millipore | Cat# A4596 |
| Amicon Ultra-4 Centrifugal Filter Unit – 10kDa cutoff | Millipore | Cat# UFC8010 |
| Superdex 200, 10/300 GL | GE Healthcare | Cat# 17517501 |
| Nano-Glo® Luciferase Assay | Promega | Cat# N1120 |
| BCA Assay | G Biosciences | Cat# 786-570 |
| TRIzol Reagent | Thermo | Cat# 15596018 |
| RQ1 RNase-Free DNase | Promega | Cat# M6101 |
| LunaScript RT SuperMix Kit | NEB | Cat# E3010L |
| PowerUp SYBR Green Master Mix | Thermo | Cat# A25742 |
| CellTiter-Glo® Luminescent Cell Viability Assay | Promega | Cat# G7572 |
| MTT Cell Proliferation Assay Kit | Cayman Chemical | Cat# 10009365 |
| Experimental Models: Cell Lines | ||
| Human: HEK293T | ATCC | Cat# CRL-3216; RRID: CVCL_0063 |
| Human: HEK293S GnTI− | A.C. Kruse; ATCC; Reeves et al., 2002 | Cat# CRL-3022; RRID: CVCL_A785 |
| Mouse: L cell | ATCC | Cat# CRL-2648; RRID: CVCL_4536 |
| Mouse: L Wnt-3A | ATCC | Cat# CRL-2647; RRID: CVCL_0635 |
| Mouse: NIH-3T3 | ATCC | Cat# CRL-1658; RRID: CVCL_0594 |
| Mouse: Ptch1 −/− MEF | Goodrich et al., 1997 | N/A |
| Human: DISP1KO HEK293T | This study | N/A |
| Oligonucleotides | ||
| mRpl27 qRT-PCR forward primer: 5’-GTCGAGATGGGCAAGTTCAT-3’ | Nedelcu et al., 2013 | N/A |
| mRpl27 qRT-PCR reverse primer: 5’-GCTTGGCGATCTTCTTCTTG-3’ | Nedelcu et al., 2013 | N/A |
| mGli1 qRT-PCR forward primer: 5’-GGCCAATCACAAGTCAAGGT-3’ | Nedelcu et al., 2013 | N/A |
| mGli1 qRT-PCR reverse primer: 5’-TTCAGGAGGAGGGTACAACG-3’ | Nedelcu et al., 2013 | N/A |
| See Table S2 for a list of CRISPR gRNA oligonucleotides and sequencing primers utilized in this study. | This study | N/A |
| Recombinant DNA | ||
| See Table S3 for a list of all plasmids utilized in this study. | This study | N/A |
| Software and Algorithms | ||
| MetaMorph Microscopy Automation and Image Analysis Software | Molecular Devices | http://www.moleculardevices.com/Products/Software/Meta-Imaging-Series/MetaMorph.html; RRID: SCR_002368 |
| MATLAB | MathWorks | http://www.mathworks.com/products/matlab/; RRID: SCR_001622 |
| FIJI | National Institutes of Health | http://fiji.sc; RRID: SCR_002285 |
| JalView | Waterhouse et al., 2009 | http://www.jalview.org/; RRID: SCR_006459 |
| PyMOL | Schrodinger | http://www.pymol.org/; RRID:SCR_000305 |
| Prism 8 | GraphPad | http://www.graphpad.com/; RRID: SCR_002798 |
| Photoshop CS5 | Adobe | https://www.adobe.com/products/photoshop.html; RRID: SCR_014199 |
| Inkscape | Inkscape | https://inkscape.org/en/; RRID: SCR_014479 |
Em measurements
DiBAC4(3) (Sigma), a dye with Em-sensitive uptake (Epps et al., 1994), was used to measure Em for cells incubated in various media. Confluent NIH-3T3 cells were serum-starved in DMEM for 4–6 hours, after which the cells were detached by trypsinization, were washed, and the cell suspension was incubated with DiBAC4(3) (400nM), for 30 minutes at 37°C. The cells were then analyzed on a FACSCalibur flow cytometer (BD Biosciences), using 488nm laser excitation and a 530/30 emission filter. Media with various K+ concentrations were used as positive controls for membrane depolarization. A standard curve for DiBAC4(3) fluorescence was determined by permeabilizing cells with 2μg/mL gramicidin A (Sigma), incubating them with DiBAC4(3) (0, 25, 50, 100, 200, 400nM), followed by fluorescence measurement by flow cytometry.
Cellular ATP measurements
NIH-3T3 cells were plated in 96-well plates, at a density of 40,000 cells per well. The next day, the complete media was replaced with DMEM, followed by overnight incubation. The cells were washed again with DMEM and were then incubated in media of defined ionic composition, for 3 or 6 hours. After the incubation period, cellular ATP was measured using the CellTiter-Glo reagent (Promega), according to manufacturer’s instructions, using a Wallac Victor3 Microplate Reader. As control, cellular ATP was depleted by incubation in PBS supplemented with CCCP (1μM or 5μM, as indicated; Sigma), staurosporine (2μM, LC Laboratories), or oligomycin A (100nM, Sigma). Standard curves were determined using pure ATP solutions. All ATP measurements were performed at least three times.
Cellular NAD(P)H measurements
NAPD(P)H was assayed using an MTT viability assay (Cayman Chemical). HEK293T cells were plated on poly-D-lysine coated 96-well plates, at a density of 50,000 cells per well. The next day, cells were gently washed with DMEM (0.1mL/well) and were incubated in test media for 3 hours. Media was then removed and PBS (0.1mL/well) and MTT reagent (5μL/well) were added, followed by incubation at 37°C for 3 hours. Dissolution solution (0.1mL/well) was then added, followed by incubation at room temperature overnight. The next day, absorbance at 570nm was read using a microplate reader.
Kinetic model for DISP1-catalyzed SHH release
We hypothesized that DISP1 acts as an enzyme in SHH release. This scenario is described by the following scheme:
SHH and SCUBE2 (added purified protein) are substrates for DISP1, while SCUBE2:SHH (i.e. released SHH) is the reaction product. We apply an equilibrium assumption, that binding is faster than enzyme kinetics, which means that we can describe the concentrations of intermediate species according to their binding equilibria:
The ternary complex SHH:SCUBE2:DISP1 can form either by SCUBE2 joining SHH:DISP1, or by SHH joining SCUBE2:DISP1, hence two Michaelis–Menten constants, KM1 and KM2, respectively. Importantly, the rate of SHH release (vrelease) does not depend on the order of substrate association with DISP1. Putting everything together, we obtain:
| [1] |
where Vmax = [DISP1] ∗ kcat.
Rearranging equation 1 to show the release rate dependence on [SCUBE2], we have:
| [2] |
where .
In most of our experiments, SHH is saturating, i.e. [SHH] >> KM2. This yields equation 3:
| [3] |
Equation 3 predicts that the release rate will saturate as a function of [SCUBE2], which is what is observed (Fig.2E). This shows that SHH release by SCUBE2 is a catalyzed process, as opposed to a simple binding equilibrium.
According to equation 3, if DISP1 were the enzyme catalyzing SHH release, then Vmax, but not KM, would be a function of [DISP1], since:
We test this prediction by varying [DISP1] (Fig.2F–H, Fig.2I–K, and Fig.S2H–J), and we find that DISP1 levels indeed affect Vmax, but not KM, which remains constant at 2–3μM across multiple independent experiments. These results strongly suggest that DISP1 is the rate-limiting enzyme that catalyzes SHH release.
Kinetic model for DISP1 playing an accessory role in SHH release
As an alternative hypothesis, we considered a second scheme, wherein DISP1 functions as an adaptor between membrane-bound SHH and an unknown enzyme (E) catalyzing SCUBE2:SHH release. This scenario is described by the following scheme:
Applying an equilibrium assumption as above, we obtain the following:
Michaelis–Menten constants are similar to those above, with KM1 describing SCUBE2 joining the enzyme:substrate complex and KM2 describing SHH:DISP1 joining the enzyme substrate complex; kcat is the catalytic constant of the enzyme E. The resulting rate equation is:
| [4] |
where Vmax = [E] ∗ kcat.
Rearranging equation 4 to show the release rate dependence on [SCUBE2], we have:
| [5] |
where .
This scenario also predicts release rate saturation as a function of SCUBE2; however, now the measured KM (KM*), but not Vmax, would be a function of [DISP1]. This is the opposite of what we observe experimentally, indicating that DISP1 itself, not another enzyme, catalyzes SHH release.
Calculations of electrochemical driving force (EDF)
The EDF for Na+ and K+ for the experiments in Fig.3E, F was calculated using equation E1:
| (E1) |
where R is the universal gas constant, T=300K, F is the Faraday constant, and Em is the resting membrane potential. Em was estimated using the Goldman–Hodgkin–Katz equation, assuming a ratio of 10:1 in Na+:K+ permitivity, [Na+]in = 15mM, [K+]in=125 mM, [Cl−]in=15 mM.
Blot image processing
Blot images in which species of different molecular weights were probed simultaneously were cropped in Photoshop CS5. Where necessary, such blots were resized along the horizontal axis to present clear vertical alignment of lanes across multiple probed species. Original images are available upon request.
QUANTIFICATION AND STATISTICAL ANALYSIS
SHH release was measured as a single measurement over multiple time points, unless indicated otherwise in the figure legends. Release rate was calculated as the slope of the linear regression line fit to the linear portion, typically 1–30min, of the SHH release data. Curve fitting was performed in Prism 8 (GraphPad Software), using least-squares linear or nonlinear regression, as indicated in the figure legends. Parameter estimates are reported with associated standard errors of the estimate. Statistical tests and associated significance threshold are reported in the figure legends.
Supplementary Material
Highlights.
The Hedgehog pathway RND proteins DISP1 and PTCH1 are cation-powered transporters
DISP1 uses the transmembrane Na+ gradient to catalyze cholesterylated SHH secretion
PTCH1 uses the transmembrane K+ gradient to block SMO activation by cholesterol
Key residue conservation suggests how ion fluxes couple to substrate transport
Acknowledgements
This work was supported by NIH grants R01 GM122920 and GM135262 (to A.S.), and by NIH predoctoral fellowship F31GM120833 (to B.M.W.). We thank Marie Bao for reading the manuscript and for helpful suggestions, and members of the Salic lab for discussions.
Footnotes
Declaration of Interests
The authors declare no competing interests.
Publisher's Disclaimer: This is a PDF file of an unedited manuscript that has been accepted for publication. As a service to our customers we are providing this early version of the manuscript. The manuscript will undergo copyediting, typesetting, and review of the resulting proof before it is published in its final form. Please note that during the production process errors may be discovered which could affect the content, and all legal disclaimers that apply to the journal pertain.
References
- Aires JR, and Nikaido H (2005). Aminoglycosides are captured from both periplasm and cytoplasm by the AcrD multidrug efflux transporter of Escherichia coli. J Bacteriol 187, 1923–1929. [DOI] [PMC free article] [PubMed] [Google Scholar]
- Alcedo J, Ayzenzon M, Von Ohlen T, Noll M, and Hooper JE (1996). The Drosophila smoothened gene encodes a seven-pass membrane protein, a putative receptor for the hedgehog signal. Cell 86, 221–232. [DOI] [PubMed] [Google Scholar]
- Amanai K, and Jiang J (2001). Distinct roles of Central missing and Dispatched in sending the Hedgehog signal. Development 128, 5119–5127. [DOI] [PubMed] [Google Scholar]
- Blose SH, Meltzer DI, and Feramisco JR (1984). 10-nm filaments are induced to collapse in living cells microinjected with monoclonal and polyclonal antibodies against tubulin. The Journal of cell biology 98, 847–858. [DOI] [PMC free article] [PubMed] [Google Scholar]
- Burke R, Nellen D, Bellotto M, Hafen E, Senti KA, Dickson BJ, and Basler K (1999). Dispatched, a novel sterol-sensing domain protein dedicated to the release of cholesterol-modified hedgehog from signaling cells. Cell 99, 803–815. [DOI] [PubMed] [Google Scholar]
- Byrne EF, Sircar R, Miller PS, Hedger G, Luchetti G, Nachtergaele S, Tully MD, Mydock-McGrane L, Covey DF, Rambo RP, et al. (2016). Structural basis of Smoothened regulation by its extracellular domains. Nature 535, 517–522. [DOI] [PMC free article] [PubMed] [Google Scholar]
- Carstea ED, Morris JA, Coleman KG, Loftus SK, Zhang D, Cummings C, Gu J, Rosenfeld MA, Pavan WJ, Krizman DB, et al. (1997). Niemann-Pick C1 disease gene: homology to mediators of cholesterol homeostasis. Science 277, 228–231. [DOI] [PubMed] [Google Scholar]
- Caspary T, Garcia-Garcia MJ, Huangfu D, Eggenschwiler JT, Wyler MR, Rakeman AS, Alcorn HL, and Anderson KV (2002). Mouse Dispatched homolog1 is required for long-range, but not juxtacrine, Hh signaling. Current biology : CB 12, 1628–1632. [DOI] [PubMed] [Google Scholar]
- Chamoun Z, Mann RK, Nellen D, von Kessler DP, Bellotto M, Beachy PA, and Basler K (2001). Skinny hedgehog, an acyltransferase required for palmitoylation and activity of the hedgehog signal. Science 293, 2080–2084. [DOI] [PubMed] [Google Scholar]
- Chang DT, Lopez A, von Kessler DP, Chiang C, Simandl BK, Zhao R, Seldin MF, Fallon JF, and Beachy PA (1994). Products, genetic linkage and limb patterning activity of a murine hedgehog gene. Development 120, 3339–3353. [DOI] [PubMed] [Google Scholar]
- Chen JK, Taipale J, Young KE, Maiti T, and Beachy PA (2002). Small molecule modulation of Smoothened activity. Proceedings of the National Academy of Sciences of the United States of America 99, 14071–14076. [DOI] [PMC free article] [PubMed] [Google Scholar]
- Coady MJ, Wallendorff B, and Lapointe JY (2017). Characterization of the transport activity of SGLT2/MAP17, the renal low-affinity Na(+)-glucose cotransporter. Am J Physiol Renal Physiol 313, F467–F474. [DOI] [PubMed] [Google Scholar]
- Cong L, Ran FA, Cox D, Lin S, Barretto R, Habib N, Hsu PD, Wu X, Jiang W, Marraffini LA, et al. (2013). Multiplex genome engineering using CRISPR/Cas systems. Science 339, 819–823. [DOI] [PMC free article] [PubMed] [Google Scholar]
- Cooper MK, Wassif CA, Krakowiak PA, Taipale J, Gong R, Kelley RI, Porter FD, and Beachy PA (2003). A defective response to Hedgehog signaling in disorders of cholesterol biosynthesis. Nat Genet 33, 508–513. [DOI] [PubMed] [Google Scholar]
- Corbit KC, Aanstad P, Singla V, Norman AR, Stainier DY, and Reiter JF (2005). Vertebrate Smoothened functions at the primary cilium. Nature 437, 1018–1021. [DOI] [PubMed] [Google Scholar]
- Courtney KC, Fung KY, Maxfield FR, Fairn GD, and Zha X (2018). Comment on ‘Orthogonal lipid sensors identify transbilayer asymmetry of plasma membrane cholesterol’. eLife 7. [DOI] [PMC free article] [PubMed] [Google Scholar]
- Creanga A, Glenn TD, Mann RK, Saunders AM, Talbot WS, and Beachy PA (2012). Scube/You activity mediates release of dually lipid-modified Hedgehog signal in soluble form. Genes & development 26, 1312–1325. [DOI] [PMC free article] [PubMed] [Google Scholar]
- Davis HR Jr., Zhu LJ, Hoos LM, Tetzloff G, Maguire M, Liu J, Yao X, Iyer SP, Lam MH, Lund EG, et al. (2004). Niemann-Pick C1 Like 1 (NPC1L1) is the intestinal phytosterol and cholesterol transporter and a key modulator of whole-body cholesterol homeostasis. The Journal of biological chemistry 279, 33586–33592. [DOI] [PubMed] [Google Scholar]
- Deffieu MS, and Pfeffer SR (2011). Niemann-Pick type C 1 function requires lumenal domain residues that mediate cholesterol-dependent NPC2 binding. Proceedings of the National Academy of Sciences of the United States of America 108, 18932–18936. [DOI] [PMC free article] [PubMed] [Google Scholar]
- Delling M, DeCaen PG, Doerner JF, Febvay S, and Clapham DE (2013). Primary cilia are specialized calcium signalling organelles. Nature 504, 311–314. [DOI] [PMC free article] [PubMed] [Google Scholar]
- Delmar JA, Su CC, and Yu EW (2015). Heavy metal transport by the CusCFBA efflux system. Protein Sci 24, 1720–1736. [DOI] [PMC free article] [PubMed] [Google Scholar]
- Echelard Y, Epstein DJ, St-Jacques B, Shen L, Mohler J, McMahon JA, and McMahon AP (1993). Sonic hedgehog, a member of a family of putative signaling molecules, is implicated in the regulation of CNS polarity. Cell 75, 1417–1430. [DOI] [PubMed] [Google Scholar]
- Epps DE, Wolfe ML, and Groppi V (1994). Characterization of the steady-state and dynamic fluorescence properties of the potential-sensitive dye bis-(1,3-dibutylbarbituric acid)trimethine oxonol (Dibac4(3)) in model systems and cells. Chemistry and physics of lipids 69, 137–150. [DOI] [PubMed] [Google Scholar]
- Farin HF, Jordens I, Mosa MH, Basak O, Korving J, Tauriello DV, de Punder K, Angers S, Peters PJ, Maurice MM, et al. (2016). Visualization of a short-range Wnt gradient in the intestinal stem-cell niche. Nature 530, 340–343. [DOI] [PubMed] [Google Scholar]
- Gong X, Qian H, Cao P, Zhao X, Zhou Q, Lei J, and Yan N (2018). Structural basis for the recognition of Sonic Hedgehog by human Patched!. Science 361. [DOI] [PubMed] [Google Scholar]
- Goodrich LV, Milenkovic L, Higgins KM, and Scott MP (1997). Altered neural cell fates and medulloblastoma in mouse patched mutants. Science 277, 1109–1113. [DOI] [PubMed] [Google Scholar]
- Hall MP, Unch J, Binkowski BF, Valley MP, Butler BL, Wood MG, Otto P, Zimmerman K, Vidugiris G, Machleidt T, et al. (2012). Engineered luciferase reporter from a deep sea shrimp utilizing a novel imidazopyrazinone substrate. ACS Chem Biol 7, 1848–1857. [DOI] [PMC free article] [PubMed] [Google Scholar]
- Hollway GE, Maule J, Gautier P, Evans TM, Keenan DG, Lohs C, Fischer D, Wicking C, and Currie PD (2006). Scube2 mediates Hedgehog signalling in the zebrafish embryo. Developmental biology 294, 104–118. [DOI] [PubMed] [Google Scholar]
- Huang P, Nedelcu D, Watanabe M, Jao C, Kim Y, Liu J, and Salic A (2016). Cellular Cholesterol Directly Activates Smoothened in Hedgehog Signaling. Cell 166, 1176–1187 e1114. [DOI] [PMC free article] [PubMed] [Google Scholar]
- Humke EW, Dorn KV, Milenkovic L, Scott MP, and Rohatgi R (2010). The output of Hedgehog signaling is controlled by the dynamic association between Suppressor of Fused and the Gli proteins. Genes & development 24, 670–682. [DOI] [PMC free article] [PubMed] [Google Scholar]
- Infante RE, Wang ML, Radhakrishnan A, Kwon HJ, Brown MS, and Goldstein JL (2008). NPC2 facilitates bidirectional transfer of cholesterol between NPC1 and lipid bilayers, a step in cholesterol egress from lysosomes. Proceedings of the National Academy of Sciences of the United States of America 105, 15287–15292. [DOI] [PMC free article] [PubMed] [Google Scholar]
- Ingham PW, and McMahon AP (2001). Hedgehog signaling in animal development: paradigms and principles. Genes & development 15, 3059–3087. [DOI] [PubMed] [Google Scholar]
- Ingham PW, Nystedt S, Nakano Y, Brown W, Stark D, van den Heuvel M, and Taylor AM (2000). Patched represses the Hedgehog signalling pathway by promoting modification of the Smoothened protein. Current biology : CB 10, 1315–1318. [DOI] [PubMed] [Google Scholar]
- Iwamoto H, Blakely RD, and De Felice LJ (2006). Na+, Cl-, and pH dependence of the human choline transporter (hCHT) in Xenopus oocytes: the proton inactivation hypothesis of hCHT in synaptic vesicles. J Neurosci 26, 9851–9859. [DOI] [PMC free article] [PubMed] [Google Scholar]
- Kawakami A, Nojima Y, Toyoda A, Takahoko M, Satoh M, Tanaka H, Wada H, Masai I, Terasaki H, Sakaki Y, et al. (2005). The zebrafish-secreted matrix protein you/scube2 is implicated in long-range regulation of hedgehog signaling. Current biology : CB 15, 480–488. [DOI] [PubMed] [Google Scholar]
- Kawakami T, Kawcak T, Li YJ, Zhang W, Hu Y, and Chuang PT (2002). Mouse dispatched mutants fail to distribute hedgehog proteins and are defective in hedgehog signaling. Development 129, 5753–5765. [DOI] [PubMed] [Google Scholar]
- Kilambi KP, and Gray JJ (2012). Rapid calculation of protein pKa values using Rosetta. Biophysical journal 103, 587–595. [DOI] [PMC free article] [PubMed] [Google Scholar]
- Krauss S, Concordet JP, and Ingham PW (1993). A functionally conserved homolog of the Drosophila segment polarity gene hh is expressed in tissues with polarizing activity in zebrafish embryos. Cell 75, 1431–1444. [DOI] [PubMed] [Google Scholar]
- Lee HC (1984a). A membrane potential-sensitive Na+-H+ exchange system in flagella isolated from sea urchin spermatozoa. The Journal of biological chemistry 259, 15315–15319. [PubMed] [Google Scholar]
- Lee HC (1984b). Sodium and proton transport in flagella isolated from sea urchin spermatozoa. The Journal of biological chemistry 259, 4957–4963. [PubMed] [Google Scholar]
- Luchetti G, Sircar R, Kong JH, Nachtergaele S, Sagner A, Byrne EF, Covey DF, Siebold C, and Rohatgi R (2016). Cholesterol activates the G-protein coupled receptor Smoothened to promote Hedgehog signaling. eLife 5. [DOI] [PMC free article] [PubMed] [Google Scholar]
- Lum L, and Beachy PA (2004). The Hedgehog response network: sensors, switches, and routers. Science 304, 1755–1759. [DOI] [PubMed] [Google Scholar]
- Ma Y, Erkner A, Gong R, Yao S, Taipale J, Basler K, and Beachy PA (2002). Hedgehog-mediated patterning of the mammalian embryo requires transporter-like function of dispatched. Cell 111, 63–75. [DOI] [PubMed] [Google Scholar]
- Murakami S, Nakashima R, Yamashita E, Matsumoto T, and Yamaguchi A (2006). Crystal structures of a multidrug transporter reveal a functionally rotating mechanism. Nature 443, 173–179. [DOI] [PubMed] [Google Scholar]
- Myers BR, Neahring L, Zhang Y, Roberts KJ, and Beachy PA (2017). Rapid, direct activity assays for Smoothened reveal Hedgehog pathway regulation by membrane cholesterol and extracellular sodium. Proceedings of the National Academy of Sciences of the United States of America 114, E11141–E11150. [DOI] [PMC free article] [PubMed] [Google Scholar]
- Myers BR, Sever N, Chong YC, Kim J, Belani JD, Rychnovsky S, Bazan JF, and Beachy PA (2013). Hedgehog pathway modulation by multiple lipid binding sites on the smoothened effector of signal response. Developmental cell 26, 346–357. [DOI] [PMC free article] [PubMed] [Google Scholar]
- Nachtergaele S, Whalen DM, Mydock LK, Zhao Z, Malinauskas T, Krishnan K, Ingham PW, Covey DF, Siebold C, and Rohatgi R (2013). Structure and function of the Smoothened extracellular domain in vertebrate Hedgehog signaling. eLife 2, e01340. [DOI] [PMC free article] [PubMed] [Google Scholar]
- Nakano Y, Guerrero I, Hidalgo A, Taylor A, Whittle JR, and Ingham PW (1989). A protein with several possible membrane-spanning domains encoded by the Drosophila segment polarity gene patched. Nature 341, 508–513. [DOI] [PubMed] [Google Scholar]
- Nakano Y, Kim HR, Kawakami A, Roy S, Schier AF, and Ingham PW (2004). Inactivation of dispatched 1 by the chameleon mutation disrupts Hedgehog signalling in the zebrafish embryo. Developmental biology 269, 381–392. [DOI] [PubMed] [Google Scholar]
- Nedelcu D, Liu J, Xu Y, Jao C, and Salic A (2013). Oxysterol binding to the extracellular domain of Smoothened in Hedgehog signaling. Nature chemical biology 9, 557–564. [DOI] [PMC free article] [PubMed] [Google Scholar]
- Nikaido H (2018). RND transporters in the living world. Res Microbiol 169, 363–371. [DOI] [PMC free article] [PubMed] [Google Scholar]
- Ohana RF, Encell LP, Zhao K, Simpson D, Slater MR, Urh M, and Wood KV (2009). HaloTag7: a genetically engineered tag that enhances bacterial expression of soluble proteins and improves protein purification. Protein Expr Purif 68, 110–120. [DOI] [PubMed] [Google Scholar]
- Pauly D, Chacana PA, Calzado EG, Brembs B, and Schade R (2011). IgY technology: extraction of chicken antibodies from egg yolk by polyethylene glycol (PEG) precipitation. J Vis Exp. [DOI] [PMC free article] [PubMed] [Google Scholar]
- Pepinsky RB, Zeng C, Wen D, Rayhorn P, Baker DP, Williams KP, Bixler SA, Ambrose CM, Garber EA, Miatkowski K, et al. (1998). Identification of a palmitic acid-modified form of human Sonic hedgehog. The Journal of biological chemistry 273, 14037–14045. [DOI] [PubMed] [Google Scholar]
- Porter JA, Young KE, and Beachy PA (1996). Cholesterol modification of hedgehog signaling proteins in animal development. Science 274, 255–259. [DOI] [PubMed] [Google Scholar]
- Qi X, Schmiege P, Coutavas E, and Li X (2018a). Two Patched molecules engage distinct sites on Hedgehog yielding a signaling-competent complex. Science 362. [DOI] [PMC free article] [PubMed] [Google Scholar]
- Qi X, Schmiege P, Coutavas E, Wang J, and Li X (2018b). Structures of human Patched and its complex with native palmitoylated sonic hedgehog. Nature 560, 128–132. [DOI] [PMC free article] [PubMed] [Google Scholar]
- Qian H, Cao P, Hu M, Gao S, Yan N, and Gong X (2019). Inhibition of tetrameric Patched1 by Sonic Hedgehog through an asymmetric paradigm. Nat Commun 10, 2320. [DOI] [PMC free article] [PubMed] [Google Scholar]
- Reeves PJ, Callewaert N, Contreras R, and Khorana HG (2002). Structure and function in rhodopsin: high-level expression of rhodopsin with restricted and homogeneous N-glycosylation by a tetracycline-inducible N-acetylglucosaminyltransferase I-negative HEK293S stable mammalian cell line. Proceedings of the National Academy of Sciences of the United States of America 99, 13419–13424. [DOI] [PMC free article] [PubMed] [Google Scholar]
- Riddle RD, Johnson RL, Laufer E, and Tabin C (1993). Sonic hedgehog mediates the polarizing activity of the ZPA. Cell 75, 1401–1416. [DOI] [PubMed] [Google Scholar]
- Rohatgi R, Milenkovic L, and Scott MP (2007). Patched1 regulates hedgehog signaling at the primary cilium. Science 317, 372–376. [DOI] [PubMed] [Google Scholar]
- Rubin LL, and de Sauvage FJ (2006). Targeting the Hedgehog pathway in cancer. Nat Rev Drug Discov 5, 1026–1033. [DOI] [PubMed] [Google Scholar]
- Seeger MA, Schiefner A, Eicher T, Verrey F, Diederichs K, and Pos KM (2006). Structural asymmetry of AcrB trimer suggests a peristaltic pump mechanism. Science 313, 1295–1298. [DOI] [PubMed] [Google Scholar]
- Su CC, Li M, Gu R, Takatsuka Y, McDermott G, Nikaido H, and Yu EW (2006). Conformation of the AcrB multidrug efflux pump in mutants of the putative proton relay pathway. J Bacteriol 188, 7290–7296. [DOI] [PMC free article] [PubMed] [Google Scholar]
- Taipale J, Cooper MK, Maiti T, and Beachy PA (2002). Patched acts catalytically to suppress the activity of Smoothened. Nature 418, 892–897. [DOI] [PubMed] [Google Scholar]
- Takatsuka Y, and Nikaido H (2006). Threonine-978 in the transmembrane segment of the multidrug efflux pump AcrB of Escherichia coli is crucial for drug transport as a probable component of the proton relay network. J Bacteriol 188, 7284–7289. [DOI] [PMC free article] [PubMed] [Google Scholar]
- Tukachinsky H, Kuzmickas RP, Jao CY, Liu J, and Salic A (2012). Dispatched and scube mediate the efficient secretion of the cholesterol-modified hedgehog ligand. Cell reports 2, 308–320. [DOI] [PMC free article] [PubMed] [Google Scholar]
- Tukachinsky H, Lopez LV, and Salic A (2010). A mechanism for vertebrate Hedgehog signaling: recruitment to cilia and dissociation of SuFu-Gli protein complexes. The Journal of cell biology 191, 415–428. [DOI] [PMC free article] [PubMed] [Google Scholar]
- Tukachinsky H, Petrov K, Watanabe M, and Salic A (2016). Mechanism of inhibition of the tumor suppressor Patched by Sonic Hedgehog. Proceedings of the National Academy of Sciences of the United States of America 113, E5866–E5875. [DOI] [PMC free article] [PubMed] [Google Scholar]
- van den Heuvel M, and Ingham PW (1996). smoothened encodes a receptor-like serpentine protein required for hedgehog signalling. Nature 382, 547–551. [DOI] [PubMed] [Google Scholar]
- Wang X, Moon J, Dodge ME, Pan X, Zhang L, Hanson JM, Tuladhar R, Ma Z, Shi H, Williams NS, et al. (2013). The development of highly potent inhibitors for porcupine. Journal of medicinal chemistry 56, 2700–2704. [DOI] [PMC free article] [PubMed] [Google Scholar]
- Waterhouse AM, Procter JB, Martin DM, Clamp M, and Barton GJ (2009). Jalview Version 2--a multiple sequence alignment editor and analysis workbench. Bioinformatics 25, 1189–1191. [DOI] [PMC free article] [PubMed] [Google Scholar]
- Woods IG, and Talbot WS (2005). The you gene encodes an EGF-CUB protein essential for Hedgehog signaling in zebrafish. PLoS biology 3, e66. [DOI] [PMC free article] [PubMed] [Google Scholar]
- Zhang Y, Bulkley DP, Xin Y, Roberts KJ, Asarnow DE, Sharma A, Myers BR, Cho W, Cheng Y, and Beachy PA (2018). Structural Basis for Cholesterol Transport-like Activity of the Hedgehog Receptor Patched. Cell 175, 1352–1364 e1314. [DOI] [PMC free article] [PubMed] [Google Scholar]
Associated Data
This section collects any data citations, data availability statements, or supplementary materials included in this article.
Supplementary Materials
Data Availability Statement
This study did not generate datasets. Custom MATLAB scripts utilized for image analysis are available from the Lead Contact upon request.