

SUMMARY
Despite the noisy nature of single cells, multicellular organisms robustly generate different cell types from one zygote. This process involves dynamic cross regulation between signaling and gene expression that is difficult to capture with fixed-cell approaches. To study signaling dynamics and fate specification during preimplantation development, we generated a transgenic mouse expressing the ERK Kinase Translocation Reporter and measured ERK activity in single cells of live embryos. Our results show primarily active ERK in both the inner cell mass and trophectoderm cells due to FGF signaling. Strikingly, a subset of mitotic events result in a short pulse of ERK inactivity in both daughter cells that correlates with elevated endpoint NANOG levels. Moreover, endogenous tagging of Nanog in embryonic stem cells reveals that ERK inhibition promotes enhanced stabilization of NANOG protein after mitosis. Our data show that cell cycle, signaling, and differentiation are coordinated during preimplantation development.
Graphical Abstract

IN BRIEF
Pokrass et al. discover a cell cycle dependent bifurcation of FGF-ERK signaling activity in cells selecting between fates in embryonic development. They show cells exiting mitosis exhibit either rapid ERK activation or pulsed ERK inhibition and this signaling decision correlates with differentiation into the primitive endoderm or epiblast lineages, respectively.
INTRODUCTION
Mammalian embryogenesis initiates with a single fertilized oocyte that must rapidly increase in cell number and complexity to create a mature blastocyst of three lineages, the epiblast (EPI), primitive endoderm (PrE), and trophectoderm (TE) (Schrode, et al., 2013). In contrast to other metazoan development, mammalian pre-implantation development proceeds in the absence of any known maternal patterning cues and thus the initial fate specification events are determined from signals originating within the embryo itself (Chazaud and Yamanaka, 2016). While much is known about the signaling molecules and transcriptional regulators operating during this period (Ohnishi, et al., 2014; Kang, et al., 2013; Guo, et al., 2010; Chazaud, et al., 2006), a comprehensive understanding of the signaling and gene expression dynamics that allow robust selection of appropriate lineages is still missing.
Because of its capacity to self-organize and develop ex utero, the mouse blastocyst has emerged as an excellent model to understand how signaling coordinates cell fate determination (Simon, et al., 2018). The first embryonic lineage segregation appears to be governed by polarity-mediated differential Hippo signaling that generates the TE, the apicobasal polarized outer layer of cells defined by Cdx2 expression, and the inner cell mass (ICM), defined by the pluripotency regulator Sox2 (Frum, et al., 2018; Wicklow, et al., 2014; Hirate, et al., 2013; Nishioka, et al., 2009). Next, the ICM will further differentiate into the EPI and PrE lineages marked by NANOG and GATA6, respectively. While cells of the ICM initially coexpress the markers for both lineages, progenitors gradually upregulate the expression of one factor and concomitantly downregulate the other until all cells have been specified (Guo et al., 2010; Plusa, Piliszek, Frankenberg, Artus, & Hadjantonakis, 2008). This bistability is achieved via cooperative feedforward and feedback mechanisms that allow both NANOG and GATA6 to increase transcription at their own promoter and inhibit expression of the opposing factor (Meng, et al., 2018; Bessonnard, et al., 2014; Singh, et al., 2007; Boyer, et al., 2005). Individual ICM cells select between these lineages via fibroblast growth factor (FGF) signaling; however, the exact nature of the bifurcation of FGF-dependent signaling remains unclear.
Several lines of evidence support that ERK signaling downstream of fibroblast growth factor receptors (FGFRs) is essential for segregating these two lineages: (i) Inhibitors of FGFR or MEK and addition of recombinant FGF4 cause all ICM cells to select EPI or PrE fates, respectively (Saiz, et al., 2016; Yamanaka, et al., 2010), (ii) genetic ablation of FGF4, GRB2, or both FGFR1 and FGFR2 prevent the formation of the PrE lineage (Kang, et al., 2017; Molotkov, et al., 2017; Kang, et al., 2013; Chazaud, et al., 2006) and, (iii) FGF4 and FGFR2 expression is mutually exclusive in ICM cells and these factors are early markers for the EPI and PrE lineages, respectively (Guo, et al., 2010). Together, these findings supported a hypothesis that FGF4-expressing cells signal to neighboring FGFR2-expressing cells to generate bimodal ERK activity in the ICM essential to specify both lineages. However, recent studies reported that FGFR1 expression is required in all ICM cells to both generate the PrE and perhaps limit maximum NANOG concentrations in the EPI, indicating that a simple model consisting of cells either receiving or secreting the FGF4 stimulus is insufficient to describe the segregation of EPI and PrE lineages (Kang, et al., 2017; Molotkov, et al., 2017). Furthermore, ICM progenitors were observed to incrementally specify towards EPI or PrE lineages rather than all at once during a specific time in blastocyst development, suggesting a regulatory mechanism that could rely on other sources of cellular heterogeneity such as stochastic gene expression, asynchronous cell cycle progression, or other signaling pathway activities (Saiz, et al., 2016). While these experiments revealed the importance of ERK signaling in preimplantation development, the temporal patterns of ERK activity in single cells of the developing embryo have not been measured.
Live cell imaging of biosensors has emerged as a powerful technique to study the dynamics of cellular decision making (Gaudet and Miller-Jensen, 2016). These approaches enable tracking of individual cells while obtaining high temporal resolution measurements of cellular parameters such as gene expression (Gu, et al., 2018; Hafner, et al., 2017; Wilson, et al., 2017), metabolism (Lobas, et al., 2019; Hung and Yellen, 2014), cell cycle (Sakaue-Sawano and Miyawaki, 2014) or signaling (Komatsu, et al., 2011). Over the last decade, the use of biosensors in cultured cells, organoids and even live organisms has shown that signaling dynamics can influence gene expression (Lane, et al., 2017), collective cell behavior (Hino, et al., 2020), and cell fate (Johnson and Toettcher, 2019; Muta, et al., 2018). However, biosensors for kinase activity have not been used to understand mammalian development due to technical limitations including high phototoxicity and poor sensitivity. Here we use kinase translocation reporter (KTR) technology (Regot, et al., 2014) to study MAPK signaling dynamics during mammalian preimplantation development.
We generated ERK KTR reporter mice to enable live single cell analysis of kinase activity and validated them using multiple primary cell types as well as in vivo 2-photon imaging. Focusing on preimplantation development, we characterized ERK signaling dynamics during cell specification and found that ICM cells exhibit a bifurcation of ERK activity after mitosis that ultimately drives daughter cells towards the EPI or PrE lineages. Furthermore, using endogenously tagged NANOG in embryonic stem (ES) cells we show that NANOG is poised for rapid stabilization in G1. This work expands our understanding of how signaling dynamics and cell cycle progression are coordinated to direct robust fate specification in the self-organizing mammalian blastocyst and ES cells.
RESULTS
Development and Validation of ERK KTR Mice
To study ERK signaling dynamics in primary mammalian cells and tissues, we generated a transgenic mouse line carrying the previously reported ERK KTR (Regot, et al., 2014). The expression of the biosensor is restricted by a lox-stop-lox (LSL) cassette that, upon CRE-mediated recombination, allows spatiotemporally controlled expression of the sensor driven by the CAG promoter. Because KTR technology depends on accurate recognition of the nuclear boundary for quantitative kinase activity measurements, our vector contains a bicistronic ORF encoding both H2B-mRuby2 and KTR-mClover separated by the P2A peptide to allow equimolar expression of both proteins.
The construct was delivered to zygotes as linearized DNA by pronuclear injection and resulting transgenic integrants were determined by genotyping for the CAG promoter and termed ERK-KTRLSL. Next we crossed the founder lines with Sox2CRE mice to accomplish germline recombination of the transgene and examined offspring using a UV flashlight system at p0–1 (Figure 1A)(Hayashi, et al., 2003). In all cases, detection of the CAG promoter by PCR agreed with detectable green fluorescence at birth. These animals will be referred to as ERK-KTRLoxP. Finally, we determined the precise genomic location of the transgene to be a non-coding region of Chr13 using nanopore Cas9 Targeted-Sequencing (Gilpatrick, et al., 2019) and validated it by PCR (Figure S1A–B).
Figure 1 |. ERK-KTRLoxP Mice reveal ERK signaling dynamics in mouse preimplantation development.

(A) Schematic of KTR reporter construct for ERK-KTRLSL animals (upper) and mating scheme to generate mice with germline expression of transgene (lower). Representative image of p0 pups with visible GFP fluorescence is shown.
(B) MEFs were derived from ERK-KTRLoxP animals and imaged before and after (30 min.) stimulation with FGFb (5 ng/ml). Representative images are shown. Scale bar = 50 μm.
(C) Schematic of ERK activity quantification method. For each cell, a nuclear and cytoplasmic region of interest was drawn and KTR intensity was measured. ERK activity was reported as the log2 of the cytoplasmic / nuclear (log2(C/N)) intensity ratio.
(D) E3.5 blastocysts from ERK-KTRLoxP animals were collected, cultured, and imaged as described in methods. Representative images containing ERK low cells (arrows) are shown in ICM and TE compartments. Scale bar = 20 μm.
(E) Embryos were isolated from ERK-KTRLoxP animals at the 8-cell, 16-cell, E3.5 blastocyst, and E4.5 peri-implantation blastocyst stages and mounted for imaging in KSOM as described in methods. Representative images of single confocal planes are shown for clarity. Scale bar = 20 μm.
(F) Single cell ERK activities from embryos collected in (E) were quantified as described in methods. Cells with predominantly cytoplasmic (log2(C/N)>0) or nuclear (log2 (C/N)<0) KTR intensity were represented as blue or red points respectively. From left to right, N = 8 embryos, 55 cells; 4 embryos, 51 cells; 10 embryos, 339 cells; and 3 embryos, 190 cells.
(G) E3.5 blastocysts were isolated from ERK-KTRLoxP animals and treated with indicated inhibitors and growth factors (ERKi, 5 μM Ulixertinib; MEKi, 1 μM PD0325901; FGFRi, 1 μM AZD4547, 1000 ng/ml FGF4) for 45 min. Embryos were mounted for imaging in KSOM, maintaining the same concentration of inhibitors and growth factors, and embryos were imaged via confocal microscopy. Representative images of a single confocal plane are shown. Scale bar = 20 μm.
(H) Single cell ERK activities from embryos collected in (G) were quantified and plotted as in (F). From left to right, N = 10 embryos, 339 cells; 5 embryos, 216 cells; 6 embryos, 256 cells; 3 embryos, 103 cells; and 2 embryos, 105 cells. Untreated KSOM control corresponds to E3.5 blastocysts from (E). Significant differences between treated and untreated ERK activity distributions were determined by Kolmogorov-Smirnov test. * p < 0.05 and *** p < 0.001.
To validate the dynamics of the biosensor, we isolated primary mouse embryonic fibroblasts from ERK-KTRLoxP E13.5 pups and stimulated them with FGF. As expected, FGF stimulation triggered ERK KTR translocation to the cytoplasm (Figure 1B). Next we wanted to investigate the utility of the KTR mice to study tissue homeostasis in organoids. To this end, we derived 2D gut enteroids from the ERK-KTRLoxP mice as previously described (Thorne, et al., 2018) and measured ERK signaling dynamics upon stimulation with epidermal growth factor (EGF). Live imaging was accompanied by an EdU incorporation assay to allow determination of crypt and villus domains and compare their signaling patterns. While all cells responded to the EGF stimulus, cells in the crypt region rapidly attenuated their ERK activity while villus cells exhibited prolonged ERK activation (Figure S1C). These data show that EGF elicits different ERK signaling dynamics in crypt or villus cells, highlighting the potential of live-cell biosensors to understand tissue homeostasis.
Lastly, we wanted to use the ERK-KTRLoxP mice to measure MAPK signaling dynamics in single cells of live, unperturbed animals. We performed multiphoton intravital imaging of live mouse epidermis and dermis in ERK-KTRLoxP mice capturing the basal layer of the skin as well as hair follicles, dermal fibroblast, and other tissue resident cells (Figure S1D–E). Our results showed waves of propagating ERK activation in the epidermis similar to those previously described (Hiratsuka, et al., 2015) (Figure S1D). Taken together, these experiments support that transgenic KTR mice offer a versatile tool to study MAPK signaling dynamics in diverse in vitro, ex vivo and in vivo models.
ERK Signaling Patterns in Preimplantation Development
Although ERK signaling has been implicated in preimplantation development, immunostaining for the phosphorylated species of these molecules has been technically challenging (Azami, et al., 2019; Bessonnard, et al., 2014). To determine ERK activity in single cells of the mammalian preimplantation embryo we crossed pairs of ERK-KTRLoxP mice, isolated embryos from different stages of development ranging from E2.5 to E4.5, and quantified activity in each cell by measuring cytoplasmic over nuclear KTR ratios (Figure 1C and 1E–F). We refer to ERK active or inactive cells if KTR signals are predominantly cytoplasmic (C>N) or nuclear (N>C) respectively.
Embryos at the 8–16 cell stages showed moderate levels of ERK activity that was sensitive to the ERK specific inhibitor Ulixertinib (Figure 1E–F, and S2A) (Germann, et al., 2017). Later, at the blastocyst stage, embryos showed predominantly ERK active cells. Interestingly, ERK inactive cells were rare in blastocysts, accounting for 11.8% of all cells at E3.5 and remained similar (12.1%) at E4.5. These inactive cells frequently occurred in pairs in the TE or ICM compartments, but some embryos had none. (Figure 1D and S3A). This overall rarity of ERK low cells was surprising because we would expect these cells to specify the epiblast (Bessonnard, et al., 2014).
Manipulation of FGF-ERK signaling in the blastocyst with ectopic agonists and inhibitors has been instrumental to study PrE and EPI fate determination (Yamanaka, et al., 2010). However, it is unclear how these perturbations alter ERK activity in single cells. To address this question and validate our system we cultured ERK-KTRLoxP blastocysts in the presence of inhibitors or growth factors (Figure 1G). MEK and FGFR inhibitors achieve only moderate ERK inhibition compared to the specific ERK1/2 inhibitor Ulixertinib, which appears to completely block ERK activity (Figure 1H). Conversely, FGF4 treated embryos showed consistently high ERK activity in most cells comparable to the highest levels of ERK activity detected in control embryos (Figure 1G and 1H). Taken together, these data indicate that KTRs enable quantification of single cell ERK activity in live preimplantation embryos.
Cell Cycle Coordinated ERK Signaling Dynamics
Previous reports have shown differential FGF-ERK signaling requirements between the EPI and PrE lineages (Kang, et al., 2013; Yamanaka, et al., 2010). However, our analysis of embryos at multiple developmental stages showed that only a minority of ICM cells had distinctly lower ERK activity (Figure 1D–F). Thus we reasoned that blastomeres may experience transient regulation of the FGFR-ERK signaling axis during fate specification. To test this hypothesis we performed time-lapse confocal imaging of ERK-KTRLoxP embryos starting at E3.5 to visualize ERK signaling dynamics in single cells of developing blastocysts (Figure 2A, S2B, and Movie S1). Tracking and quantification of cells over 12 hr. confirmed that ICM cells show high levels of ERK activity for most of the imaging period, with some cells exhibiting pulsatile ERK activation and a general trend of increasing ERK signaling as cells approach mitosis. (Figure 2A and S2C–D). Strikingly, ERK activity bifurcated in nascent daughter cells at mitotic exit, generating two groups of cells that either rapidly resume high ERK activity or that experience brief pulses of ERK inactivity (1–4 hours) followed by high ERK activation (Figure 2B, 2C, 2E, Movies S2 and S3). Of note, ERK inactivity pulses were only ever observed immediately after mitosis. Thus, we refer to ERK high or ERK low divisions depending on the daughter cell ERK activity. Comparison of multiple embryos revealed variability regarding the fraction of ERK high vs. ERK low divisions suggesting that the bifurcation may occur stochastically (Fig. 2D).
Figure 2 |. ERK activity bifurcates after mitosis in single cells of developing blastocysts.
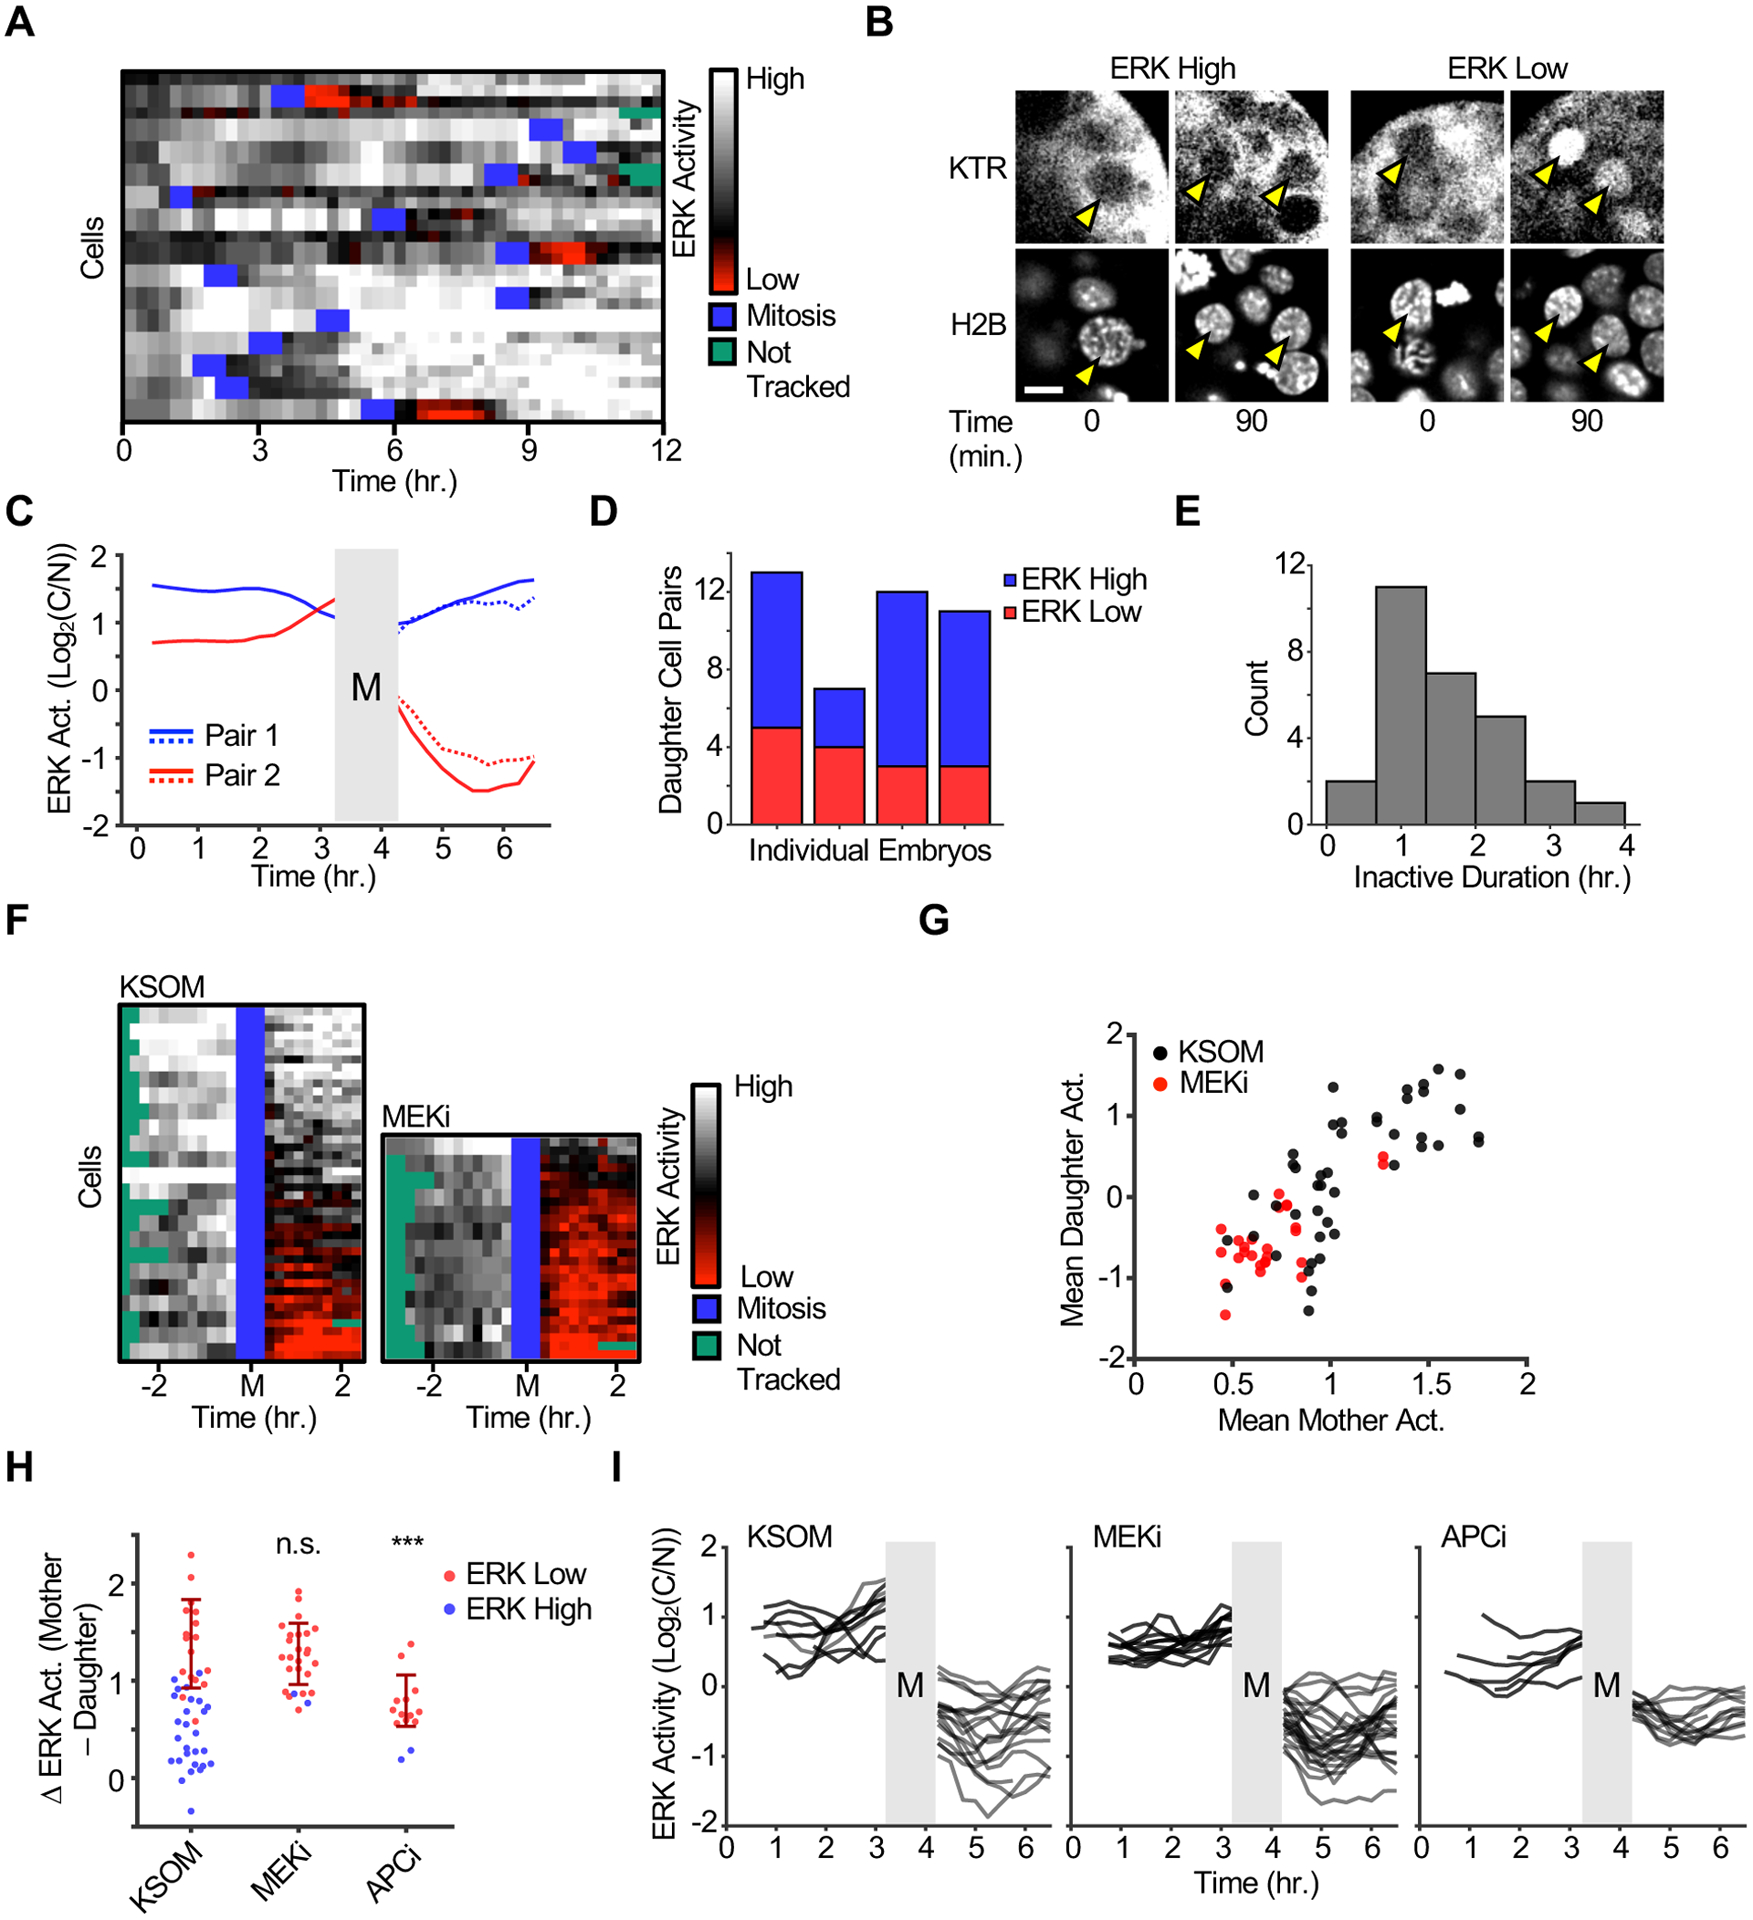
(A) E3.5 blastocysts were isolated from ERK-KTRLoxP animals, mounted in KSOM, and imaged every 15 min. for 12 hr. Single cell ERK activity was quantified and represented as a heat map (see methods for details). Mitotic events and lost tracks are represented in blue and green, respectively. Predominantly cytoplasmic (log2(C/N)>0) or nuclear (log2 (C/N)<0) values are depicted with gray or red scale colormaps respectively. Black represents C=N intensity. Data depicts traces from a single embryo representative of 2 independent experiments.
(B) Representative images of ERK high and ERK low mitotic events observed from the experiment in (A). For each example, the mother cell is shown immediately before entering mitosis and the daughter cells are shown 90 min. after anaphase. Yellow arrows indicate featured cells. Scale bar = 10 μm.
(C) Representative traces of ERK high (Pair 1) and ERK low (Pair 2) mitotic events are plotted. Grey box indicates mitosis. Traces left of mitosis indicate mother cell ERK activity and right of mitosis indicate corresponding daughter cell activities. Each sister cell pair is shown as a solid and dotted line pair.
(D) ERK-KTRLoxP blastocysts were isolated and imaged as in (A). Daughter cell pairs were assigned as ERK high (C>N, blue) or ERK low (C<N, red). Based on 4 individual embryos.
(E) ERK-KTRLoxP blastocysts were isolated and imaged as in (A). The duration of ERK inactivity in ERK low divisions was measured as described in methods. Histogram reflects measurements from 28 ERK low cells from 4 embryos obtained from 2 independent experiments.
(F) E3.5 blastocysts were isolated from ERK-KTRLoxP animals, incubated in KSOM ± MEKi (1 μM PD0325901), and imaged every 15 min. for 9 hr. ERK activity was quantified pre- and post-mitosis as described in methods. ERK activity is represented as in (A) and in silico synchronized to mitosis. Left and right sides of the heat map indicate mother and daughter cell activities respectively. Data represent 22 (KSOM) and 13 (MEKi) mitotic events from 4 and 3 embryos, respectively, from 3 independent experiments.
(G) Scatter plot of mean ERK activity 90 min. before (mother) and after (daughter) mitosis from data in (D). Significant linear correlations between mother and daughter cell activity were observed for both the KSOM and MEKi groups (p = 2.58 × 10⁻⁶ and 0.00063 by F-test, respectively) with R2 values of 0.413 and 0.405, respectively.
(H) E3.5 blastocysts were isolated from ERK-KTRLoxP animals, incubated in KSOM and KSOM with MEKi (1 μM PD0325901) or APCi (2 μM ProTAME), and imaged every 15 min. for 9 hr. Δ ERK activity was defined as the mean ERK activity post-mitosis subtracted from the mean ERK activity pre-mitosis. ERK low (blue) and ERK high (red) cells were defined as daughter cells whose mean ERK activity was less than 0.1 and greater than or equal to 0.1, respectively. Dark red lines indicate mean ± standard deviation of measurements on ERK low cells only. Data represent 22 mitotic events from 4 blastocysts (KSOM), 13 mitotic events from 3 blastocysts (MEKi), and 7 mitotic events from 2 blastocysts (APCi). *** p<0.001 and N.S. p>0.05 by Student’s t-test comparing ERK low cells in each group to the KSOM condition.
(I) Data obtained in (H) is shown as in silico synchronized ERK activity traces. ERK low divisions only are shown for clarity. Grey vertical bar indicates mitosis.
Previous reports have suggested a limited supply of FGF4 in the blastocyst generates differential signaling to specify the EPI and PrE lineages (Krawchuk, et al., 2013). In the case of ERK low divisions, sister cells showed similar levels of ERK activity, but could be surrounded by neighbors that exhibited much higher ERK activation, suggesting that the symmetry breaking event is occurring in mother cells rather than reflecting local FGF4 concentration gradients (Figure 2C and S2E). Indeed, when cells were sorted according to their mean activity after mitosis, we noticed a correlation between mother and daughter cell ERK activation (Figure 2F and 2G). While all cells display high ERK activation for several hours preceding mitosis, mother cells with comparatively lower KTR ratios were more likely to generate daughter cells that exhibited ERK inactivity pulses (Figure 2F and 2G). This raised the possibility that the maternal signaling status before mitosis may influence signaling at mitotic exit. To test this, we incubated embryos in MEK inhibitor to promote modest ERK inhibition and again analyzed mother and daughter cell activity pre- and post-mitosis. Cells in MEK inhibitor still demonstrated a cytoplasmic enrichment of KTR localization prior to mitosis; however, nearly all daughter cells now experienced clear ERK inactivity after mitosis (Figure 2F and 2G).
Further analysis revealed that nearly all daughter cells exhibit a decrease in ERK activity that depends on the mother cell activity in a non-linear fashion. We observed that individual mitotic events appear to segregate into two groups based on the magnitude of this decrease, with ERK low divisions exhibiting a greater differential from maternal activity than ERK high divisions (Figure 2H). Moreover, the ERK activity decrease in MEK inhibitor treated embryos closely resembles that of the ERK low daughter cells in control embryos (Figure 2H and 2I). We then hypothesized that the E3 ubiquitin ligase anaphase-promoting complex (APC), which has been shown to regulate both mitosis and signaling (Kimata, 2019; Wan, et al., 2017), may influence ERK activity at mitotic exit. We treated embryos with the APCCDH1 inhibitor ProTAME and analyzed ERK activity changes as cells complete M phase (Zeng, et al., 2010). Interestingly, even though APCCDH1 inhibition led to modest ERK inhibition in mother cells, the relative decrease between mother and daughter cells was significantly reduced compared to ERK low divisions from control or MEKi embryos (Figure 2H and 2I). Together these data suggest that APC inhibition impairs the regulation of ERK activity at mitotic exit.
ERK Activity Bifurcation at Mitotic Exit Directs EPI Specification
Understanding the regulatory interactions between the cell cycle, FGF-ERK signaling, and gene expression is necessary to understand the mechanism underlying PrE and EPI establishment. Given that our imaging window was relatively short (9 hours), we first tested the effect of inhibitor treatments of the same duration on ICM cell specification by immunostaining for NANOG and GATA6 (Figure 3A and S4C). Following automated measurement of all cells, ICM cells were identified based on their nuclear centroid position within the embryo (Figure S4A and S4B). MEK inhibitor and recombinant FGF4 were still able to bias the expression of NANOG and GATA6 over this interval in the expected patterns (Figure 3A and S4C). Thus, relationships between signaling and cell fate can be perturbed and examined in this window of early blastocyst development. Interestingly, incubation with the APC inhibitor promoted NANOG/GATA6 double positive cells relative to the controls, suggesting that APCCDH1 inhibition impairs lineage commitment in ICM cells (Figure 3A and S4C).
Figure 3 |. ERK activity at mitotic exit governs EPI and PrE lineage commitment.

(A) E3.5 blastocysts were isolated and cultured in KSOM plus indicated inhibitors or growth factors (MEKi, 1 μM PD0325901; APCi, 2 μM ProTAME; 1000 ng/ml FGF4) for 9 hr. Embryos were fixed, immunostained, imaged, and quantified as described in methods. TE cells were excluded from analysis for clarity (see Figure S4A and S4B for details). Data reflects 47 to 153 individual ICM cells from 3 to 8 embryos from 4 independent experiments.
(B) Schematic of experimental workflow to investigate ERK signaling dynamics and fate selection in the same cells. E3.5 ERK-KTRLoxP blastocysts were imaged in KSOM for 9 hr., retrieved, fixed and immunostained as described in methods. H2B-mCherry signal from the live imaging and fixed embryos were aligned in silico to correlate ERK signaling dynamics and marker expression in the same cells. For each cell that was unequivocally identified in both data sets, ERK activity was measured at mitotic exit (60 min.) and at the end of the time lapse period (End Point) (60 min). GATA6 and NANOG signals were then measured and matched with ERK activity measurements for the corresponding cells (see methods for details).
(C-E) ERK-KTRLoxP blastocysts were imaged and immunostained as described in (B). ERK activity at mitotic exit (left) and end point (right) were plotted against normalized NANOG intensity (C), normalized GATA6 intensity (D), normalized log10(GATA6/NANOG) intensity ratio
(E). p values of linear correlation by F-test are shown. Data represent measurements from 40 mitotic cells from 6 embryos from 3 independent experiments.
(F) Data from (C-E) was plotted as normalized NANOG vs. normalized GATA6 with each point colored according to mean ERK activity at mitotic exit (left) or at end point (right).
To study the lineage commitment in cells coming from ERK low or ERK high divisions, we combined time-lapse microscopy of live ERK-KTRLoxP embryos with fixed, end-point analysis of cell fate markers. Embryos were imaged for 9 hours, fixed, immunostained, and re-mounted onto new imaging plates to visualize protein expression (Figure 3B and Movie S4). Embryos were only used for analysis if exceptional in silico alignment of H2B-mCherry nuclear signal was observed (Figure S4D). Thus, embryos that were deformed from the fixation or staining protocols, and embryos that were re-mounted in an orientation that precluded the unambiguous identification of matching cells were discarded. To maximize the likelihood of generating image stacks that could be aligned in silico, fixed embryos were gently reoriented on the imaging plate by pipetting and re-imaged (no more than 3 times).
Because we observe the greatest heterogeneity in ERK activation at mitotic exit, we focused our analysis on cells that underwent mitosis during the time-lapse microscopy period. In particular, we measured mean ERK activity in nascent daughter cells in the hour immediately after mitosis and in the final hour of the time-lapse and looked for relationships between ERK signaling and protein expression of NANOG and GATA6 (Figure 3B). Cells that inhibit ERK at mitotic exit expressed elevated levels of NANOG and moderately lower levels of GATA6. Accordingly, cells that resume high ERK activity after mitosis displayed enhanced GATA6 and diminished NANOG expression (Figure 3C and 3D). While levels of each of these factors were independently correlated with ERK activity (r2 = 0.233 and r2 = 0.285 for ERK vs. GATA6 and ERK vs. NANOG, respectively), we found that analyzing the relationship between ERK and GATA6 over NANOG ratios resulted in a superior correlation than either marker alone (r2 = 0.332) (Figure 3E). 3D scatter plots with NANOG, GATA6 and ERK activity at mitotic exit showed an ERK sensitivity landscape for cells selecting between the EPI and PrE lineages (Figure 3F). Importantly, analyzing ERK activity of an equivalent duration, but in the final hour of the time course, and examining the relationships with these fate markers indicated no significant correlation between any of the variables described above (Figure 3C–F). Together, these data suggest that ERK activity bifurcation at mitotic exit directs the GATA6/NANOG expression ratio in single cells.
Modeling ICM signaling behavior in ES cells
While the blastocyst is a powerful model to explore how signaling dynamics regulates cell fate specification in development, it is limited by its low phototoxicity tolerance and lack of tools for robust tracking of cells in 3D time-lapse data sets. In contrast, ES cells are accessible to rapid imaging and automated cell tracking while closely resembling the epiblast of the preimplantation embryos (Fernandez-de-Manuel, et al., 2017; Boroviak, et al., 2015; Schroter, et al., 2015; Nichols and Smith, 2012). To further explore the mechanism underlying ERK signaling at mitotic exit, we derived ES cells from ERK-KTRLoxP animals and validated the sensor using ERK inhibitor (Figure 4A). Time lapse microscopy of ERK-KTR ES cells revealed a bifurcation of ERK activity at mitotic exit, sustained activity before mitosis, and a correlation between mother and daughter cell activity that recapitulate our observations in ICM cells (Figure 4B–C and S5A). Incubation with MEK inhibitor again increased the frequency of ERK low divisions (Figure 4D, Movie S6 and S7). Importantly, ERK inhibitor abolished cytoplasmic KTR localization for all but 5 min. prior to mitosis, indicating that prolonged ERK activation before mitosis is not an artefact of nonspecific nuclear export before breakdown of the nuclear envelope (Movie S5).
Figure 4 |. ERK-KTR ES cells recapitulate ICM signaling dynamics.

(A) ES cells were derived from ERK-KTRLoxP animals as described in methods and seeded into imaging plates coated with fibronectin with or without ERKi (5 μM Ulixertinib). Images were obtained every 5 min. Representative images before or after (15 min.) inhibitor addition are shown. Scale bar = 20 μm.
(B) ERK-KTR ES cells were seeded to imaging plates coated with fibronectin and cultured in complete 2i growth media. Next day, MEK and GSK3β inhibitors were removed and cells were imaged every 5 min. for 18 hr. ERK activity in single cells was measured and quantified as described in methods. ERK high and low cells were defined as cells whose mean ERK activity after mitosis was greater than −0.1 or less than −0.1, respectively. Following this sorting, randomly selected traces were plotted from each group. Data represents 4 experimental replicates.
(C) Mean ERK activity before (mother) and after (daughter) mitosis (90 min.) was calculated from ERK activity traces obtained in (B). Significant linear correlation was observed (p = 3.95 × 10⁻¹² and R2 = 0.265). Data represent 159 mitotic events.
(D) ERK-KTR ES cells were seeded as described in (B) and imaged every 5 min. for 20 hr. in growth media without inhibitors or growth media with MEKi (2 μM PD0325901). Fraction of ERK low divisions was calculated as described in methods. Data represent >700 mitotic events from >8 replicates for each condition. *** p < 0.001 by a Student’s t-test.
The role of ERK signaling in NANOG transcriptional and post-translational regulation has been previously investigated (Jin, et al., 2016; Kim, et al., 2014; Ochiai, et al., 2014); however, the regulation of NANOG dynamics at mitotic exit and its dependence on ERK activity remains unexplored. In order to independently monitor NANOG protein stability and Nanog gene expression we generated an ES cell line with a targeted genomic insertion at the Nanog locus of a Venus fluorescent protein followed by the self-cleaving peptide P2A and mCherry and refer to this line as NV2C (Nanog-Venus-2a-mCherry) cells (Figure 5A). Thus, while the Venus signal is linked to NANOG protein levels, the mCherry signal is independent of NANOG stability and can serve as a proxy for transcriptional activity. To validate our reporter line we cultured NV2C cells in pluripotency maintenance (2i/LIF) or extraembryonic endoderm (XEN) differentiation media for 24 hours and measured Venus and mCherry levels in single cells (Niakan, et al., 2013). As expected, both the NANOG-Venus and mCherry signals were significantly downregulated in XEN differentiation medium compared to 2i/LIF, reflecting attenuated Nanog expression (Figure 5B and 5C). Inhibition of translation or proteasomal degradation showed downregulation or upregulation of NANOG-Venus levels respectively while the mCherry signal remained stable (Figures 5D & 5E). These results indicate that NV2C cells independently report NANOG protein stability and gene expression.
Figure 5 |. ERK inhibition promotes rapid NANOG stabilization at mitotic exit.
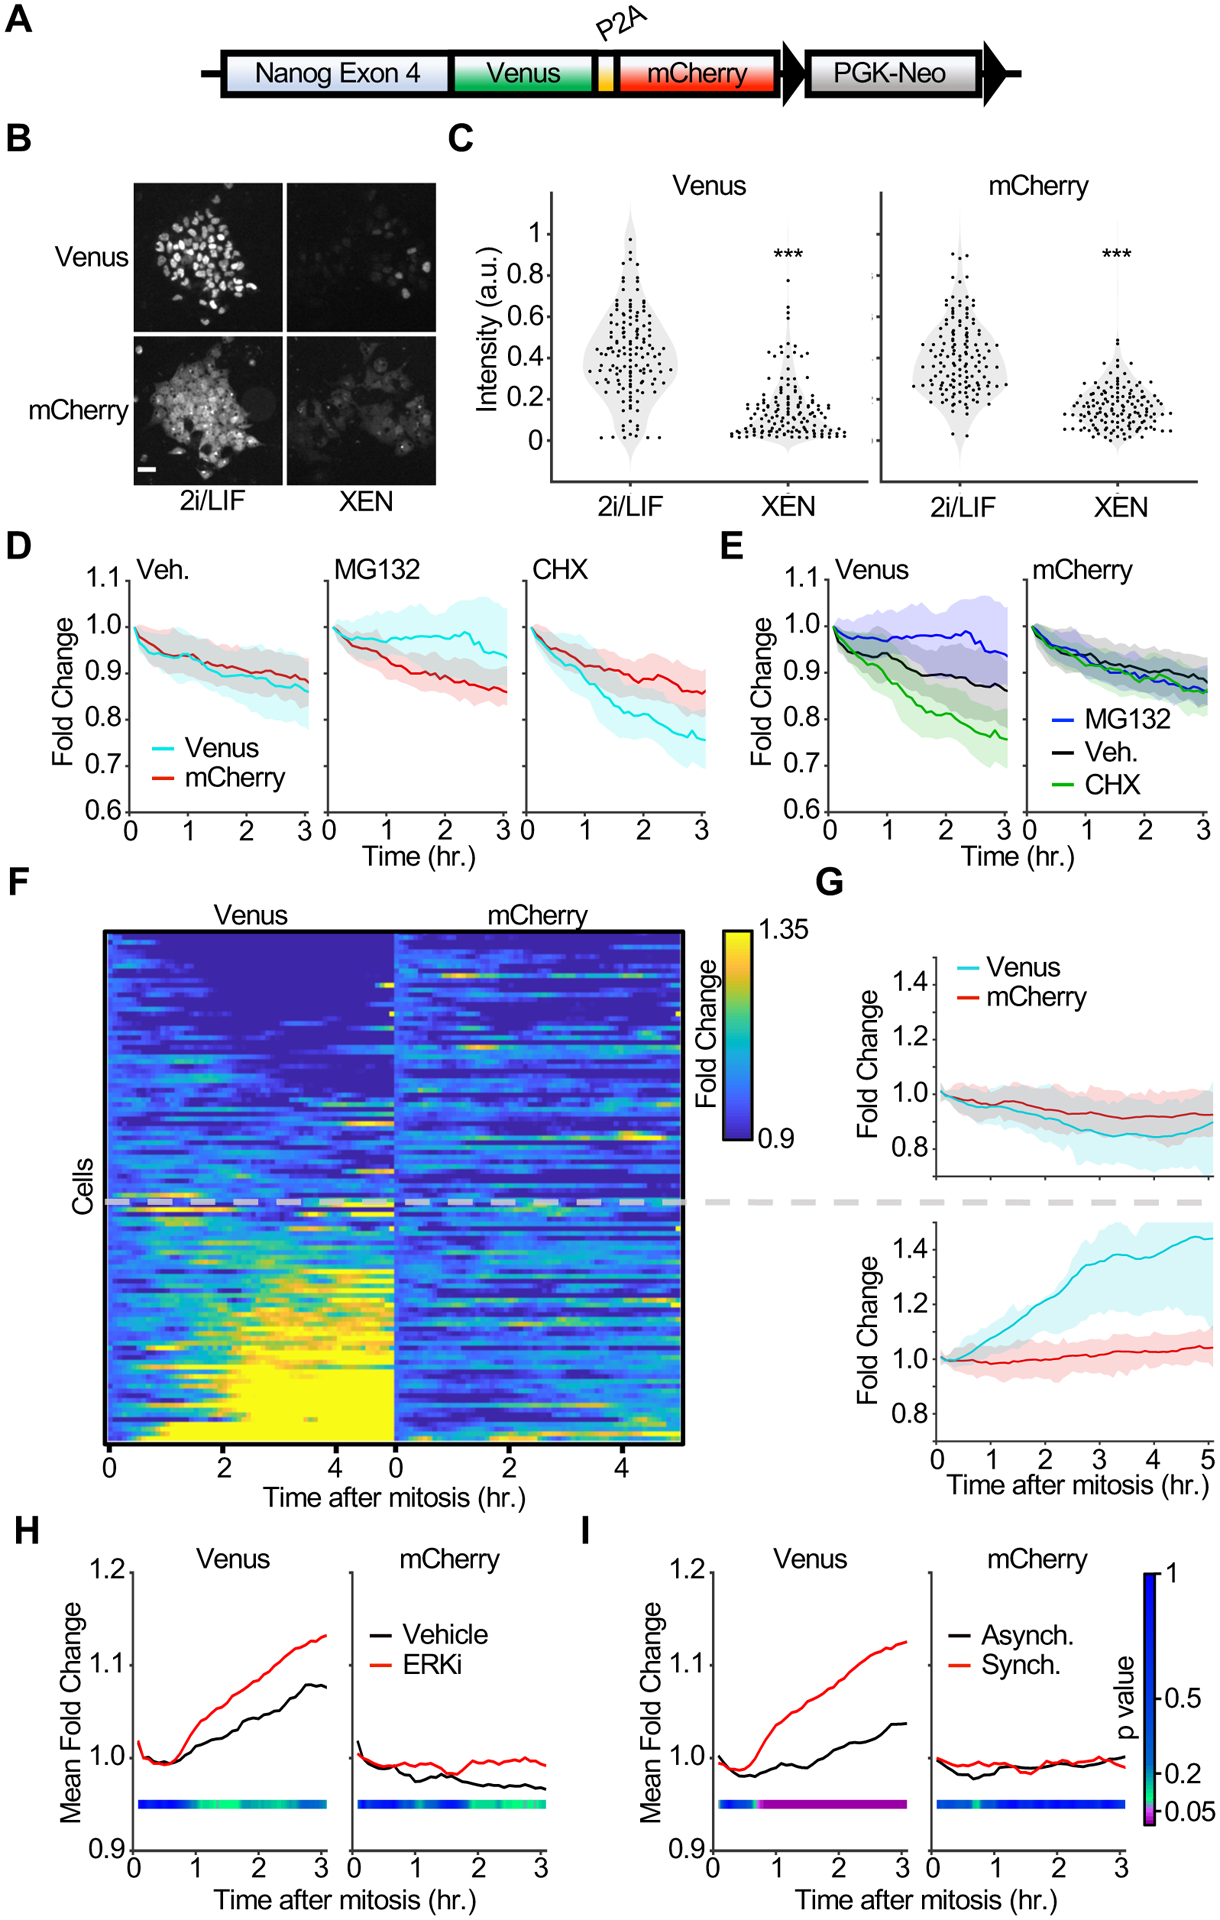
(A) Schematic representation of the NANOG NV2C reporter inserted at the endogenous Nanog locus in mouse ES cells (see methods for details).
(B) NV2C ES cells were seeded to imaging plates and cultured in 2i/LIF media or XEN differentiation media for 24 hr. before imaging. Representative colonies from 16 replicates are shown. Scale bar = 30 μm.
(C) Quantification of Venus and mCherry intensities from single cells obtained in (B). n>1000 cells for each condition from 16 replicates. ***p<0.001 by Kolmogorov-Smirnov tests.
(D) NV2C ES cells were seeded onto imaging plates and cultured in ES growth media without inhibitors. Cells were imaged every 5 min. for 3 hr. and MG132 (10 μM) or Cycloheximide (CHX, 20 ug/ml) were added after 35 min. of imaging. Single cell Venus and mCherry intensities were quantified and analyzed as described in methods. Mean fold change (solid lines) with 75th and 25th percentiles (shaded area) are plotted for 108, 73, and 85 cells from 4 replicates each for the vehicle, MG132, and CHX groups, respectively.
(E) Data from (D) plotted as mean fold change (solid lines) and 75th and 25th percentiles (shaded area) of Venus (left) and mCherry (right) intensities from each condition.
(F) NV2C ES cells treated as in (D) were imaged every 5 min. for 20 hr. Venus and mCherry intensities were quantified as described in methods and in silico synchronized to mitotic exit. Data are plotted as fold change in intensity for the first 10 min. after anaphase. Overlaid grey dashed line indicates cells that upregulate NANOG at mitotic exit (lower) and cells that maintain or downregulate NANOG expression (upper). Data represents 122 mitotic events from 6 experimental replicates.
(G) Average traces are plotted for data in (F). Plots show mean fold change (solid lines) and 75th and 25th percentiles (shaded area) of Venus and mCherry intensities for cells that maintain or downregulate NANOG (upper) and cells that upregulate NANOG (lower).
(H) NV2C ES cells were seeded as in (E) and treated with or without ERKi (5 μM Ulixertinib). Single cell traces of Venus and mCherry signals were quantified as in (F). Mitotic events were synchronized in silico and mean fold change of Venus and mCherry intensities for all cells analyzed are plotted. Data represents >122 cells from 6 replicates each. Student’s T-test was performed for means at each time point and p values are plotted according to color bar in Figure 5I.
(I) ERKi (5 μM Ulixertinib) treated cells obtained in (H) are plotted to compare average Venus and mCherry fold changes in asynchronous (black) and mitotic exit in silico synchronized (red) individual cells. Data represents >140 individual cells from 6 replicates for each condition. Student’s T-test was performed for means at each time point and p values are plotted according to color bar.
Next, we live imaged NV2C cells and monitored NANOG-Venus and mCherry dynamics at mitotic exit. In silico synchronization of individual cells to mitotic exit revealed Venus levels were rapidly upregulated in a subset of cells after mitosis without a corresponding increase in mCherry intensity (Figure 5F, 5G, & Movie S8). This suggests heterogeneous posttranslational regulation of NANOG at mitotic exit. Therefore, given the differential ERK activation we observed in ES cells and in blastocysts, we asked how ERK signaling regulates NANOG dynamics at mitotic exit. We incubated NV2C cells in ERK inhibitor to induce homogenous ERK inhibition, in silico synchronized cells to mitotic exit, and analyzed Venus and mCherry dynamics (Figure 5H). Cells in ERK inhibitor exhibited enhanced Venus expression at mitotic exit while mCherry levels were relatively stable. Moreover, a comparison of synchronized and unsynchronized cells showed that, while ERK inhibition promotes NANOG-Venus expression in all cells, the effect of ERK inhibition is greatest at mitotic exit (Figure 5I). Taken together these data provide evidence that NANOG protein stability is regulated at mitotic exit and is enhanced by ERK inhibition.
DISCUSSION
Development of multicellular organisms relies on cell fate choices that occur as a result of constant cross regulation between signaling and gene expression. The dynamic and noisy nature of these biological processes require approaches that enable single cell high temporal resolution measurements in real time. Here we describe the generation and validation of a mouse line that enables in vivo and ex vivo analysis of ERK signaling dynamics with single cell resolution. Results show that this tool can be used in primary cells, multicellular organoids or even live animals to interrogate the role of signaling dynamics and cell-cell communication in tissue homeostasis and development. Our ERK KTR mice are largely equivalent to the previously reported Eisuke mice (EKAREV FRET sensor) (Hiratsuka, et al., 2015) however, studies that require tissue specific expression of the biosensor will benefit from the CRE dependent design of the ERK KTR line.
ERK signaling has been implicated in specifying the mammalian preimplantation embryo however the signaling dynamics leading to cell fate choices had not been explored. Our data show that ERK activity is surprisingly high throughout all stages of pre-implantation development, with a small subset of cells experiencing transient ERK inhibition in the blastocyst stage. Interestingly, ERK activity at the blastocyst stage can be completely blocked with ERK specific inhibitors but other conditions previously used to bias cell fate specification (MEK or FGFR inhibitors) only partially inhibit ERK activity, indicating that even minor perturbation of FGF-ERK signaling axis is sufficient to prevent proper lineage specification in the ICM (Figure 1H). While we observed increased ERK activation upon FGF4 stimulation, many FGF4 treated blastomeres exhibited comparable ERK activity to cells in control embryos, suggesting that FGF4 is locally present in saturating amounts to achieve maximal FGFR signaling output to ERK. A recent study reported pERK staining in nearly all cells of blastocysts and differential pERK staining within the ICM, in agreement with our measurements (Azami, et al., 2019).
Further analysis of ERK activity dynamics in single cells of the blastocyst revealed that an apparently stochastic number of cell divisions result in 1–4 hour pulses of ERK inactivity that then transitions back into high levels of ERK activation. Sister cells exhibited similar signaling patterns that could be quite different from non-sister neighbor cells, resembling previously reported ERK signaling dynamics in ES cells (Deathridge J et al. Development 2019) (Figure S5A). Interestingly, cells that experienced ERK inactivity pulses at mitotic exit exhibited higher NANOG and lower GATA6 expression (Figure 3F). This finding is in agreement with several studies that suggest low ERK activity in ICM cells specifies the EPI lineage, but to our knowledge no previous report postulates a model incorporating transient inactivation of ERK. This correlation suggests a coordination between ERK signaling and the cell cycle that is important for cell fate determination; however, studies utilizing live cell biosensors for NANOG and GATA6 alongside kinase activity biosensors in embryos are necessary to understand the temporal relationships between mitotic exit signaling and ICM progenitor specification.
The amplitude of the ERK activity decrease at mitotic exit correlated with maternal signaling before mitosis and was dampened by APCCDH1 inhibition. An increasing body of evidence supports cell-cycle independent, APC-mediated function in cell fate determination through the degradation of developmental signaling pathway components, including the ERK pathway via downregulation of Raf (Kimata, 2019). Moreover, ERK itself can downregulate APC activity constituting a positive feedback loop that could explain the dependency on mother cell activity (Wan, et al., 2017). We report that APC inhibition led to an increase in uncommitted ICM progenitors. This could be a result of the conflicting roles of this treatment: APC inhibition increased the frequency of ERK low divisions which may limit GATA6 expression, but also attenuated the amplitude of the inhibition to promote only modest NANOG expression. Additional work is required to understand the regulatory interactions between APC activity, ERK signaling, and fate determination in embryos. Though the molecular mechanism behind the ERK activity bifurcation remains to be characterized, it is tempting to speculate that feedback regulation between the mitotic machinery and ERK pathway components may desensitize pairs of daughter cells to FGF signals and ultimately specify the epiblast.
Characterization of ES cells derived from our ERK KTR mouse line revealed that ERK activity bifurcation at mitotic exit also occurs in ES cells and depends on maternal signaling levels. Moreover, we found that NANOG protein stability at mitotic exit is particularly sensitive to ERK inhibition. A model where NANOG levels are sustained via protein stabilization rather than transcriptional regulation may explain why inhibiting transcription in blastocysts with flavopiridol does not promote rapid loss of NANOG expression (Bessonnard, et al., 2017). These findings provide a potential explanation for the significance of ERK activity at mitotic exit to specify the EPI and PrE lineages via modulation of NANOG levels and are in good agreement with recent reports suggesting that cell cycle status plays a critical role in regulating pluripotent cell differentiation. Human and mouse embryonic stem cells (ESCs) are both more responsive to differentiation cues during G1 compared to S and G2, suggesting a mechanism for coordination of the cell cycle program with the signaling network (Singh, et al., 2015; Pauklin and Vallier, 2013). As ERK has been reported to regulate several pluripotency factors, further experimentation is required for a complete understanding of the consequences of ERK signaling at mitotic exit (Ma, et al., 2016). We anticipate that a better understanding of the cross regulation between cell cycle, signaling and differentiation will ultimately facilitate the use of ES and iPS cells for therapeutic purposes.
LIMITATIONS
The findings of the present study possess some notable limitations. The experiments including the APCCDH1 inhibitor, ProTAME, showing an effect on both ERK signaling at mitotic exit and ICM cell fate commitment are not sufficient to show a direct regulatory mechanism between ERK and APC. Though there is literature to support that APC could directly regulate ERK and vice versa, we acknowledge that a pharmacological inhibitor of this essential regulator of mitosis could regulate both ERK activity and ICM differentiation via a number of indirect mechanisms. A more detailed analysis with additional cell cycle component inhibitors would help identify whether and how this regulatory control functions.
The connections between ERK activity, cell cycle, and NANOG/GATA6 protein levels in embryos and ES cells are still unclear. We present correlative evidence that: i) ERK activity is uniquely heterogeneous immediately following mitosis, ii) mitotic exit signaling correlates with NANOG and GATA6 expression, iii) NANOG protein is stabilized in a subset of ES cells after mitosis, and iv) ERK inhibitors promote NANOG stabilization specially after mitosis. However, due to spectral overlap between sensors and other current restrictions, we were unable to directly measure NANOG and GATA6 with the ERK KTR in live embryos or ES cells. Thus we cannot conclusively claim that ERK signaling at mitotic exit is the cause of (i) cells selecting between EPI and PrE fates or (ii) the rapid NANOG stabilization in ES cells. The mechanistic links between cell cycle status, ERK signaling and NANOG dynamics still remain an open question.
STAR METHODS
RESOURCE AVAILABILITY STATEMENT
Lead Contact
Further information and requests for resources and reagents should be directed to and will be fulfilled by the lead contact, Sergi Regot (sregot@jhmi.edu).
Material Availability
The ERK-KTRLSL mouse line is available from The Jackson Laboratory as JAX#035566. The Nanog targeting vector is available from Addgene.
Data and Code Availability
Live imaging of embryo and corresponding fixed embryo data sets is available at Biostudies (https://www.ebi.ac.uk/biostudies/). MATLAB code generated to assign ICM versus TE cell identity on basis of cell position is available from: https://github.com/MichaelPokrass/EmbryoScripts.
EXPERIMENTAL MODEL AND SUBJECT DETAILS
Animals
All mice were housed, handled, and included in experiments according to the approved Institutional Animal Care and Use Committee protocol M019M487 of the Johns Hopkins University School of Medicine. The ERK-KTRLSL line was generated by injection into embryos from mice of B6SJL background and bred into the CD1 background. To generate the ERK-KTRLoxP mice, male ERK-KTRLSL mice were crossed with female Sox2-CRE mice and GFP+ offspring were bred into the CD1 background. Wild-type embryos were collected from CD1 background mice.
Embryos
Mouse preimplantation embryos were cultured in EmbryoMax Advanced KSOM medium (Milipore Sigma) under mineral oil (Sigma Aldrich) on polystyrene plates. Embryos were maintained in a humidified incubator at 37°C with 5% CO2 and 3% O2.
Primary Cell Culture
Primary mouse embryonic fibroblasts (MEFs) were maintained in MEF culture medium (DMEM with 15% fetal bovine serum (FBS), 100 U/ml penicillin and 100 U/ml streptomycin) and cultured on polystyrene plates at 37°C with 5% CO2 and 3% O2. Primary mouse 2D gut enteroid cultures were maintained in organoid culture medium (advanced DMEM-F-12 medium with 100 U/ml penicillin and streptomycin, 10 mM HEPES buffer, 1x Glutamax, 1X B27, 1 mM N-acetylcysteine, 100 μg/ml primocin, 50 ng/ml EGF, 10% Noggin-conditioned medium, and 20% R-spondin conditioned medium) and cultured on Matrigel-coated optical polymer plates at 37°C with 5% CO2. Primary mouse ES cells were maintained in either ES culture medium (advanced DMEM-F-12 medium with 100 U/ml penicillin and streptomycin, 15% ES-qualified FBS, 1x GlutaMAX, 1X MEM non-essential amino acids (Thermo), 55 μM 2-mercaptoethanol (BME, Gibco), and 1000 U/ml leukemia inhibitor factor (LIF) (ESGRO, Milipore Sigma)) on Mitomycin C-inactivated feeder MEFs or feeder-free with ES culture medium supplemented with 1 μM PD0325901 and 3 μM CHIR99021 (2i) on 0.1% gelatin-coated (Milipore Sigma) polystyrene plates at 37°C with 5% CO2 and 3% O2.
METHOD DETAILS
Mouse Generation
The ERK KTR reporter construct was cloned into a Rosa26 targeting vector (gift from Dr. Jeremy Nathans). Cas9 protein, gRNA, and purified linear DNA insert was introduced to B6SJL embryos by pronuclear injection and transferred to pseudopregnant ICR females. Litters were screened for integrants by PCR amplification of the CAG promoter with F CMV and R Chkactin oligos. CAG+ males were crossed with Sox2-CRE females (gift from Dr. Jeremy Nathans) to generate animals with germline expression of reporters. Offspring were screened for visible GFP expression by blue light flashlight (Nightsea). Founder lines were bred into CD1 background.
Targeted Nanopore Sequencing
Genomic DNA extracted from mouse tail using Nanobind Tissue Big DNA kit (Circulomics #NB-900-701-01). Mouse tail was incubated with proteinase K and Buffer CLE3 for 90 min on a ThermoMixer at 55 degrees C and 900 rpm. DNA was incubated in elution buffer overnight. Size selection was performed using Short Read Eliminator (Circulomics #SS-100-101-01) followed by a DNA clean-up using 0.9 AMPure XP (Beckman Coulter, A63881) beads. DNA quantification was done using the Qubit fluorometer (Thermo) before sequencing. Targeted Nanopore Sequencing with Cas9 was performed as previously described (Gilpatrick et al. 2020). Library prep was performed using Oxford Nanopore Sequencing 1D sequencing kit (SQK-LSK109). Each sample was sequenced using a 9.4.1 version flow cell using the MinION sequencer. Basecalling was performed using the GUPPY algorithm (Version 3.2.1) to generate FASTQ reads from the electrical data. Reads were aligned to a synthetic reference created by fusing the mouse reference genome (mm10) and the known insert sequence using Minimap2(Li 2018). Analysis of the insert coverage was performed using Samtools (Li, et al., 2009) and insert coverage was visualized using IGV and Ribbon. Insertion sites were verified by PCR amplification of sequence spanning junction of reference genome and insert sequence with multiplexed reaction including oMP106, oMP109, and oMP115 oligos.
MEF derivation and culture
Primary MEFs were derived from ERK-KTRLoxP and wild type mice as previously described (Xu, 2005). Following timed matings, embryos were dissected from mice at E13.5. Embryos were washed in ice-cold, sterile PBS and, using forceps, the brain, liver, and heart were manually removed and discarded. Embryos were cut into fine pieces and transferred to ice-cold 0.25% trypsin-EDTA and incubated at 4°C overnight. Next, the embryos were incubated at 37°C for 30 minutes and the tissue was vigorously pipetted in MEF culture medium. When tissue was separated into a uniform cell suspension, the cells were plated onto tissue culture flasks in MEF medium. For generation of feeder cells for ES experiments, MEFs were expanded to passage 3 and inactivated by 2.5 hr. incubation with 10 μg/mL mitomycin C (Milipore Sigma). Adherent cells were expanded and cultured in MEF culture medium. For imaging experiments, 7 × 10³ MEFs were seeded to fibronectin (EMD-Milipore) coated 96-well glass-bottom plates. MEFs were serum starved 16 hours before stimulus addition.
Gut Enteroid Culture
Primary 2D gut enteroids were derived as previously described (Thorne, et al., 2018). Briefly, mouse jejuna were dissected from 1–6 month old mice. Jejuna were cut open lengthwise, washed with PBS, and incubated 30 minutes in ice-cold PBS containing 100 U/ml penicillin and streptomycin, 1.5 mM DTT, 2 mM EDTA, and 10 μM Y-27632. The jejuna were transferred to ice-cold PBS with 2 mM EDTA and shaken for 90–120 seconds to release crypts. Intestinal tissue was discarded and the crypt suspension was washed three times in DMEM with 10% FBS by centrifugation at 300 × g for 3 minutes. The crypts were resuspended in DMEM with 10% FBS and filtered through a 500 μm strainer followed by a 70 μm strainer. The crypts were pelleted at 200 × g for 3 minutes and resuspended in attachment media, which consisted of basal organoid media (advanced DMEM-F-12 medium with 100 U/ml penicillin and streptomycin, 10 mM HEPES buffer, and 1x Glutamax) supplemented with 1 mM N-acetylcysteine, 1x B-27 supplement, 50 ng/ml EGF, 100 nM LDN-193189, 1 μg/ml R-spondin 1, 10 μM CHIR99021, and 10 μM Y-27632 and seeded to optical polymer 96-well plates coated with 0.8 mg/ml growth factor reduced Matrigel diluted in basal organoid media. Crypts were incubated in attachment media overnight before media was exchanged for organoid culture medium. Enteroids received fresh organoid culture medium every 24 hours and were cultured up to one week.
Prior to EGF addition experiments, organoid culture medium was exchanged for equivalent medium without EGF overnight. Labeling of S-phase cells was performed alongside EGF addition. EdU was added to media to a final concentration of 10 μM for a 3 hour incubation followed by fixation in ice-cold methanol. Cells were washed and labeled via click chemistry with Fluor Azide 488 (Thermo Fischer Scientific). Regions of EdU positive cells were used to designate crypt-like regions and EdU negative cells defined the villus-like regions(Thorne, et al., 2018).
Imaging
Images were acquired a Metamorph-controlled Nikon Eclipse Ti microscope. For epifluorescence imaging, data was acquired using 10X and 20X air objectives and a Hamamatsu sCMOS camera. For confocal imaging, data was acquired using 20X air, 40X oil, or 60X oil objectives, a Yokogawa CSU-W1 spinning disk confocal unit, and a Photometric Prime 95B sCMOS camera. Live specimens were maintained at 37°C in 5% CO2 in a humidified environmental control chamber from OKOlabs.
Intravital Imaging
Multiphoton microscopy was performed as previously described (Pineda, et al., 2015). Mice were maintained on anesthesia with nose cone supply of vaporized isofluorane and placed on a warming pad. Skin was mounted on a custom-stage and covered by a glass coverslip. A LaVision TriM Scope II (LaVision Biotec) microscope equipped with a Chameleon Vision II (Coherent) 2-photon laser (using 940nm) and a Chameleon Discovery (Coherent) two-photon laser (using 1120nm) was used to acquire images through a Nikon 40x/1.15 water immersion objective at an interval of every 6.25 minutes for 3.5 hours.
Preimplantation Embryo Culture
Embryos were collected at indicated developmental stages following timed matings of mice maintained in a 12-hour light-dark cycle according to previously described protocols(Behringer, 2014). For live imaging experiments, embryos were transferred to glass-bottom microwell dishes (MatTek) and maintained in an environmental control chamber (OKOlab) and imaged every 15 minutes for 9–12 hours, sampling a depth 60 μm at 5 μm steps. For inhibitor incubations, embryos were transferred to EmbryoMax Advanced KSOM medium with the specified concentrations of inhibitors and incubated for at least 20 minutes before placing the glass-bottom dish in the environmental control chamber. For FGF4 addition experiments, zonae pellucidae were removed by brief incubation in Acid Tyrode’s solution and FGF4 was co-administered with 1 μg/ml heparin (Sigma Aldrich).
Embryo Immunofluorescence
Embryos were cultured in EmbryoMax Advanced KSOM medium with specified inhibitor or growth factor conditions prior to fixation in 4% formaldehyde (Sigma Aldrich). Fixed embryos were washed and then permeabilized in 0.5% Triton X-100 and 100 mM glycine in PBS. Embryos were blocked in 2% FBS and incubated with primary antibodies at 4°C diluted in blocking buffer overnight. Embryos were washed, blocked again, and incubated with secondary antibodies at RT for 1 hour. Embryos were washed, and mounted to glass-bottom plates in PBS.
ES cell culture and editing
Embryonic stem cells were derived as previously described (Behringer, 2014). Blastocysts were dissected from mice at E3.5 and cultured overnight in advanced KSOM to allow embryos to hatch. Once hatched, blastocysts were transferred to a gelatin-coated tissue culture dish with ES culture medium and monitored for attachment and ES cell outgrowth. Outgrowths were disaggregated by incubation with 0.25% trypsin-EDTA for 5 minutes at 37°C and gently pipetted up and down in ES culture medium to reduce the mass of cells to 3–4 cell aggregates. The aggregates were transferred to tissue culture dishes with feeder cells and inspected for primary ES cell colony formation daily. If individual ES cell lines generated cultures with extensive differentiated cell types they were discarded. Cultures that contained primarily ES cell colonies were expanded and cultured with daily media exchanges and were passaged every 2–3 days depending on confluence and growth rate.
For imaging experiments, ES cells were incubated in 0.05% trypsin-EDTA, pipetted to disaggregate colonies into single cells, and 1–3 × 10³ cells were seeded to fibronectin-coated 96-well glass-bottom plates. Single cells were cultured in ES culture medium with 2i for 48 hours to allow colony formation before imaging. ES cells were imaged in ES culture medium (without 2i) unless otherwise specified. For differentiation experiments, ES cells were seeded to glass-bottom plates and then incubated in XEN differentiation media consisting of DMEM-F12 with 15% FBS, 100 U/ml penicillin and streptomycin, 100 μM BME, 10 nM retinoic acid, and 10 ng/ml Activin A for 24 hours (Niakan, et al., 2013).
The Nanog-Venus-2a-mCherry targeting plasmid was cloned from a previously described mouse targeting vector, Nanog-2a-mCherry (gift from Rudolf Jaenisch, Addgene plasmid # 59995) (Faddah, et al., 2013). In brief, a short linker sequence followed by the mVenus fluorescent protein was inserted downstream of the Nanog coding sequence and immediately before the 2a-mCherry cassette. Approximately 1 kb each of the original 2 kb homology arms were retained and flanked with sgRNA recognition sequences identical to the target sequence in the mouse genome to generate a “double cut HDR donor” repair template plasmid (Zhang, et al., 2017). Nanog-Venus-2a-mCherry repair template was co-transfected (Lipofectamine 2000, Invitrogen) with PX458 (gift from Feng Zhang, Addgene plasmid # 48138) to ES cells derived from wild type animals (Ran, et al., 2013). Cells were cultured on neomycin resistant feeder MEFs (Milipore) and selected with G418 to obtain cells with targeted integration of repair template.
QUANTIFICATION AND STATISTICAL ANALYSIS
Image Analysis
Primary images from 2D time lapse data sets of cells with H2B-mCherry nuclear marker (ERK-KTR ES cells, ERK-KTRLoxP epidermis) were used to segment nuclei and measure fluorescence intensity with custom Cell Profiler pipelines. Nuclear masks were used to track cells through time series (custom software) and calculate KTR C/N ratios as previously described. ERK high or ERK low divisions in ERK-KTR ES cells were manually scored as cells that either have C>N KTR intensity after mitosis or cells that have N<C intensity after mitosis for at least 30 consecutive minutes. Some experiments included cells without a designated nuclear marker (NV2C ES cells) or that grow too densely for reliable segmentation (2D gut enteroids) and cells from these experiments were tracked and quantified by manually constructing regions of interest and measuring image intensity in Fiji.
For 3D embryo image sets, single cell ERK activity was tracked and quantified manually. Briefly, H2B-mCherry signal was used to define the nuclear boundary in each cell. KTR-mClover intensity was quantified in the nucleus and in a smaller region of the cytoplasm just outside the nuclear boundary. Measurements were made in the plane where the largest region of the nucleus was sampled. Both single time and time lapse KTR ratio measurements were made on live embryos and quantified in this way. For quantification of NANOG, GATA6, and CDX2 intensities, 3D image sets were analyzed by MINS as previously described (Lou, et al., 2014). In experiments where CDX2 staining was not possible, TE vs ICM cell definition was assigned by cell position within the embryo. XYZ coordinates from MINS output were used to construct a convex hull of embryo volume in MATLAB (custom software). Cells on the surface of hull were assigned TE identity and cells within hull were assigned ICM identity.
Statistical Analysis
All graphs were generated and all statistical analysis was performed in MATLAB. Data are represented as mean ± standard deviation or with 75th and 25th percentiles as indicated. Student’s t-test or Kolmogorov-Smirnov tests were used to determine significance as indicated in legends. Significant correlation was determined by fitting data to linear regression model and using F-test. Sample sizes, including the number of cells, mitotic events, and embryos in each experiment and p-values are indicated in figures and figure legends.
Supplementary Material
Movie S1. Video of live ERK-KTRLoxP E3.5 blastocyst. Related to Figure 2. H2B-mCherry (left) and ERK-KTR-mClover (right) were recorded over 12 hour time course with 15 minute imaging interval. ERK activity is high in all cells, except brief inactivity in some cells after mitosis.
Movie S2. Video focusing on ERK low division observed during blastocyst time lapse imaging. Related to Figure 2. H2B-mCherry (left) and ERK-KTR-mClover (right) are shown before and after mitosis for total duration of 315 minutes.
Movie S3. Video focusing on ERK high division observed during blastocyst time lapse imaging. Related to Figure 2. H2B-mCherry (left) and ERK-KTR-mClover (right) are shown before and after mitosis for total duration of 245 minutes.
Movie S4. Video demonstration of connecting ERK signaling dynamics and lineage marker analysis. Related to Figure 3. Embryo was collected at E3.5, imaged as described in methods, then fixed, immunostained and re-imaged. Video shows agreement between H2B-mCherry signal after in silico alignment of images.
Movie S5. Video of ERK-KTR ES cells undergoing mitosis in presence of ERKi. Related to Figure 4. ERK-KTR ES cells were incubated with ERKi (5 μM Ulixertinib) and imaged every 5 minutes. H2B-mCherry (left) and ERK-KTR-mClover (right) are shown for 160 minutes. Note persistent nuclear localization of ERK-KTR in all but one frames before mitosis.
Movie S6. Video of ERK activity bifurcation after mitosis in ERK-KTR ES cells. Related to Figure 4. ERK-KTR ES cells were cultured in ES medium and imaged every 5 minutes for 800 minutes. ERK-KTR-mClover intensity is shown. ERK high and ERK low divisions are observed.
Movie S7. Video of ERK activity bifurcation after mitosis in MEKi-treated ERK-KTR ES cells. Related to Figure 4. ERK-KTR ES cells were cultured in ES medium with MEKi (2 μM PD0325901) imaged every 5 minutes for 800 minutes. ERK-KTR-mClover intensity is shown. Note increased frequency of ERK low divisions compared to Movie S6.
Movie S8. Video of NANOG-Venus burst after mitosis. Related to Figure 5. NV2C ES cell undergoing mitosis in ES culture medium imaged every 5 minutes for 350 minutes. NANOG-Venus and mCherry intensities are shown in cyan and red, respectively. NANOG-Venus intensity increases at mitotic exit.
KEY RESOURCES TABLE
| REAGENT or RESOURCE | SOURCE | IDENTIFIER |
|---|---|---|
| Antibodies | ||
| Rabbit monoclonal anti-NANOG | Cell Signaling Technology | Cat# 8822; RRID:AB_11217637 |
| Goat polyclonal anti-GATA6 | R&D Systems | Cat# AF1700; RRID:AB_2108901 |
| Mouse monoclonal anti-CDX2 | BioGenex | Cat# MU392; RRID:AB_2335627 |
| Donkey anti-rabbit IgG (Alexa Fluor 405) | Abcam | Cat# ab175649; RRID:AB_2715515 |
| Donkey anti-mouse IgG (Alexa Fluor 488) | Molecular Probes | Cat# A21202; RRID:AB_141607 |
| Donkey anti-Goat IgG (Alexa Fluor 647) | Molecular Probes | Cat# A21447; RRID:AB_141844 |
| Chemicals/Peptides/Recombinant Proteins | ||
| CHIR99021 | Sigma-Aldrich | Cat# SML1046 |
| PD0325901 | Selleckchem | Cat# S1036 |
| Ulixertinib | Selleckchem | Cat# S7854 |
| AZD4547 | Selleckchem | Cat# S2801 |
| proTAME | R&D Systems | Cat# I-440–01M |
| Y-27632 | Selleckchem | Cat# S1048 |
| LDN-193189 | Selleckchem | Cat# S2618 |
| Retinoic Acid | Sigma-Aldrich | Cat# R2625 |
| MG132 | Selleckchem | Cat# S2619 |
| Cycloheximide | Sigma-Aldrich | Cat# C4859 |
| Mitomycin C | Sigma-Aldrich | Cat# M4287 |
| ESGRO | Milipore Sigma | Cat# ESG1106 |
| rhFGF4 | Thermo Fisher Scientific | Cat# PHG0154 |
| EGF | PeproTech | Cat# AF-100–15 |
| FGFb | Sigma-Aldrich | Cat# GF003 |
| Activin A | R&D Systems | Cat# 338-AC-010 |
| Heparin | Sigma-Aldrich | Cat# H3149 |
| N-acetyl-L-cysteine | Sigma-Aldrich | Cat# A7250 |
| Mouse R-Spondin-1 | Thermo Fisher Scientific | Cat# 3474RS050 |
| Matrigel Matrix Growth Factor Reduced | Corning | Cat# 354230 |
| 5 ethynyl 2 deoxyuridine (EdU) | Thermo Fisher Scientific | Cat# A10044 |
| Human Plasma Fibronectin | Milipore Sigma | Cat# FC010 |
| EmbryoMax Gelatin | Milipore Sigma | Cat# ES-006-B |
| 2-Mercaptoethanol | Thermo Fisher Scientific | Cat# 21985023 |
| Dithiothreitol | Thermo Fisher Scientific | Cat# R0861 |
| GlutaMAX | Thermo Fisher Scientific | Cat# 35050061 |
| Critical Commercial Assay | ||
| Nanobind Tissue Big DNA Kit | Circulomics | Cat# NB-900-701-01 |
| Short Read Eliminator | Circulomics | Cat# SS-100-101-01 |
| Oxford Nanopore Sequencing 1D | Nanoporetech | Cat# SQK-LSK109 |
| Experimental Models: organisms/strains | ||
| Mouse: ERK-KTR-LSL | This Paper | JAX#035566 |
| Mouse: ERK-KTR-LoxP | This Paper | N/A |
| Oligonucleotides | ||
| R Chkactin: 5’-GGGGGAGATGGGGAGAGTGAAGCAGAA-3’ | This paper | N/A |
| F CMV: 5’-GGGTGGAGTATTTACGGTAAACTGCCC-3’ | This paper | N/A |
| oMP106 5’-CTCCAGCATGACTAGAGTCAGGCTCTGG-3’ | This paper | N/A |
| oMP109 5’-CATTAATGGTTTCAGGTGGATGTCTCCTCCC-3’ | This paper | N/A |
| oMP115 5’-GGGTAGATGAGGGATTAGTTGAAATTCACTCATGAGG-3’ | This paper | N/A |
| Recombinant DNA | ||
| pSpCas9(NANOG)-2A-GFP | This Paper | N/A |
| pSpCas9(BB)-2A-GFP | Ran et al. Nat Prot. 2013 | Addgene Repository #48138 |
| Nanog-2a-mCherry | Faddah et al. Cell Stem Cell 2013 | Addgene Repository #59995 |
| pMP108 Nanog-Venus-2a-mCherry | This Paper | N/A |
| pOO16 Step2 Rosa26 Vector ERK | This Paper | N/A |
| Software and Algorithms | ||
| MATLAB | mathworks | www.mathworks.com |
| Samtools | Li et al. Bioinformatics 2009 | www.htslib.org/download |
| Deposited Data | ||
| Integrated time-lapse and end-point datasets of ERK KTR Embryos | This Paper | https://idr.openmicroscopy.org/ |
HIGHLIGHTS.
Kinase Translocation Reporters enable in vivo measurement of ERK signaling dynamics
ERK activity bifurcates at mitotic exit in ICM blastomeres to specify EPI vs. PrE
Embryonic stem cells in culture recapitulate ERK bifurcation at mitotic exit
Low ERK activity during G1 promotes rapid posttranslational stabilization of NANOG
ACKNOWLEDGEMENTS
We thank all members of the Regot lab for helpful discussions and technical advice. We thank the Holland and Nathans lab for technical expertise and training in the handling of mice and collection of mouse embryos and the Hadjantonakis lab for training in the manipulation and culture of mouse blastocysts. We thank the Transgenic Animal Core Facility at JHSOM for performing pronuclear injection of mouse embryos and the Integrated Physiology Core at JHSOM for training and assistance in the culture of primary mouse enteroids. We acknowledge our funding sources: NIH T32 pre-doctoral training grants to M.P. and B.P., NSF Graduate Research Fellowships to M.P. (DGE-1746891). An NSF CAREER award (MCB-1844994), NIGMS R35 (1R35GM133499), American Cancer Society Research Scholar Grant (133537-RSG-19-005-01-CCG), and Jerome L. Greene Foundation Discovery Award to S.R.
Footnotes
Publisher's Disclaimer: This is a PDF file of an unedited manuscript that has been accepted for publication. As a service to our customers we are providing this early version of the manuscript. The manuscript will undergo copyediting, typesetting, and review of the resulting proof before it is published in its final form. Please note that during the production process errors may be discovered which could affect the content, and all legal disclaimers that apply to the journal pertain.
The authors declare no competing interests.
REFERENCES
- Azami T, Bassalert C, Allegre N, Valverde Estrella L, Pouchin P, Ema M, and Chazaud C (2019). Regulation of the ERK signalling pathway in the developing mouse blastocyst. Development 146. [DOI] [PubMed] [Google Scholar]
- Behringer R (2014). Manipulating the mouse embryo : a laboratory manual (Cold Spring Harbor, New York: Cold Spring Harbor Laboratory Press; ) [Google Scholar]
- Bessonnard S, Coqueran S, Vandormael-Pournin S, Dufour A, Artus J, and Cohen-Tannoudji M (2017). ICM conversion to epiblast by FGF/ERK inhibition is limited in time and requires transcription and protein degradation. Sci Rep 7, 12285. [DOI] [PMC free article] [PubMed] [Google Scholar]
- Bessonnard S, De Mot L, Gonze D, Barriol M, Dennis C, Goldbeter A, Dupont G, and Chazaud C (2014). Gata6, Nanog and Erk signaling control cell fate in the inner cell mass through a tristable regulatory network. Development 141, 3637–48. [DOI] [PubMed] [Google Scholar]
- Boroviak T, Loos R, Lombard P, Okahara J, Behr R, Sasaki E, Nichols J, Smith A, and Bertone P (2015). Lineage-Specific Profiling Delineates the Emergence and Progression of Naive Pluripotency in Mammalian Embryogenesis. Developmental cell 35, 366–82. [DOI] [PMC free article] [PubMed] [Google Scholar]
- Boyer LA, Lee TI, Cole MF, Johnstone SE, Levine SS, Zucker JP, Guenther MG, Kumar RM, Murray HL, Jenner RG, et al. (2005). Core transcriptional regulatory circuitry in human embryonic stem cells. Cell 122, 947–56. [DOI] [PMC free article] [PubMed] [Google Scholar]
- Chazaud C, and Yamanaka Y (2016). Lineage specification in the mouse preimplantation embryo. Development 143, 1063–74. [DOI] [PubMed] [Google Scholar]
- Chazaud C, Yamanaka Y, Pawson T, and Rossant J (2006). Early lineage segregation between epiblast and primitive endoderm in mouse blastocysts through the Grb2-MAPK pathway. Developmental cell 10, 615–24. [DOI] [PubMed] [Google Scholar]
- Faddah DA, Wang H, Cheng AW, Katz Y, Buganim Y, and Jaenisch R (2013). Single-cell analysis reveals that expression of nanog is biallelic and equally variable as that of other pluripotency factors in mouse ESCs. Cell Stem Cell 13, 23–9. [DOI] [PMC free article] [PubMed] [Google Scholar]
- Fernandez-de-Manuel L, Diaz-Diaz C, Jimenez-Carretero D, Torres M, and Montoya MC (2017). ESC-Track: A computer workflow for 4-D segmentation, tracking, lineage tracing and dynamic context analysis of ESCs. Biotechniques 62, 215–222. [DOI] [PubMed] [Google Scholar]
- Frum T, Murphy TM, and Ralston A (2018). HIPPO signaling resolves embryonic cell fate conflicts during establishment of pluripotency in vivo. Elife 7. [DOI] [PMC free article] [PubMed] [Google Scholar]
- Gaudet S, and Miller-Jensen K (2016). Redefining Signaling Pathways with an Expanding Single-Cell Toolbox. Trends in biotechnology 34, 458–469. [DOI] [PMC free article] [PubMed] [Google Scholar]
- Germann UA, Furey BF, Markland W, Hoover RR, Aronov AM, Roix JJ, Hale M, Boucher DM, Sorrell DA, Martinez-Botella G, et al. (2017). Targeting the MAPK Signaling Pathway in Cancer: Promising Preclinical Activity with the Novel Selective ERK1/2 Inhibitor BVD-523 (Ulixertinib). Mol Cancer Ther 16, 2351–2363. [DOI] [PubMed] [Google Scholar]
- Gilpatrick T, Lee I, Graham JE, Raimondeau E, Bowen R, Heron A, Sedlazeck FJ, and Timp W (2019). Targeted Nanopore Sequencing with Cas9 for studies of methylation, structural variants, and mutations. bioRxiv, 604173. [Google Scholar]
- Gu B, Posfai E, and Rossant J (2018). Efficient generation of targeted large insertions by microinjection into two-cell-stage mouse embryos. Nature biotechnology 36, 632–637. [DOI] [PubMed] [Google Scholar]
- Guo G, Huss M, Tong GQ, Wang C, Li Sun L, Clarke ND, and Robson P (2010). Resolution of cell fate decisions revealed by single-cell gene expression analysis from zygote to blastocyst. Developmental cell 18, 675–85. [DOI] [PubMed] [Google Scholar]
- Hafner A, Stewart-Ornstein J, Purvis JE, Forrester WC, Bulyk ML, and Lahav G (2017). p53 pulses lead to distinct patterns of gene expression albeit similar DNA-binding dynamics. Nat Struct Mol Biol 24, 840–847. [DOI] [PMC free article] [PubMed] [Google Scholar]
- Hayashi S, Tenzen T, and McMahon AP (2003). Maternal inheritance of Cre activity in a Sox2Cre deleter strain. Genesis 37, 51–3. [DOI] [PubMed] [Google Scholar]
- Hino N, Rossetti L, Marin-Llaurado A, Aoki K, Trepat X, Matsuda M, and Hirashima T (2020). ERK-Mediated Mechanochemical Waves Direct Collective Cell Polarization. Developmental cell 53, 646–660 e8. [DOI] [PubMed] [Google Scholar]
- Hirate Y, Hirahara S, Inoue K, Suzuki A, Alarcon VB, Akimoto K, Hirai T, Hara T, Adachi M, Chida K, et al. (2013). Polarity-dependent distribution of angiomotin localizes Hippo signaling in preimplantation embryos. Current biology : CB 23, 1181–94. [DOI] [PMC free article] [PubMed] [Google Scholar]
- Hiratsuka T, Fujita Y, Naoki H, Aoki K, Kamioka Y, and Matsuda M (2015). Intercellular propagation of extracellular signal-regulated kinase activation revealed by in vivo imaging of mouse skin. Elife 4, e05178. [DOI] [PMC free article] [PubMed] [Google Scholar]
- Hung YP, and Yellen G (2014). Live-cell imaging of cytosolic NADH-NAD+ redox state using a genetically encoded fluorescent biosensor. Methods Mol Biol 1071, 83–95. [DOI] [PMC free article] [PubMed] [Google Scholar]
- Jin J, Liu J, Chen C, Liu Z, Jiang C, Chu H, Pan W, Wang X, Zhang L, Li B, et al. (2016). The deubiquitinase USP21 maintains the stemness of mouse embryonic stem cells via stabilization of Nanog. Nature communications 7, 13594. [DOI] [PMC free article] [PubMed] [Google Scholar]
- Johnson HE, and Toettcher JE (2019). Signaling Dynamics Control Cell Fate in the Early Drosophila Embryo. Developmental cell 48, 361–370 e3. [DOI] [PMC free article] [PubMed] [Google Scholar]
- Kang M, Garg V, and Hadjantonakis AK (2017). Lineage Establishment and Progression within the Inner Cell Mass of the Mouse Blastocyst Requires FGFR1 and FGFR2. Developmental cell 41, 496–510 e5. [DOI] [PMC free article] [PubMed] [Google Scholar]
- Kang M, Piliszek A, Artus J, and Hadjantonakis AK (2013). FGF4 is required for lineage restriction and salt-and-pepper distribution of primitive endoderm factors but not their initial expression in the mouse. Development 140, 267–79. [DOI] [PMC free article] [PubMed] [Google Scholar]
- Kim SH, Kim MO, Cho YY, Yao K, Kim DJ, Jeong CH, Yu DH, Bae KB, Cho EJ, Jung SK, et al. (2014). ERK1 phosphorylates Nanog to regulate protein stability and stem cell self-renewal. Stem Cell Res 13, 1–11. [DOI] [PubMed] [Google Scholar]
- Kimata Y (2019). APC/C Ubiquitin Ligase: Coupling Cellular Differentiation to G1/G0 Phase in Multicellular Systems. Trends Cell Biol 29, 591–603. [DOI] [PubMed] [Google Scholar]
- Komatsu N, Aoki K, Yamada M, Yukinaga H, Fujita Y, Kamioka Y, and Matsuda M (2011). Development of an optimized backbone of FRET biosensors for kinases and GTPases. Molecular biology of the cell 22, 4647–56. [DOI] [PMC free article] [PubMed] [Google Scholar]
- Krawchuk D, Honma-Yamanaka N, Anani S, and Yamanaka Y (2013). FGF4 is a limiting factor controlling the proportions of primitive endoderm and epiblast in the ICM of the mouse blastocyst. Dev Biol 384, 65–71. [DOI] [PubMed] [Google Scholar]
- Lane K, Van Valen D, DeFelice MM, Macklin DN, Kudo T, Jaimovich A, Carr A, Meyer T, Pe’er D, Boutet SC, et al. (2017). Measuring Signaling and RNA-Seq in the Same Cell Links Gene Expression to Dynamic Patterns of NF-kappaB Activation. Cell Syst 4, 458–469 e5. [DOI] [PMC free article] [PubMed] [Google Scholar]
- Li H, Handsaker B, Wysoker A, Fennell T, Ruan J, Homer N, Marth G, Abecasis G, Durbin R, and Genome Project Data Processing, S. (2009). The Sequence Alignment/Map format and SAMtools. Bioinformatics 25, 2078–9. [DOI] [PMC free article] [PubMed] [Google Scholar]
- Lobas MA, Tao R, Nagai J, Kronschlager MT, Borden PM, Marvin JS, Looger LL, and Khakh BS (2019). A genetically encoded single-wavelength sensor for imaging cytosolic and cell surface ATP. Nature communications 10, 711. [DOI] [PMC free article] [PubMed] [Google Scholar]
- Lou X, Kang M, Xenopoulos P, Munoz-Descalzo S, and Hadjantonakis AK (2014). A rapid and efficient 2D/3D nuclear segmentation method for analysis of early mouse embryo and stem cell image data. Stem Cell Reports 2, 382–97. [DOI] [PMC free article] [PubMed] [Google Scholar]
- Ma X, Chen H, and Chen L (2016). A dual role of Erk signaling in embryonic stem cells. Exp Hematol 44, 151–6. [DOI] [PubMed] [Google Scholar]
- Meng Y, Moore R, Tao W, Smith ER, Tse JD, Caslini C, and Xu XX (2018). GATA6 phosphorylation by Erk1/2 propels exit from pluripotency and commitment to primitive endoderm. Dev Biol 436, 55–65. [DOI] [PMC free article] [PubMed] [Google Scholar]
- Molotkov A, Mazot P, Brewer JR, Cinalli RM, and Soriano P (2017). Distinct Requirements for FGFR1 and FGFR2 in Primitive Endoderm Development and Exit from Pluripotency. Developmental cell 41, 511–526 e4. [DOI] [PMC free article] [PubMed] [Google Scholar]
- Muta Y, Fujita Y, Sumiyama K, Sakurai A, Taketo MM, Chiba T, Seno H, Aoki K, Matsuda M, and Imajo M (2018). Composite regulation of ERK activity dynamics underlying tumour-specific traits in the intestine. Nature communications 9, 2174. [DOI] [PMC free article] [PubMed] [Google Scholar]
- Niakan KK, Schrode N, Cho LT, and Hadjantonakis AK (2013). Derivation of extraembryonic endoderm stem (XEN) cells from mouse embryos and embryonic stem cells. Nat Protoc 8, 1028–41. [DOI] [PMC free article] [PubMed] [Google Scholar]
- Nichols J, and Smith A (2012). Pluripotency in the embryo and in culture. Cold Spring Harb Perspect Biol 4, a008128. [DOI] [PMC free article] [PubMed] [Google Scholar]
- Nishioka N, Inoue K, Adachi K, Kiyonari H, Ota M, Ralston A, Yabuta N, Hirahara S, Stephenson RO, Ogonuki N, et al. (2009). The Hippo signaling pathway components Lats and Yap pattern Tead4 activity to distinguish mouse trophectoderm from inner cell mass. Developmental cell 16, 398–410. [DOI] [PubMed] [Google Scholar]
- Ochiai H, Sugawara T, Sakuma T, and Yamamoto T (2014). Stochastic promoter activation affects Nanog expression variability in mouse embryonic stem cells. Sci Rep 4, 7125. [DOI] [PMC free article] [PubMed] [Google Scholar]
- Ohnishi Y, Huber W, Tsumura A, Kang M, Xenopoulos P, Kurimoto K, Oles AK, Arauzo-Bravo MJ, Saitou M, Hadjantonakis AK, et al. (2014). Cell-to-cell expression variability followed by signal reinforcement progressively segregates early mouse lineages. Nature cell biology 16, 27–37. [DOI] [PMC free article] [PubMed] [Google Scholar]
- Pauklin S, and Vallier L (2013). The cell-cycle state of stem cells determines cell fate propensity. Cell 155, 135–47. [DOI] [PMC free article] [PubMed] [Google Scholar]
- Pineda CM, Park S, Mesa KR, Wolfel M, Gonzalez DG, Haberman AM, Rompolas P, and Greco V (2015). Intravital imaging of hair follicle regeneration in the mouse. Nat Protoc 10, 1116–30. [DOI] [PMC free article] [PubMed] [Google Scholar]
- Ran FA, Hsu PD, Wright J, Agarwala V, Scott DA, and Zhang F (2013). Genome engineering using the CRISPR-Cas9 system. Nat Protoc 8, 2281–2308. [DOI] [PMC free article] [PubMed] [Google Scholar]
- Regot S, Hughey JJ, Bajar BT, Carrasco S, and Covert MW (2014). High-sensitivity measurements of multiple kinase activities in live single cells. Cell 157, 1724–34. [DOI] [PMC free article] [PubMed] [Google Scholar]
- Saiz N, Williams KM, Seshan VE, and Hadjantonakis AK (2016). Asynchronous fate decisions by single cells collectively ensure consistent lineage composition in the mouse blastocyst. Nature communications 7, 13463. [DOI] [PMC free article] [PubMed] [Google Scholar]
- Sakaue-Sawano A, and Miyawaki A (2014). Visualizing spatiotemporal dynamics of multicellular cell-cycle progressions with fucci technology. Cold Spring Harb Protoc 2014. [DOI] [PubMed] [Google Scholar]
- Schrode N, Xenopoulos P, Piliszek A, Frankenberg S, Plusa B, and Hadjantonakis AK (2013). Anatomy of a blastocyst: cell behaviors driving cell fate choice and morphogenesis in the early mouse embryo. Genesis 51, 219–33. [DOI] [PMC free article] [PubMed] [Google Scholar]
- Schroter C, Rue P, Mackenzie JP, and Martinez Arias A (2015). FGF/MAPK signaling sets the switching threshold of a bistable circuit controlling cell fate decisions in embryonic stem cells. Development 142, 4205–16. [DOI] [PMC free article] [PubMed] [Google Scholar]
- Simon CS, Hadjantonakis AK, and Schroter C (2018). Making lineage decisions with biological noise: Lessons from the early mouse embryo. Wiley Interdiscip Rev Dev Biol 7, e319. [DOI] [PMC free article] [PubMed] [Google Scholar]
- Singh AM, Hamazaki T, Hankowski KE, and Terada N (2007). A heterogeneous expression pattern for Nanog in embryonic stem cells. Stem Cells 25, 2534–42. [DOI] [PubMed] [Google Scholar]
- Singh AM, Sun Y, Li L, Zhang W, Wu T, Zhao S, Qin Z, and Dalton S (2015). Cell-Cycle Control of Bivalent Epigenetic Domains Regulates the Exit from Pluripotency. Stem Cell Reports 5, 323–36. [DOI] [PMC free article] [PubMed] [Google Scholar]
- Thorne CA, Chen IW, Sanman LE, Cobb MH, Wu LF, and Altschuler SJ (2018). Enteroid Monolayers Reveal an Autonomous WNT and BMP Circuit Controlling Intestinal Epithelial Growth and Organization. Developmental cell 44, 624–633 e4. [DOI] [PMC free article] [PubMed] [Google Scholar]
- Wan L, Chen M, Cao J, Dai X, Yin Q, Zhang J, Song SJ, Lu Y, Liu J, Inuzuka H, et al. (2017). The APC/C E3 Ligase Complex Activator FZR1 Restricts BRAF Oncogenic Function. Cancer Discov 7, 424–441. [DOI] [PMC free article] [PubMed] [Google Scholar]
- Wicklow E, Blij S, Frum T, Hirate Y, Lang RA, Sasaki H, and Ralston A (2014). HIPPO pathway members restrict SOX2 to the inner cell mass where it promotes ICM fates in the mouse blastocyst. PLoS genetics 10, e1004618. [DOI] [PMC free article] [PubMed] [Google Scholar]
- Wilson MZ, Ravindran PT, Lim WA, and Toettcher JE (2017). Tracing Information Flow from Erk to Target Gene Induction Reveals Mechanisms of Dynamic and Combinatorial Control. Molecular cell 67, 757–769 e5. [DOI] [PMC free article] [PubMed] [Google Scholar]
- Xu J (2005). Preparation, culture, and immortalization of mouse embryonic fibroblasts Current protocols in molecular biology / edited by Ausubel Frederick M. … [et al. ] Chapter 28, Unit 28 1. [DOI] [PubMed] [Google Scholar]
- Yamanaka Y, Lanner F, and Rossant J (2010). FGF signal-dependent segregation of primitive endoderm and epiblast in the mouse blastocyst. Development 137, 715–24. [DOI] [PubMed] [Google Scholar]
- Zeng X, Sigoillot F, Gaur S, Choi S, Pfaff KL, Oh DC, Hathaway N, Dimova N, Cuny GD, and King RW (2010). Pharmacologic inhibition of the anaphase-promoting complex induces a spindle checkpoint-dependent mitotic arrest in the absence of spindle damage. Cancer cell 18, 382–95. [DOI] [PMC free article] [PubMed] [Google Scholar]
- Zhang JP, Li XL, Li GH, Chen W, Arakaki C, Botimer GD, Baylink D, Zhang L, Wen W, Fu YW, et al. (2017). Efficient precise knockin with a double cut HDR donor after CRISPR/Cas9-mediated double-stranded DNA cleavage. Genome Biol 18, 35. [DOI] [PMC free article] [PubMed] [Google Scholar]
Associated Data
This section collects any data citations, data availability statements, or supplementary materials included in this article.
Supplementary Materials
Movie S1. Video of live ERK-KTRLoxP E3.5 blastocyst. Related to Figure 2. H2B-mCherry (left) and ERK-KTR-mClover (right) were recorded over 12 hour time course with 15 minute imaging interval. ERK activity is high in all cells, except brief inactivity in some cells after mitosis.
Movie S2. Video focusing on ERK low division observed during blastocyst time lapse imaging. Related to Figure 2. H2B-mCherry (left) and ERK-KTR-mClover (right) are shown before and after mitosis for total duration of 315 minutes.
Movie S3. Video focusing on ERK high division observed during blastocyst time lapse imaging. Related to Figure 2. H2B-mCherry (left) and ERK-KTR-mClover (right) are shown before and after mitosis for total duration of 245 minutes.
Movie S4. Video demonstration of connecting ERK signaling dynamics and lineage marker analysis. Related to Figure 3. Embryo was collected at E3.5, imaged as described in methods, then fixed, immunostained and re-imaged. Video shows agreement between H2B-mCherry signal after in silico alignment of images.
Movie S5. Video of ERK-KTR ES cells undergoing mitosis in presence of ERKi. Related to Figure 4. ERK-KTR ES cells were incubated with ERKi (5 μM Ulixertinib) and imaged every 5 minutes. H2B-mCherry (left) and ERK-KTR-mClover (right) are shown for 160 minutes. Note persistent nuclear localization of ERK-KTR in all but one frames before mitosis.
Movie S6. Video of ERK activity bifurcation after mitosis in ERK-KTR ES cells. Related to Figure 4. ERK-KTR ES cells were cultured in ES medium and imaged every 5 minutes for 800 minutes. ERK-KTR-mClover intensity is shown. ERK high and ERK low divisions are observed.
Movie S7. Video of ERK activity bifurcation after mitosis in MEKi-treated ERK-KTR ES cells. Related to Figure 4. ERK-KTR ES cells were cultured in ES medium with MEKi (2 μM PD0325901) imaged every 5 minutes for 800 minutes. ERK-KTR-mClover intensity is shown. Note increased frequency of ERK low divisions compared to Movie S6.
Movie S8. Video of NANOG-Venus burst after mitosis. Related to Figure 5. NV2C ES cell undergoing mitosis in ES culture medium imaged every 5 minutes for 350 minutes. NANOG-Venus and mCherry intensities are shown in cyan and red, respectively. NANOG-Venus intensity increases at mitotic exit.
Data Availability Statement
Live imaging of embryo and corresponding fixed embryo data sets is available at Biostudies (https://www.ebi.ac.uk/biostudies/). MATLAB code generated to assign ICM versus TE cell identity on basis of cell position is available from: https://github.com/MichaelPokrass/EmbryoScripts.