Abstract
Deep learning has the potential to enhance the output of in‐line, on‐line, and at‐line instrumentation used for process analytical technology in the pharmaceutical industry. Here, we used Raman spectroscopy‐based deep learning strategies to develop a tool for detecting microbial contamination. We built a Raman dataset for microorganisms that are common contaminants in the pharmaceutical industry for Chinese Hamster Ovary (CHO) cells, which are often used in the production of biologics. Using a convolution neural network (CNN), we classified the different samples comprising individual microbes and microbes mixed with CHO cells with an accuracy of 95%–100%. The set of 12 microbes spans across Gram‐positive and Gram‐negative bacteria as well as fungi. We also created an attention map for different microbes and CHO cells to highlight which segments of the Raman spectra contribute the most to help discriminate between different species. This dataset and algorithm provide a route for implementing Raman spectroscopy for detecting microbial contamination in the pharmaceutical industry.
Keywords: biologics, CHO cells, convolution neural network, deep learning, microbial contamination, process analytical technology
We use Raman spectroscopy to identify microbial contaminants that are common in the pharmaceutical industry. These contaminants span across Gram‐negative bacteria, Gram‐positive bacteria, and fungi. The use of a convolution neural network achieves identification accuracy in the range of 95%–100%.

1. INTRODUCTION
Real‐time release of pharmaceuticals (small molecules and biologics) requires the ability to use in‐process data to evaluate and ensure the quality of the final product (Shintani, 2016). Within biologics, determining sterility and measuring microbial contamination are especially important (Jiang et al., 2017). Traditional United States Pharmacopeia microbial testing methods depend primarily on the culturing of microorganisms to determine bioburden and sterility (England et al., 2019; Shintani, 2016). Since culturing and culture‐dependent methods are slow (1–21 days), they cannot be used for real‐time release testing. Nucleic acid‐based technologies (polymerase chain reaction, next‐generation sequencing) have reduced the time for analysis to the order of hours but they still require sample preparation and thus, remain invasive methods of detection. Spectroscopic methods, such as Raman spectroscopy, on the other hand, are non‐invasive, rapid (minutes), and versatile (can detect a variety of microorganisms) (Maruthamuthu et al., 2020).
Although incidents of microbial contamination are rare, they can be extremely costly. For example, bioreactors can be operated at scales of about 15,000‐L scale with media costs of $8/L, and thus, single contamination could lead to a loss of around $120,000 (Kelley, 2009; Shintani, 2016). Thus, detecting contamination promptly and monitoring critical control points are essential for real‐time release. Recently, a proof‐of‐concept rapid microbiological screening system was able to detect Escherichia coli spiked into Chinese Hamster Ovary (CHO) cell line culture within three hours by using filtration (to separate CHO cells), microfluidics (to generate nanoliter‐sized droplets), and an indicator dye (to measure the doubling time of bacteria) (Surrette et al., 2018). Since the method requires filtration and growth of bacteria, it is still limited to at‐line or off‐line use.
Raman spectroscopy measures the inelastic scattering of light due to molecular vibrations. It is possible to distinguish phenotypes of microorganisms based on their molecular composition (Ho et al., 2019). Since the differences in the Raman spectra of different microbes can be subtle, the use of deep learning algorithms helps distinguish these differences. A recent demonstration of this approach on human pathogens achieved an accuracy of about 82% for distinguishing isolates of microbes (Ho et al., 2019).
In the current work, we apply Raman spectroscopy and deep learning to pharmaceutical contaminants and demonstrate detection and discrimination of 12 different microorganisms (encompassing Gram‐positive bacteria, Gram‐negative bacteria, and fungi listed in Table 1). We have used a TeflonTM‐coated polished stainless‐steel substrate (Figure 1) to obtain high signal‐to‐noise ratios. We also demonstrate discrimination of microbial contamination in a mixture with CHO cells. We achieve accuracies in the range of 95%–100% for determining microbial identity (Figure 2).
Table 1.
List of microbes/cells used in this study.
| No | Name | Source | Growth media | Growth condition | Reference |
|---|---|---|---|---|---|
| 1. | Aspergillus brasiliensis | ATCC 16404 | Potato dextrose broth | Aerobic, 25°C | FDA (2015) |
| 2. | Bacillus cereus | ATCC 10876 | Nutrient broth | Aerobic, 30°C | Deal et al. (2016) |
| 3. | Bacillus subtilis | ATCC 6633 | Brain heart infusion broth | Aerobic, 37°C | FDA (2015) |
| 4. | Candida albicans | ATCC 10231 | Yeast extract peptone dextrose (YPD media) | Aerobic, 25°C | FDA (2015) |
| 5. | Clostridium sporogenes | ATCC 19404 | Trypticase Soy Broth with defibrinated sheep blood | Anaerobic, 37°C | FDA (2015) |
| 6. | Escherichia coli | ATCC 8739 | Nutrient broth | Aerobic, 37°C | FDA (2015) |
| 7. | Micrococcus luteus | ATCC 10240 | Trypticase Soy Broth | Aerobic, 30°C | Pacheco & Pinto (2010) |
| 8. | Propionibacterium acnes | ATCC 29399 | Tryptone Yeast glucose media (TYG) | Anaerobic, 37°C | Salaman‐Byron (2019) |
| 9. | Pseudomonas aeruginosa | ATCC 9027 | Trypticase Soy Broth | Aerobic, 37°C | FDA (2015) |
| 10. | Salmonella enterica | ATCC 14028 | Trypticase Soy Broth | Aerobic, 37°C | FDA (2015) |
| 11. | Staphylococcus aureus | ATCC 6538 | Trypticase Soy Broth | Aerobic, 37°C | FDA (2015) |
| 12. | Staphylococcus epidermis | ATCC 35984 | Trypticase Soy Broth | Aerobic, 37°C | Cobo and Concha (2007) |
| 13. | CHO cells | ATCC CCL−61 | F−12 K medium with 10% Fetal bovine serum (FBS) | Aerobic, 37°C |
Figure 1.
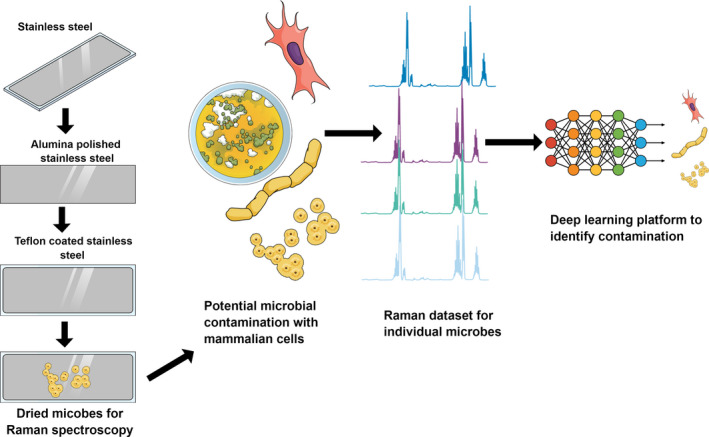
Schematic of a workflow to identify contamination using deep learning strategy.
Figure 2.
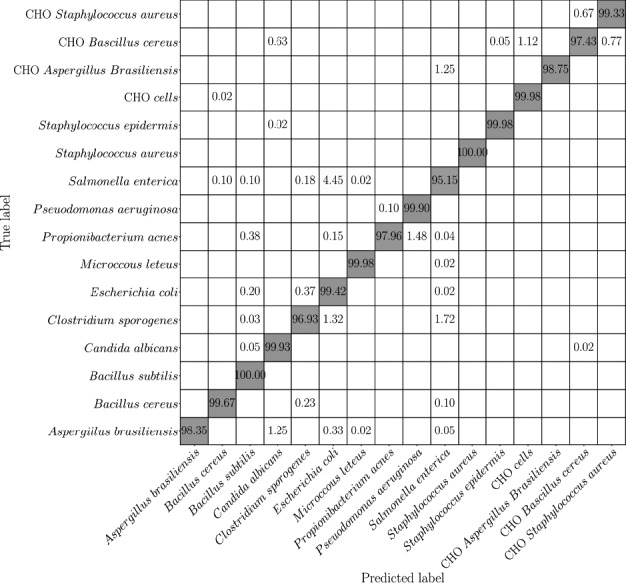
Confusion matrix from the developed neural network for the classification of microbes using the Raman dataset. The gray background indicates the expected true positive results.
2. MATERIALS AND METHODS
Microorganisms and growth conditions: The list of microbes contaminating the pharmaceutical industry was identified from the FDA’s manual of pharmaceutical microbiology, and we also included a few environmental microbial sources found in the pharmaceutical industry (Cobo & Concha, 2007; Deal et al., 2016; 2015; Pacheco & Pinto, 2010; Salaman‐Byron, 2019) The list of microbes/cells used in the study and media used for culturing these strains are listed in Table 1.
Raman substrate fabrication and sample preparation: The substrates (21 mm × 21 mm) were made from polished stainless steel with alumina and were coated with a thin layer (50 nm) of Teflon using spin coater as described previously (Zhang et al., 2003) (Figure 1). The surface characterization of the substrates were performed with the Hitachi S‐4800 field emission scanning electron microscope (SEM). The microbes were cultured overnight to obtain 108 cells/ml (as measured by optical density at 600 nm of 0.1 for bacteria, and 0.6 for fungi). The overnight grown cultures were fixed with 2.5% of glutaraldehyde and washed with water to remove the debris and diluted to a concentration of 105 cells/ml for Raman dataset development. The CHO cells were cultured up to 80% confluent in T75 cell culture flask, and the cells were trypsinized and processed for Raman spectroscopy as mentioned by Rangan et al. (2018). 105 cells/ml of CHO cells were measured using the Invitrogen Countess™ Automated Cell Counter. The prepared cells/microbes were placed in the substrate using a micropipette (5 µl) on the substrate and dried for 5 min. Once dry, the sample forms a circular spot on the substrate with a diameter of about 2 mm. The dried cells on the substrate are used to collect the Raman spectra for individual species of microbes/cells. Raman measurements were performed with a customized, micro‐Raman system with an argon‐ion laser (532 nm, 20 mW power at the sample) with thermoelectrically cooled charge‐coupled device detector (1,340 pixels × 4,000 pixels) mounted on a 300‐mm focal length imaging with a working distance of 20 mm as described previously (Davis et al., 2012). The spectra were collected on three different days (biological replicates) and 10 different points (technical replicates) on the 2‐mm spot. At each point, 200 scans were obtained; a total of 2,000 scans were obtained for each microbe/cell every day (10 points × 200 scans/point = 2,000 scans). These 6000 spectra were used for the deep learning‐based analyses. The Raman spectra signal‐to‐noise ratio was 1,000:1, and there is almost no interference of the background (Figure A1).
Deep learning‐based classification between the potential microbial contaminants: The architecture for deep learning is composed of the following three layers: (a) initial convolution layer, (b) eight residual blocks, and (c) fully connected layer (Deep Residual Learning for Image Recognition, 2016). The convolution layer is composed of a kernel size of 7 and stride of 2. All the residual blocks consist of kernels with a size of 3 and strides of 1 and 2 (Deep Residual Learning for Image Recognition, 2016). The convolution layer proceeds with the batch normalization layer (Ioffe & Szegedy, 2015), and ReLU (Rectified Linear Unit) is used as a non‐linear function. The residual blocks contain a shortcut connection between input and output, which enhances the training stability and addresses the problem of degradation in the deep neural network (Deep Residual Learning for Image Recognition, 2016).
The output of the model is a 1‐d (Rd,R ∈ [0, 1]) vector containing the probability distribution over all the classes of microbes/cells. To train the model, we used Adam optimizer with betas = (0.9, 0.999), and the learning rate is set to 0.001. The factor of 0.1 decays the learning rate if the accuracy on the validation set reaches a plateau during training (Kingma & Ba, 2017). To train the model, we use 5‐fold leave‐one‐out cross‐validation (LOOCV) method to split the collected dataset into training and validation sets. In this method, the reference dataset is randomly split into five groups, and in each round of training, one group is held out to be used as the validation set and the remaining data are used as the training set. This process is repeated five times to ensure that all the samples fall into the validation set once. The performance of the model was evaluated on the individual class scale to form a confusion matrix. Furthermore, using Grad‐CAM++, 2018, we developed a saliency map for each sample that shows the attention map of each microbe/cell with the Raman spectra. With this feature, we can explain how the deep learning model chooses a class for an arbitrary input by providing the corresponding attention map.
3. RESULTS AND DISCUSSION
We used the convolution neural network (CNN) as a deep learning strategy to classify the microbial contaminants (and CHO cells) relevant to the pharmaceutical industry. The CNN consists of multiple hidden convolutional layers. In each layer, a certain number of filters convolve over the input map and abstract it into the feature map, which is passed to the next layer. Each layer extracts a pattern (which is determined during the optimization process) in the input data and passes the resulting feature maps to the next layer to search for higher‐level patterns. The final output is passed into a fully connected layer that converts the extracted feature maps into the probability distribution over various classes (Krizhevsky et al., 2012). In our study, the input layer is Raman spectroscopy data obtained from different samples, and the output is the probability distribution over the 16 classes of samples (12 microbes, 1 CHO cell, 3 mixtures of CHO cells and microbes to represent Gram‐positive bacteria, Gram‐negative bacteria, and fungi). To evaluate the multi‐class classification model, we use a confusion matrix shown in Figure 2. In this matrix, the vertical axis denotes the actual classes of samples, and the horizontal axis represents the predicted classes. In this study, we classified the samples into 16 categories. Using the confusion matrix, we can evaluate the performance of the model on every single class and learn about the type of microbe where the model has the weakest capability in recognition. In our study, the model has the lowest accuracy for Salmonella enterica that is misclassified as Escherichia coli in 4.45% of the cases. On the other hand, the model has very high accuracy in detecting the difference between microbes and microbes mixed with CHO cells. According to the confusion matrix, the average accuracy of the model is 98.19 ± 0.55% (the standard deviation is calculated over the 5 splits of training and validation sets in the LOOCV approach).
The attention map helps explain the mechanism behind the classification. To explain the internal functionalities of proposed CNN, we use the recently developed Grad‐Cam++ method (Grad‐CAM++, 2018). This method uses a linear combination of positive partial derivatives of class scores for last convolutional layers features as weights to provide the attention map of particular class labels. The resulting attention map helps us understand the regions that are important for CNN to predict the class of input data. In this case, we can identify the range of wavenumbers in spectral data of species that are significant in categorizing them, as shown in Figure 3. According to the attention maps for various species, we notice that any patterns after the largest peak in spectral data (2,850–3,050 cm−1) do not have any significance for the model, and CNN focuses mostly on a range of wavenumbers before the largest peak, which is around 400–2,850 cm−1 in our study. This range is slightly wider than previously published work on Raman spectroscopy in a similar application where the authors had used the spectra in the range of approximately 450–1,800 cm−1 (Ho et al., 2019).
Figure 3.
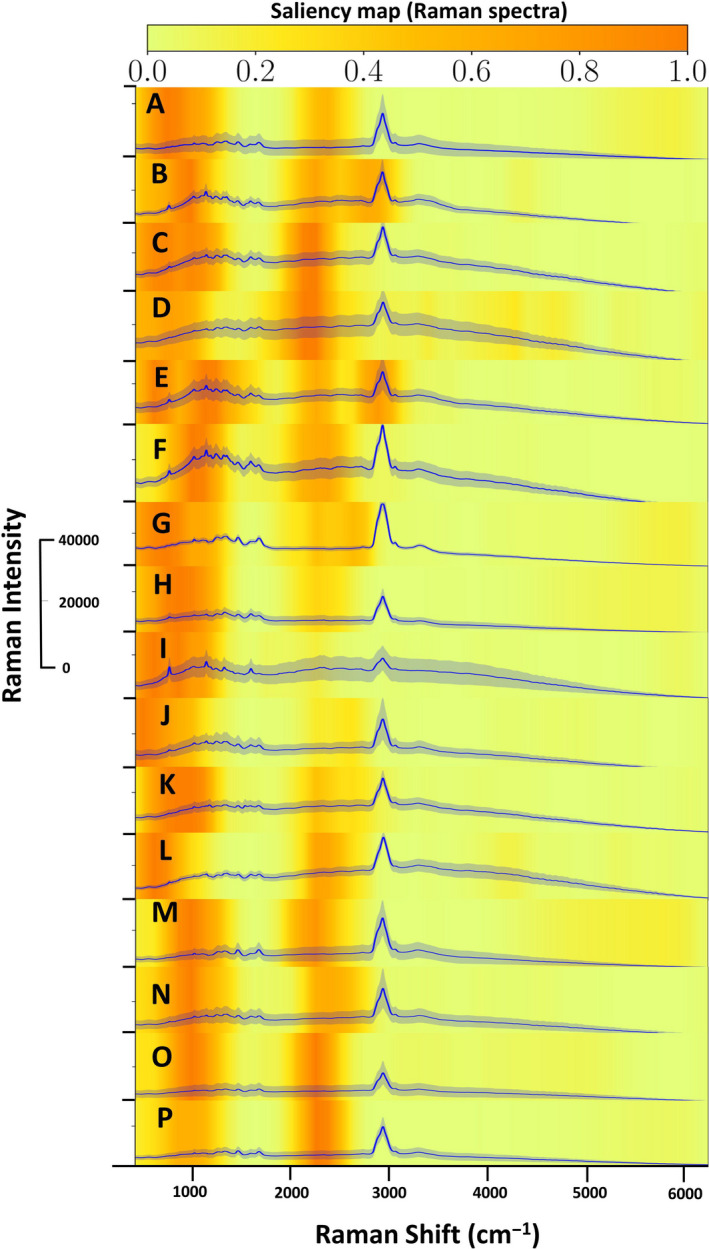
The attention map and Raman spectra for classification of microbes, CHO cells, CHO cells with Gram‐negative bacteria, CHO cells with Gram‐positive bacteria, and CHO cells with fungi. The bold blue line indicates average spectra (6000 scans), and the shaded area around the bold blue line indicates standard deviation. The heatmap (yellow‐orange) indicates the importance of the different segments of the spectra according to the attention map. A. Aspergillus brasiliensis, B. Bacillus cereus, C. Bacillus subtilis, D. Candida albicans, E. Clostridium sporogenes, F. Escherichia coli, G. Micrococcus luteus, H. Propionibacterium acnes, I. Pseudomonas aeruginosa, J. Salmonella enterica, K. Staphylococcus aureus, L. Staphylococcus epidermis, M. CHO cells. N. CHO cells and Aspergillus brasiliensis, O. CHO cells and Bacillus cereus, P. CHO cells and Staphylococcus aureus.
Important features of Raman spectra help distinguish microbial contaminants. The Raman spectra were collected in a wide range of 100–6,000 cm−1 to avoid missing any minute variations within the different microbes. We collected 10 technical replicates by measuring the same dried sample from different points on the substrate (with 200 scans per point) and three biological replicates by repeating the experiment on three different days for each species of interest. The average (bold lines) of 6000 spectra/sample class of all the microbes/cells is depicted in Figure 3 where shaded regions indicate standard deviations.
The Raman spectra of all the microbes and CHO cells have prominent peaks of nucleic acids (1,575, 1,481, 812, 783 cm−1), proteins (1,002 cm−1), and lipids (1,658, 1,448 cm−1) (Ren et al., 2017; Teng et al., 2016). A strong Raman shift found in all the microbes/CHO cells is around 2,850–3,050 cm−1. This region is found to be a non‐specific organic >CH2 and –CH3 stretching modes (Naja et al., 2007). Though a subtle difference can be observed between the spectra visually, high‐throughput analysis requires an automated tool for discrimination (Ho et al., 2019). Thus, CNN helped to classify the microbes and the CHO cells and to highlight which parts of the spectra had the most impact on discrimination between classes. We also observed that mixtures of CHO cells and microbes presented unique spectra that were different from those of pure components, which is consistent with published observations with polymicrobial mixtures (Kotanen et al., 2016).
Although Raman spectroscopy typically suffers from low signal‐to‐noise ratios, here, the use of a polished stainless‐steel substrate (Figure 4) has enabled the concentration of the bacteria and reduction of background noise. The same substrate has been used in the past for detecting proteins at levels as low as 1 fmol (Zhang et al., 2003).
Figure 4.
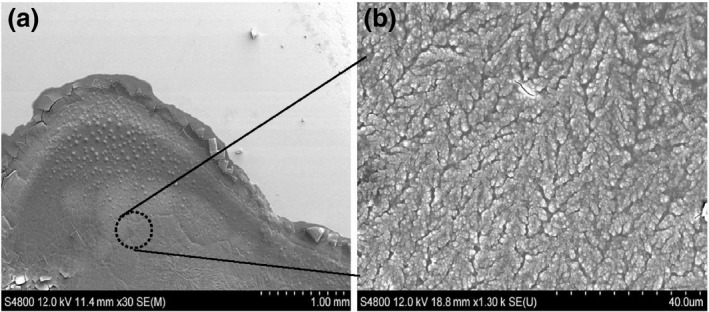
Scanning electron microscope images of (a) E. coli (ATCC 8739) on the surface of the Raman substrate at low magnification. (b) A higher magnification image shows a mat of bacteria on the surface where Raman spectra are collected.
4. CONCLUSIONS
Based on the results presented in the current work, the use of Raman spectroscopy has the following four advantages over other rapid microbial testing methods in the pharmaceutical industry: (a) It can distinguish between several different types of microbes (spanning over Gram‐positive bacteria, Gram‐negative bacteria, and fungi as demonstrated in Figure 2), (b) it can distinguish between microbes and CHO cells in a mixture (as shown in Figure 2) and thus, does not require a physical separation or filtration of the cell types before detection, (c) when a small number of scans are used, it is non‐destructive, and thus, the samples could be used for culturing or sequencing if needed for tracing the contaminant, and (d) collecting spectra require less than a minute, and thus, the technique could be used at‐line in the production plant.
The use of CNN and attention mapping enables the following three advances: (a) high‐accuracy classification despite only subtle differences between different classes, (b) when a training set has been incorporated, classification is rapid (in seconds), and (c) highlighting which parts of the spectra are relevant to classification helps understand the reasoning behind the classification (instead of using a completely black‐box approach).
The Raman spectra also show differences in fluorescence among microbes. Since these experiments were repeated on multiple days, the fluorescent signals also seem to be intrinsic to the microbes and help distinguish different species. Yet, there are also subtle Raman peaks that are highlighted by the heat map which help with differentiation as well (e.g., panels E and F in Figure 3).
The key limitations of the current study are as follows: (a) We used a high concentration of cells (105 cells/ml) to show proof‐of‐concept, (b) we dried the cells down before detection, and (c) we fixed the cells using glutaraldehyde before detection (due to concerns of biosafety). Further studies are needed to demonstrate the feasibility of our method when applied to low microbial concentration in high (and/or variable) CHO cell concentrations.
In future studies, we aim to improve the sensitivity of Raman spectroscopy by using microfluidics and acoustic concentration. We also aim to detect the cells directly in a liquid sample to simplify the process. Since Raman spectroscopy has previously been used to detect single bacterial cells (Xie et al., 2005), we aim to build a highly sensitive and specific method by leveraging Raman spectroscopy and deep learning. Also, it will be important to incorporate quantification of the microbial contamination (potentially by incorporating internal standards) so that the techniques can be applied to monitoring contamination in bioreactors. Our current work serves as stepping stones for developing sensors for PAT and enabling a real‐time release of biologics.
CONFLICT OF INTEREST
None declared.
AUTHOR CONTRIBUTION
Murali Kannan Maruthamuthu: Conceptualization (equal); Data curation (supporting); Formal analysis (equal); Investigation (lead); Methodology (lead); Visualization (equal); Writing‐original draft (lead); Writing‐review & editing (equal). Amir Hossein Raffiee: Data curation (lead); Formal analysis (equal); Investigation (supporting); Methodology (supporting); Software (lead); Visualization (equal); Writing‐original draft (supporting); Writing‐review & editing (supporting). Denilson Mendes de Oliveira: Data curation (supporting); Methodology (supporting). Arezoo M. Ardekani: Conceptualization (equal); Data curation (supporting); Formal analysis (equal); Funding acquisition (lead); Investigation (supporting); Methodology (supporting); Project administration (supporting); Supervision (equal); Writing‐original draft (supporting); Writing‐review & editing (supporting). Mohit S Verma: Conceptualization (equal); Data curation (supporting); Formal analysis (supporting); Funding acquisition (supporting); Investigation (supporting); Methodology (supporting); Project administration (lead); Supervision (equal); Visualization (supporting); Writing‐original draft (supporting); Writing‐review & editing (equal).
ETHICS STATEMENT
None required.
ACKNOWLEDGMENT
This work was partially funded by the grant “Continuous Manufacturing of Biologics,” funded by Purdue College of Engineering’s Faculty Conversations (EFC) and by the National Science Foundation (CBET 1700961). Publication of this article was funded in part by Purdue University Libraries Open Access Publishing Fund.
Appendix 1.
Figure A1.
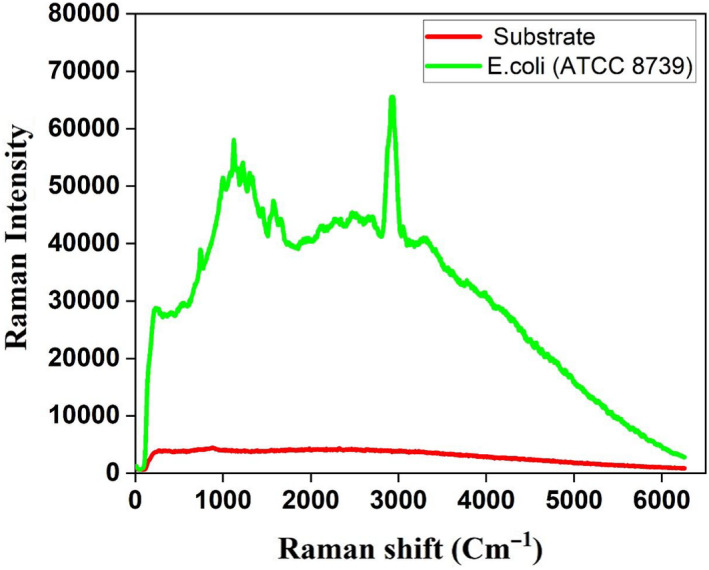
The Raman spectra signal‐to‐noise ratio between the substrate and E. coli (ATCC 8739).
How to cite this article: Maruthamuthu MK, Raffiee AH, De Oliveira DM, Ardekani AM, Verma MS. Raman spectra‐based deep learning: A tool to identify microbial contamination. MicrobiologyOpen. 2020;00:e1122. 10.1002/mbo3.1122
Murali K. Maruthamuthu and Amir Hossein Raffiee contributed equally to this work.
Contributor Information
Arezoo M. Ardekani, Email: ardekani@purdue.edu.
Mohit S. Verma, Email: msverma@purdue.edu.
DATA AVAILABILITY STATEMENT
The Raman spectra and attention maps used for plotting Figure 3 are available in Maruthamuthu et al. (2020): https://doi.org/10.4231/HQGB-K827
References
- Cobo, F. , & Concha, Á. (2020). Environmental microbial contamination in a stem cell bank. Letters in Applied Microbiology, 44, 379–386. 10.1111/j.1472-765X.2006.02095.x [DOI] [PubMed] [Google Scholar]
- Davis, J. G. , Gierszal, K. P. , Wang, P. , & Ben‐Amotz, D. (2012). Water structural transformation at molecular hydrophobic interfaces. Nature, 491, 582–585. 10.1038/nature11570 [DOI] [PubMed] [Google Scholar]
- Deal, A. , Klein, D. , Lopolito, P. , & Schwarz, J. S. (2016). Cleaning and disinfection of Bacillus cereus biofilm. PDA Journal of Pharmaceutical Science and Technology, 70, 208–217. 10.5731/pdajpst.2014.005165 [DOI] [PubMed] [Google Scholar]
- Deep Residual Learning for Image Recognition (2016). Retrieved from https://www.computer.org/csdl/proceedings-article/cvpr/2016/8851a770/12OmNxvwoXv
- England, M. R. , Stock, F. , Gebo, J. E. T. , Frank, K. M. , & Lau, A. F. (2019). Comprehensive evaluation of compendial USP<71>, BacT/Alert Dual‐T, and Bactec FX for detection of product sterility testing contaminants. Journal of Clinical Microbiology, 57, e01548 10.1128/JCM.01548-18 [DOI] [PMC free article] [PubMed] [Google Scholar]
- FDA , & (2015). Pharmaceutical microbiology manual 2014 FDA; Retrieved from https://www.fda.gov/media/88801/download [Google Scholar]
- Grad‐CAM++ : (2018). Generalized Gradient‐Based Visual Explanations for Deep Convolutional Networks ‐ IEEE Conference Publication. Retrieved from https://ieeexplore.ieee.org/document/8354201
- Ho, C.‐S. , Jean, N. , Hogan, C. A. , Blackmon, L. , Jeffrey, S. S. , Holodniy, M. , Banaei, N. , Saleh, A. A. E. , Ermon, S. , & Dionne, J. (2019). Rapid identification of pathogenic bacteria using Raman spectroscopy and deep learning. Nature Communications, 10, 4927 10.1038/s41467-019-12898-9 [DOI] [PMC free article] [PubMed] [Google Scholar]
- Ioffe, S. , & Szegedy, C. (2015) Batch Normalization: Accelerating Deep Network Training by Reducing Internal Covariate Shift. Proceedings of the 32 nd International Conference on Machine Learning, Lille, France, 2015. JMLR: W&CP volume 37, http://proceedings.mlr.press/v37/ioffe15.pdf
- Jiang, M. , Severson, K. A. , Love, J. C. , Madden, H. , Swann, P. , Zang, L. , & Braatz, R. D. (2017). Opportunities and challenges of real‐time release testing in biopharmaceutical manufacturing. Biotechnology and Bioengineering, 114, 2445–2456. 10.1002/bit.26383 [DOI] [PubMed] [Google Scholar]
- Kelley, B. (2009). Industrialization of mAb production technology: The bioprocessing industry at a crossroads. mAbs, 1, 443–452. [DOI] [PMC free article] [PubMed] [Google Scholar]
- Kingma, D. P. , & Ba, J. (2017) Adam: A Method for Stochastic Optimization. arXiv:14126980 [cs].
- Kotanen, C. N. , Martinez, L. , Alvarez, R. , & Simecek, J. W. (2016). Surface enhanced Raman scattering spectroscopy for detection and identification of microbial pathogens isolated from human serum. Sensing and Bio‐Sensing Research, 8, 20–26. 10.1016/j.sbsr.2016.03.002 [DOI] [Google Scholar]
- Krizhevsky, A. , Sutskever, I. , & Hinton, G. E. (2012). ImageNet classification with deep convolutional neural networks. In: Proceedings of the 25th International Conference on Neural Information Processing Systems ‐ Volume 1. Curran Associates Inc., Lake Tahoe, Nevada, pp 1097–1105.
- Maruthamuthu, M. K. , Raffiee, A. H. , Mendes De Oliveira, D. , Ardekani, A. M. , & Verma, M. S. (2020). Raman spectra‐based deep learning – A tool to identify microbial contamination. Purdue University Research Repository, 10.4231/HQGB-K827 [DOI] [PMC free article] [PubMed] [Google Scholar]
- Maruthamuthu, M. K. , Rudge, S. R. , Ardekani, A. M. , Ladisch, M. R. , & Verma, M. S. (2020). Process analytical technologies and data analytics for the manufacture of monoclonal antibodies. Trends in Biotechnology, 38(10), 1169–1186. 10.1016/j.tibtech.2020.07.004 [DOI] [PMC free article] [PubMed] [Google Scholar]
- Naja, G. , Bouvrette, P. , Hrapovic, S. , & Luong, J. H. T. (2007). Raman‐based detection of bacteria using silver nanoparticles conjugated with antibodies. Analyst, 132, 679–686. 10.1039/B701160A [DOI] [PubMed] [Google Scholar]
- Pacheco, F. L. C. , & Pinto, T. D. J. A. (2010). The bacterial diversity of pharmaceutical clean rooms analyzed by the fatty acid methyl ester technique. PDA Journal of Pharmaceutical Science and Technology, 64, 156–166. [PubMed] [Google Scholar]
- Rangan, S. , Kamal, S. , Konorov, S. O. , Schulze, H. G. , Blades, M. W. , Turner, R. F. B. , & Piret, J. M. (2018). Types of cell death and apoptotic stages in Chinese Hamster Ovary cells distinguished by Raman spectroscopy. Biotechnology and Bioengineering 115, 401–412. 10.1002/bit.26476 [DOI] [PubMed] [Google Scholar]
- Ren, Y. , Ji, Y. , Teng, L. , & Zhang, H. (2017). Using Raman spectroscopy and chemometrics to identify the growth phase of Lactobacillus casei Zhang during batch culture at the single‐cell level. Microbial Cell Factories, 16, 233 10.1186/s12934-017-0849-8 [DOI] [PMC free article] [PubMed] [Google Scholar]
- Salaman‐Byron, A. L. (2019). Probable scenarios of process contamination with Cutibacterium (Propionibacterium) acnes in mammalian cell bioreactor. PDA Journal of Pharmaceutical Science and Technology, 10.5731/pdajpst.2019.010710. [DOI] [PubMed] [Google Scholar]
- Shintani, H. (2016). Validation study of rapid assays of bioburden, endotoxins and other contamination. Biocontrol Science, 21, 63–72. 10.4265/bio.21.63 [DOI] [PubMed] [Google Scholar]
- Surrette, C. , Scherer, B. , Corwin, A. , Grossmann, G. , Kaushik, A. M. , Hsieh, K. , Zhang, P. , Liao, J. C. , Wong, P. K. , Wang, T. H. , & Puleo, C. M. (2018). Rapid microbiology screening in pharmaceutical workflows. SLAS TECHNOLOGY: Translating Life Sciences Innovation, 23, 387–394. 10.1177/2472630318779758 [DOI] [PMC free article] [PubMed] [Google Scholar]
- Teng, L. , Wang, X. , Wang, X. , Gou, H. , Ren, L. , Wang, T. , Wang, Y. , Ji, Y. , Huang, W. E. , & Xu, J. (2016). Label‐free, rapid and quantitative phenotyping of stress response in E. coli via ramanome. Scientific Reports, 6, 10.1038/srep34359. [DOI] [PMC free article] [PubMed] [Google Scholar]
- Xie, C. , Mace, J. , Dinno, M. A. , Li, Y. Q. , Tang, W. , Newton, R. J. , & Gemperline, P. J. (2005). Identification of single bacterial cells in aqueous solution using Confocal Laser Tweezers Raman Spectroscopy. Analytical Chemistry, 77, 4390–4397. 10.1021/ac0504971 [DOI] [PubMed] [Google Scholar]
- Zhang, D. , Xie, Y. , Mrozek, M. F. , Ortiz, C. , Davisson, V. J. , & Ben‐Amotz, D. (2003). Raman detection of proteomic analytes. Analytical Chemistry, 75, 5703–5709. 10.1021/ac0345087 [DOI] [PubMed] [Google Scholar]
Associated Data
This section collects any data citations, data availability statements, or supplementary materials included in this article.
Data Availability Statement
The Raman spectra and attention maps used for plotting Figure 3 are available in Maruthamuthu et al. (2020): https://doi.org/10.4231/HQGB-K827


