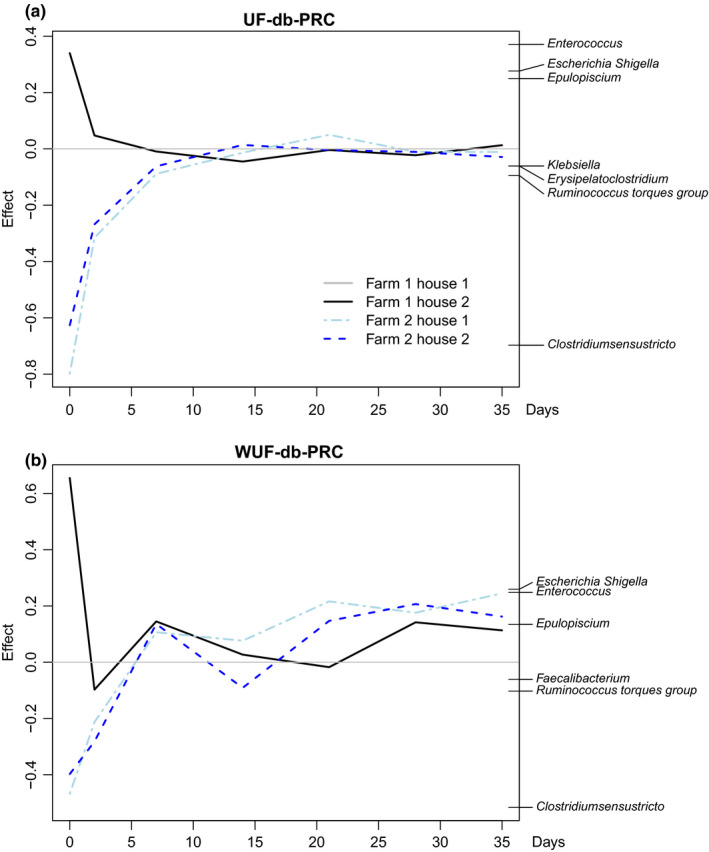
FIGURE 3.

Differences in temporal dynamics of cecal microbiota composition between farms and houses. Principal response curve (PRC) analysis based on unweighted (a) and weighted (b) UniFrac distances between samples at the genus level. Genus weights contributing with an effect above 0.1 to each statistical model are shown on the right side of each panel. Each curve corresponds to one of the poultry houses, with Farm 1, poultry house 1, set as a reference baseline. For each house and time point, data from nine individual broilers are included
