Abstract
Objective:
Precision immunotherapy in non-small cell lung cancer (NSCLC) have been the focus of tumor immunity research. The aim of this study is to identify novel candidate biomarkers predicting the response to immunotherapy in NSCLC.
Methods:
GSE126044 was obtained from Gene Expression Omnibus (GEO). According to the response to anti-PD-1 antibody, 2 groups were divided: response group and non-response group. Differentially expressed genes (DEGs) were screened using R. Gene Ontology (GO) and Kyoto Encyclopedia of Genes and Genomes (KEGG) analyses were performed. ROC curves and possible pathways of the seed genes were further analyzed.
Results:
In total, 588 DEGs (487 upregulated DEGs and 101 downregulated) were identified. GO and KEGG analyses showed that upregulated DEGs were mainly enriched in immune response and cell adhesion pathways, while VEGF signaling pathway and metabolic pathways were mainly enriched in downregulated DEGs. In addition, CSF1 R and HCST showed more powerful predictive ability than PDL1. More importantly, these candidate genes were not only positively correlated with the expression of PDL1 and the infiltration of CD8+ T cells in the immune microenvironment, but also might improve the prognosis in lung squamous cell carcinoma.
Conclusions:
CSF1 R and HCST might be novel predictive markers for immunotherapy in NSCLC.
Keywords: biomarker, immunotherapy, lung cancer, data mining
Introduction
Non-small cell lung cancer (NSCLC) is still the leading disease threatening human life and health worldwide,1,2 among which mainly including lung adenocarcinoma and lung squamous cell carcinoma. Although prominent progress in treatment over the last decade, the mortality rate among in NSCLC patients remains high, and the 5-year survival rate is approximately 15% in patients with advanced NSCLC. Encouragingly, immunotherapy, especially targeting programmed cell death protein 1 (PD-1) monoclonal antibody, has made a breakthrough in some patients with various cancer types.3-6 And anti-PD-1 therapy can prolong survival in patients with NSCLC. However, its success is limited to a subset of patients.7 One important reason is that there is still a lack of effective biomarkers for predicting the response to immunotherapy in NSCLC. Therefore, understanding the molecular determinants of predictive biomarkers for immunotherapy is one of the critical challenges in NSCLC.
At present, the expression of PDL1 is a widely used and effective biomarker for immunotherapy in NSCLC8; however, not all patients with positive expression of PDL1 benefit from immunotherapy, but it can even lead to hyperprogressive disease.9 The possible reason is that the expression of PDL1 is mainly assayed by immunohistochemistry (IHC), moreover, variable cutoffs and different antibodies with differing affinities lead to inconsistent results of PDL1 by IHC testing. In addition, tumor mutation burden (TMB) has also been studied for its ability to predict the efficacy of immunotherapy in NSCLC.10-13 However, TMB alone cannot fully predict the response to immunotherapy, and the combination of TMB with other biomarkers may enhance the predictive power of TMB in NSCLC.14 In conclusion, these biomarkers still have some limitations in the prediction of the response to immunotherapy in NSCLC. Hence, it is urgent and necessary to find novel effective predictive biomarkers for precision immunotherapy.
With the development of next-generation sequencing technology, more and more high-throughput sequencing results on cancers have been released in a public database of gene expression omnibus (GEO), which is providing a novel strategy to solve this problem. Previous studies have confirmed the gene mutation signature for the prediction of possible therapeutic biomarkers of immunotherapy. However, the efficacy of immunotherapy in NSCLC cannot yet be predicted completely and accurately. Because of the complexity of the immune response and immunotherapy, we hypothesized that in addition to genomics studies, transcriptomics investigation may also be necessary for accurate prediction of the clinical benefit. Hence, we performed a study of GEO accession GSE126044 and analyzed sequencing data of differential gene expression between the response group and non-response group in NSCLC. The aim of this study is to explore the differences in gene expression profiles and enrichment pathways between the 2 groups of patients and identify potential biomarkers predicting the clinical benefit of immunotherapy. It is of great clinical significance for individualized immunotherapy in NSCLC.
Material and Methods
Gene Expression Profile Data
Gene Expression Omnibus (GEO) database is a public functional genomics data repository (https://www.ncbi.nlm.nih.gov/geo/). GSE126044, GSE110390 and GSE136961 were obtained from the GEO database by searching for the keywords checkpoint inhibitor or immunotherapy or PD-1 and lung cancer. Only high-throughput sequencing expression profiles (GSE126044) obtained for humans were downloaded.
Screening of Differentially Expressed Genes (DEGs)
The series of matrix files was downloaded and processed using R language software. The screening of DEGs and the generation of volcano plots were performed using the limma package. Genes with a log FoldChange > 2 and an adjusted p-value < 0.05 were considered DEGs.
GO Term and KEGG Enrichment Pathway Analyses of DEGs
To estimate the functional domains and biological implications of DEGs, Gene Ontology (GO) terms and Kyoto Encyclopedia of Genes and Genomes (KEGG) pathways were identified using the Database for Annotation, Visualization and Integrated Discovery (DAVID), an online database (https://david.ncifcrf.gov/), for estimating functional domains and biological implications. A p-value < 0.05 was recommended. The top 10 GO terms and KEGG enrichment pathways were mapped using the Hmisc and ggplot2 packages in R language software.
Construction and Analysis of the PPI Network
The protein-protein interaction (PPI) network of DEGs was constructed using the String online database, which is designed to evaluate and predict protein-protein interactions (PPI) (https://string-db.org/cgi/input.pl). Further analysis of PPIs was performed and visualized using Cytoscape software (version 3.7.2). The MCODE package was applied to screen and identify the important modules and seed genes that might play important regulatory roles in the immune response. The screening criterion of these seed genes were as follows, “Degree cutoff = 2,” “node score cutoff = 0.2,” “k-core = 2” and “max. depth = 100.” GO terms and KEGG enrichment pathways of the modules were analyzed.
Screening Candidate seed Genes in the Modules
According to GO chord and KEGG chord analyses of important modules, seed genes involved in the immune response were screened. Candidate seed genes were identified for further study.
ROC Analysis of Candidate Genes and Analysis Correlation With the Expression of Immune-Related Genes PDL1 and IL6
Moreover, a ROC curve was used to analyze the predictive efficacy of the candidate seed genes, and the candidate genes were compared with the currently recognized biomarker CD274.
The expression of PDL1 is widely recognized as the most powerful predictive biomarker for anti-PD-1 therapy, suggesting that PDL1 play an important role in the immune response of lung adenocarcinoma. Previous studies have proven that IL-6 is a keystone cytokine in cancer immunotherapy. Therefore, these 2 pathways are generally regarded as the key pathways of cancer immunotherapy. To elucidate the possible mechanisms and enrichment pathways of seed genes predicting the clinical benefit of immunotherapy, the correlation between these candidate genes and the immune-related pathways of PDL1 and IL6 were analyzed in the TIMER database. A correlation coefficient over 0.3 was considered statistically significant.
Correlation Between Candidate Seed Genes and CD8+ T cells in the Immune Microenvironment
The infiltrating immune cells in the microenvironment are considered to be of great significance for predicting the efficacy of immunotherapy and TIMER web server is a comprehensive resource for systematical analysis of immune infiltrates across diverse cancer types (https://cistrome.shinyapps.io/timer/). CD8+ T cell is generally considered to be the most important effector cell of immunotherapy. Hence, the relationship between seed genes and immunotherapy-related effector CD8+ T cells was further explored in the TIMER database.
Results
Study Design and Workflow Overview
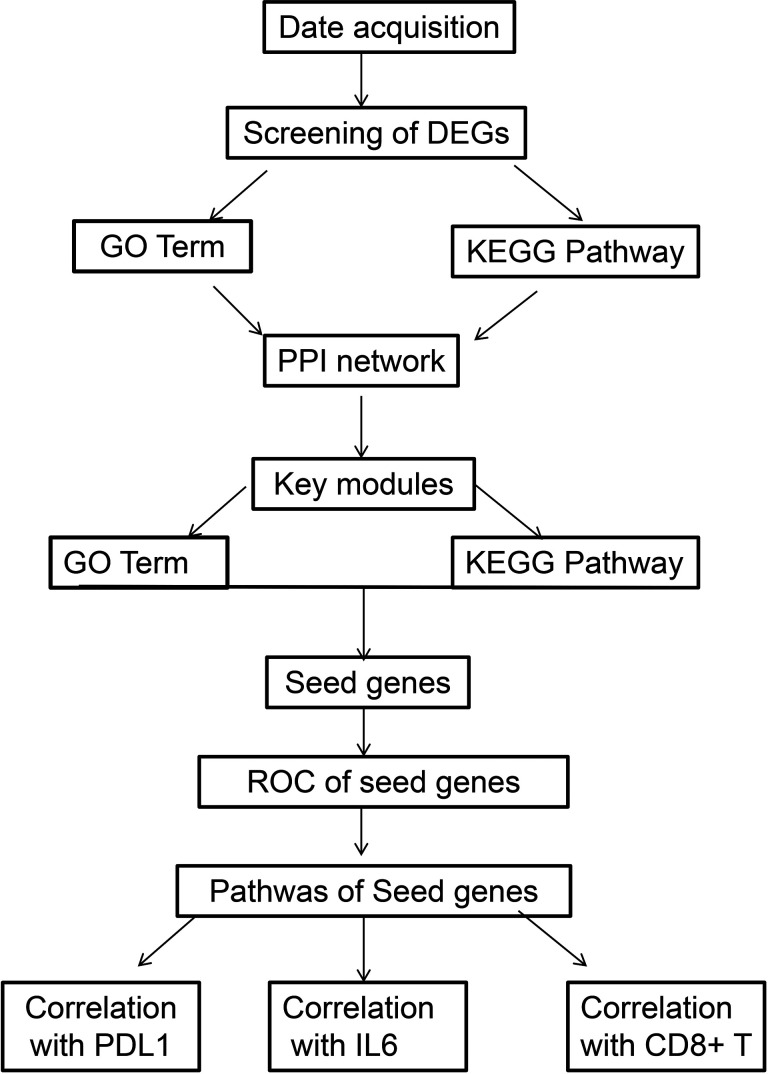
Based on a keyword search and high-throughput sequencing expression profiles, only GSE126044 was obtained from the GEO database. Two groups were established based on the response to immunotherapy: response group (5 people) and non-response group (11 people). The workflow is shown in Figure 1.
Figure 1.
Study design and workflow overview.
Screening and Identification of DEGs
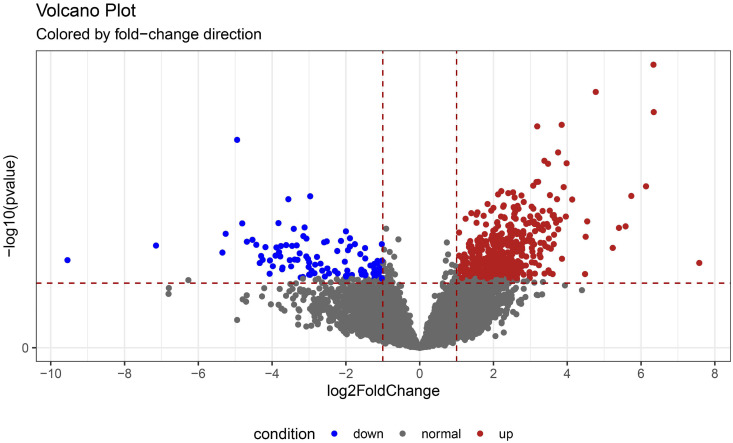
Our results showed that 18747 genes were detected in the 2 groups. According to the log FoldChange > 2 and adjusted p-value < 0.05 criteria, a total of 588 DEGs were identified, of which 487 were upregulated and 101 were downregulated in the response group compared to the non-response group. Volcano plots are shown in Figure 2.
Figure 2.
Volcanic plot of DEGs between the response and non-response groups in NSCLC. Red represents genes with upregulated expression levels in the response group, blue represents genes with downregulated expression levels in the response group, and gray represents genes with unchanged expression between the 2 groups.
GO Terms and KEGG Pathway Enrichment Analysis of DEGs
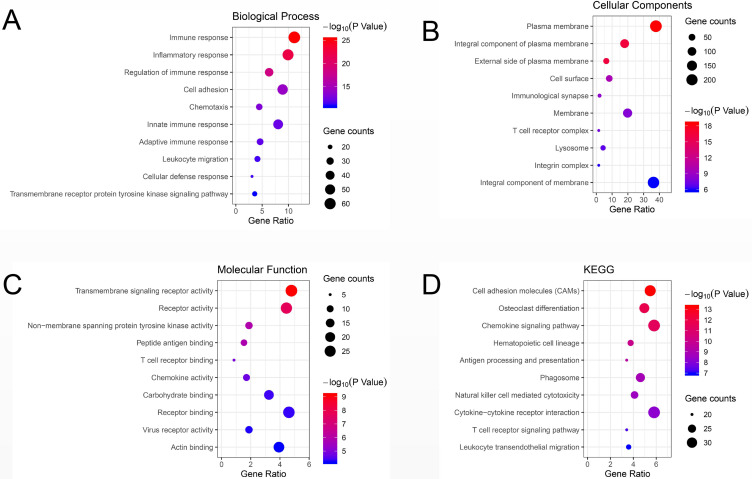
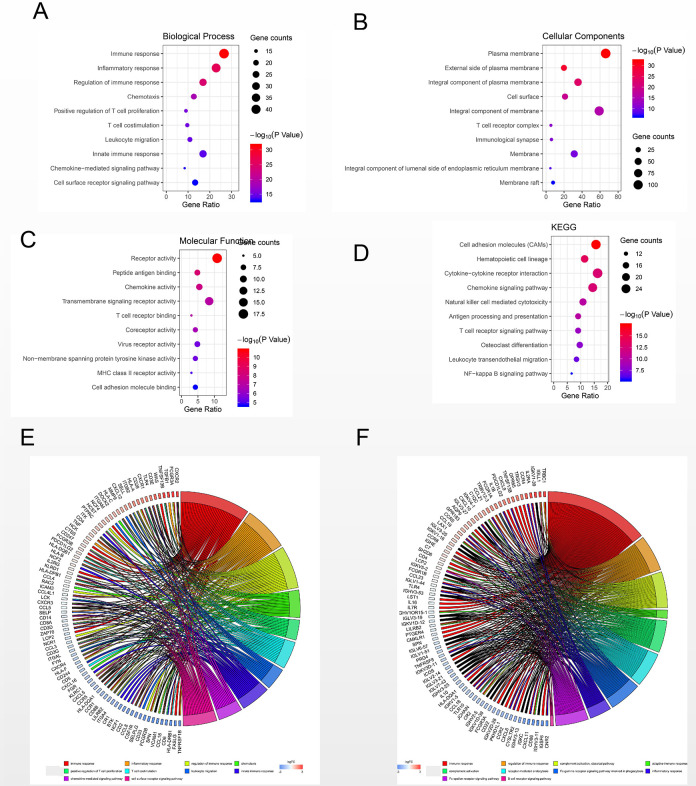
Compared to those in the non-response group, GO terms and KEGG pathways of upregulated DEGs in the response group were mainly enriched in biological processes and pathways related to immune response (BP, GO:0006955), integral component of plasma membrane (CC, GO:0005887), transmembrane signaling receptor activity (MF, GO:0004888), cell adhesion molecules (CAMs) (KEGG, hsa04514) and chemokine signaling pathway (KEGG, hsa04062). On the other hand, biological processes and pathways associated with epidermal development (BP, GO: 0008544), extracellular exosomes (CC, GO0070062), ligand-gated ion channel activity (MF, GO: 0015276), VEGF signaling pathway (KEGG, hsa04370) and metabolic pathways (KEGG, hsa01100) were mainly enriched in downregulated DEGs. The detailed results are shown in Table 1. The top 10 GO terms and enriched KEGG pathways were mapped using the Hmisc and ggplot2 packages. The results are shown in Figure 3.
Table 1.
Top 5 GO Terms and KEGG Pathways.
| Up-regulated DEGs | |||||
|---|---|---|---|---|---|
| Category | Term | Count | % | P-Value | FDR |
| GOTERM_BP_DIRECT | immune response | 65 | 13.42975207 | 1.71E-30 | 2.98E-27 |
| GOTERM_BP_DIRECT | inflammatory response | 57 | 11.7768595 | 4.31E-26 | 7.48E-23 |
| GOTERM_BP_DIRECT | regulation of immune response | 37 | 7.644628099 | 8.92E-22 | 1.55E-18 |
| GOTERM_BP_DIRECT | Chemotaxis | 25 | 5.165289256 | 1.32E-14 | 2.29E-11 |
| GOTERM_BP_DIRECT | innate immune response | 45 | 9.297520661 | 1.64E-14 | 2.85E-11 |
| GOTERM_CC_DIRECT | plasma membrane | 198 | 40.90909091 | 1.66E-21 | 2.22E-18 |
| GOTERM_CC_DIRECT | integral component of plasma membrane | 101 | 20.8677686 | 4.40E-21 | 5.88E-18 |
| GOTERM_CC_DIRECT | external side of plasma membrane | 36 | 7.438016529 | 1.46E-18 | 1.95E-15 |
| GOTERM_CC_DIRECT | Membrane | 112 | 23.14049587 | 1.39E-12 | 1.85E-09 |
| GOTERM_CC_DIRECT | cell surface | 46 | 9.504132231 | 4.83E-12 | 6.46E-09 |
| GOTERM_MF_DIRECT | transmembrane signaling receptor activity | 28 | 5.785123967 | 1.10E-11 | 1.62E-08 |
| GOTERM_MF_DIRECT | receptor activity | 25 | 5.165289256 | 2.37E-09 | 3.50E-06 |
| GOTERM_MF_DIRECT | peptide antigen binding | 9 | 1.859504132 | 3.80E-07 | 5.62E-04 |
| GOTERM_MF_DIRECT | non-membrane spanning protein tyrosine kinase activity | 10 | 2.066115702 | 2.31E-06 | 0.003414307 |
| GOTERM_MF_DIRECT | carbohydrate binding | 19 | 3.925619835 | 3.69E-06 | 0.005465935 |
| KEGG_PATHWAY | ll adhesion molecules (CAMs) | 31 | 6.404958678 | 2.77E-14 | 3.49E-11 |
| KEGG_PATHWAY | teoclast differentiation | 29 | 5.991735537 | 1.55E-13 | 1.97E-10 |
| KEGG_PATHWAY | emokine signaling pathway | 32 | 6.611570248 | 8.16E-12 | 1.03E-08 |
| KEGG_PATHWAY | matopoietic cell lineage | 22 | 4.545454545 | 1.65E-11 | 2.09E-08 |
| KEGG_PATHWAY | tigen processing and presentation | 20 | 4.132231405 | 8.16E-11 | 1.03E-07 |
| Down-regulated DEGs | |||||
| Category | Count | % | P-Value | FDR | |
| GOTERM_BP_DIRECT | epidermis development | 5 | 4.95049505 | 9.89E-04 | 1.402276079 |
| GOTERM_BP_DIRECT | anterior/posterior pattern specification | 4 | 3.96039604 | 0.008282332 | 11.19465957 |
| GOTERM_BP_DIRECT | regulation of endothelial cell migration | 2 | 1.98019802 | 0.030690865 | 35.91621507 |
| GOTERM_BP_DIRECT | surfactant homeostasis | 2 | 1.98019802 | 0.040712771 | 44.75213723 |
| GOTERM_BP_DIRECT | cell proliferation | 6 | 5.940594059 | 0.041472764 | 45.37368224 |
| GOTERM_CC_DIRECT | lateral plasma membrane | 3 | 2.97029703 | 0.030594477 | 29.96310402 |
| GOTERM_CC_DIRECT | apical plasma membrane | 5 | 4.95049505 | 0.06375991 | 53.00598794 |
| GOTERM_CC_DIRECT | ruffle membrane | 3 | 2.97029703 | 0.067032426 | 54.85469851 |
| GOTERM_CC_DIRECT | bicellular tight junction | 3 | 2.97029703 | 0.115507169 | 75.50857327 |
| GOTERM_CC_DIRECT | cytoplasmic vesicle | 4 | 3.96039604 | 0.121577153 | 77.36737309 |
| GOTERM_MF_DIRECT | actin binding | 6 | 5.940594059 | 0.015794288 | 17.88057551 |
| GOTERM_MF_DIRECT | sequence-specific DNA binding | 7 | 6.930693069 | 0.055854092 | 50.89357101 |
| GOTERM_MF_DIRECT | phosphatidylcholine 1-acylhydrolase activity | 2 | 1.98019802 | 0.056505636 | 51.31125112 |
| GOTERM_MF_DIRECT | Rho guanyl-nucleotide exchange factor activity | 3 | 2.97029703 | 0.06235964 | 54.92020291 |
| GOTERM_MF_DIRECT | quinone binding | 2 | 1.98019802 | 0.071360474 | 59.9920399 |
| KEGG_PATHWAY | GF signaling pathway | 3 | 2.97029703 | 0.023549806 | 23.63944894 |
| KEGG_PATHWAY | tabolic pathways | 10 | 9.900990099 | 0.037458967 | 35.08367142 |
| KEGG_PATHWAY | RH signaling pathway | 3 | 2.97029703 | 0.04905159 | 43.40214167 |
| KEGG_PATHWAY | flammatory mediator regulation of TRP channels | 3 | 2.97029703 | 0.055992696 | 47.90530816 |
| KEGG_PATHWAY | utamatergic synapse | 3 | 2.97029703 | 0.073050211 | 57.61895265 |
Figure 3.
Bubble plot of the top 10 GO terms and KEGG enrichment pathways of DEGs. (A) GO analysis of DEGs in the biological process category. (B) GO analysis of DEGs in the cellular component category. (C) GO analysis of DEGs in the molecular function category. (D) KEGG enrichment analysis of DEGs. A higher gene ratio represents a higher level of enrichment. The size of the dot indicates the number of target genes in the pathway, and the color of the dot reflects the P-value range.
Screening Models and Seed Genes in the PPI Network
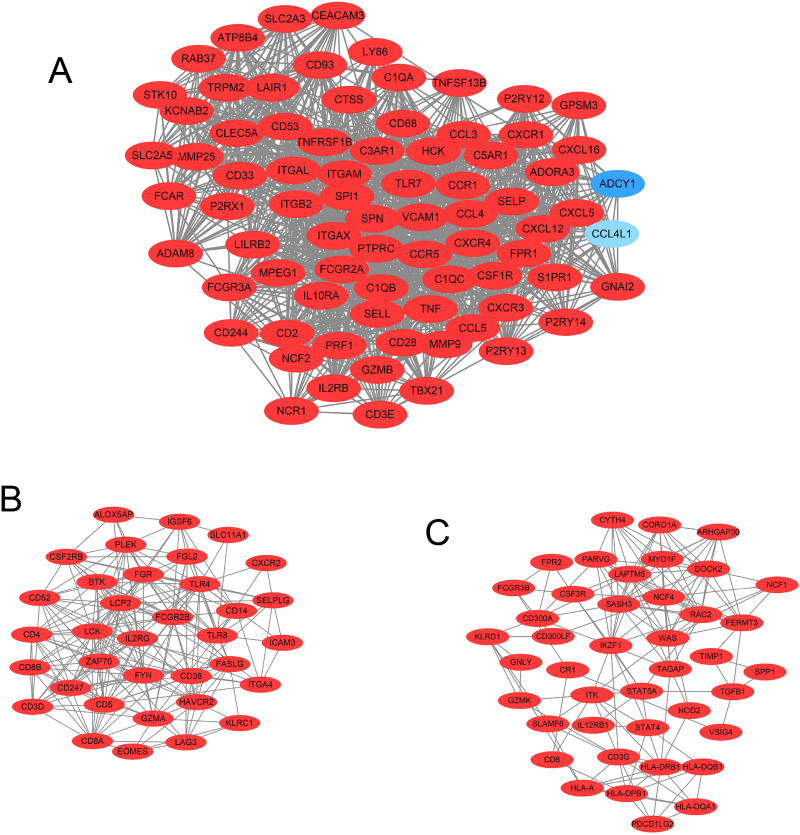
Our results showed that the PPI network consisted of 584 nodes with 6095 edges. The average node degree was 20.9, and the average local clustering coefficient was 0.456 (PPI enrichment p-value: < 1.0e-16). In addition, in the PPI network, 14 important modules and 9 seed genes in the modules were screened using MCODE in Cytoscape software. The 3 modules with the highest node degrees were selected for further research. The upregulated genes are shown in red, while the downregulated genes are shown in blue. The diagram of these 3 modules is shown in Figure 4.
Figure 4.
The top 3 models in the PPI network were screened using Cytoscape software. (A) Top 1 model in the PPI network. (B) Top 2 model in the PPI network. (C) Top 3 model in the PPI network.
In terms of GO and KEGG analyses, the results of genes in the top 3 modules were consistent with the results of the DEGs. The results are shown in Figure 5. Using GO and KEGG chord analyses, the CSF1 R and HCST genes, which are involved in important immune pathways (cytokine-cytokine receptor interaction and natural killer cell mediated cytotoxicity, respectively) in these modules were identified. The detailed results are shown in Table 2.
Figure 5.
Bubble plot of the top 10 GO terms and KEGG enrichment pathways of DEGs in the PPI models. (A) GO analysis of DEGs in the biological process category. (B) GO analysis of DEGs in the cellular component category. (C) GO analysis of DEGs in the molecular function category. (D) KEGG enrichment analysis of DEGs. A higher gene ratio represents a higher level of enrichment. The size of the dot indicates the number of target genes in the pathway, and the color of the dot reflects the P-value range. (E) GO chord plot of DEGs. (F) KEGG chord plot of DEGs.
Table 2.
Seed Genes Involved in Pathways.
| ID | Gene Name | KEGG_PATHWAY |
|---|---|---|
| APOBR | apolipoprotein B receptor(APOBR) | triglyceride metabolic process |
| CSF1R | colony stimulating factor 1 receptor(CSF1 R) | Cytokine-cytokine receptor interaction |
| GSTM4 | glutathione S-transferase mu 4(GSTM4) | Glutathione metabolism |
| HCST | hematopoietic cell signal transducer(HCST) | Natural killer cell mediated cytotoxicity |
| ITGAD | integrin subunit alpha D(ITGAD) | Regulation of actin cytoskeleton, |
| NOD2 | nucleotide binding oligomerization domain containing 2(NOD2) | NOD-like receptor signaling pathway |
| PLD3 | phospholipase D family member 3(PLD3) | Glycerophospholipid metabolism |
| PTGS1 | prostaglandin-endoperoxide synthase 1(PTGS1) | Arachidonic acid metabolism |
| RNASE2 | ribonuclease A family member 2(RNASE2) | RNA catabolic process |
ROC Curve Analysis of CSF1 R and HCST and Correlation With the Expression of the Immune-Related Genes PDL1 and IL6
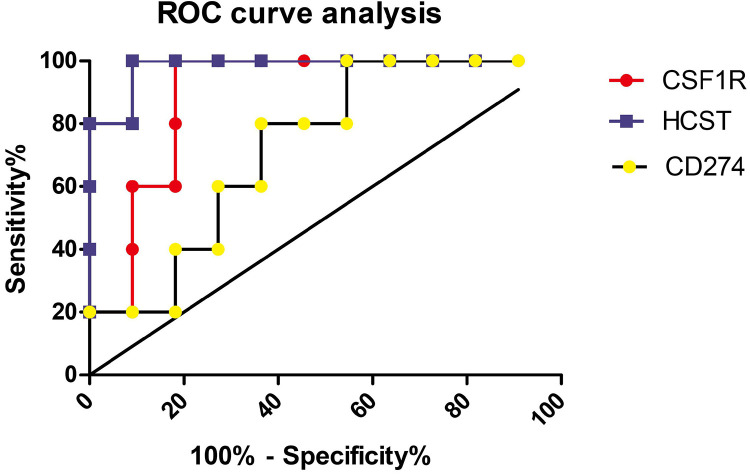
Our results showed that the areas under the ROC curve of CSF1 R, HCST and CD274 for predicting the clinical benefit of immunotherapy were 0.8909, 0.9818 and 0.7273, respectively (Figure 6).
Figure 6.
ROC curves of CSF1 R, HCST and CD274 for predicting the clinical benefit of immunotherapy.
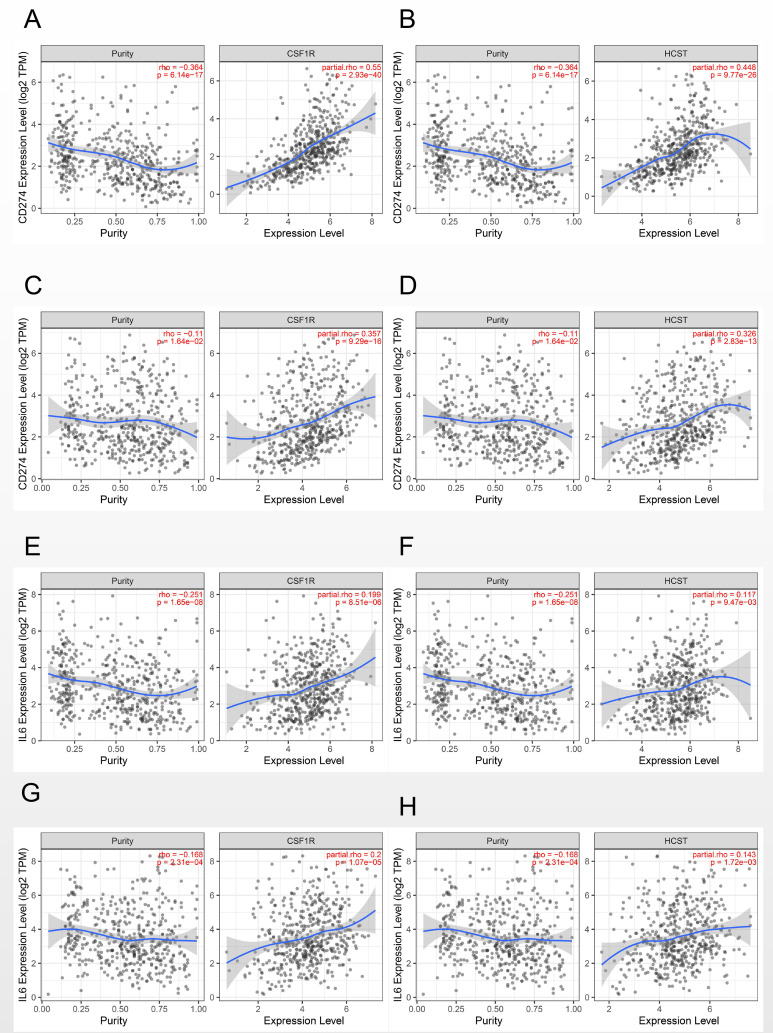
A correlation coefficient greater than 0.3 was considered clinically significant. Our results showed that CSF1 R and HCST were positively correlated with the expression of PDL1 in both lung adenocarcinoma (0.55, p = 2.39e-40 and 0.448, p = 9.77e-26, respectively) and squamous cell carcinoma (0.357, p = 9.29e-16 and 0.326, p = 2.83e-13, respectively) (Figure 7A-D). However, no significant correlation between the 2 genes and IL-6 was found in either lung adenocarcinoma (0.199, p = 8.51e-06 and 0.117, p = 9.47e-03, respectively) or squamous cell carcinoma (0.2, p = 1.07e-05 and 0.143, p = 1.72e-03, respectively) (Figure 7E-H).
Figure 7.
Correlation of CSF1 R and HCST with the expression of the immune-related genes PDL1 and IL6. (A) CSF1 R with PDL1 in LUAD. (B) HCST with PDL1 in LUAD. (C) CSF1 R with PDL1 in LUSC. (D) HCST with PDL1 in LUAD. (E) CSF1 R with IL6 in LUAD. (F) HCST with IL6 in LUAD. (G) CSF1 R with IL6 in LUSC. (H) HCST with IL6 in LUAD.
Correlation Between Candidate Seed Genes and CD8+ T Cells in the Immune Microenvironment
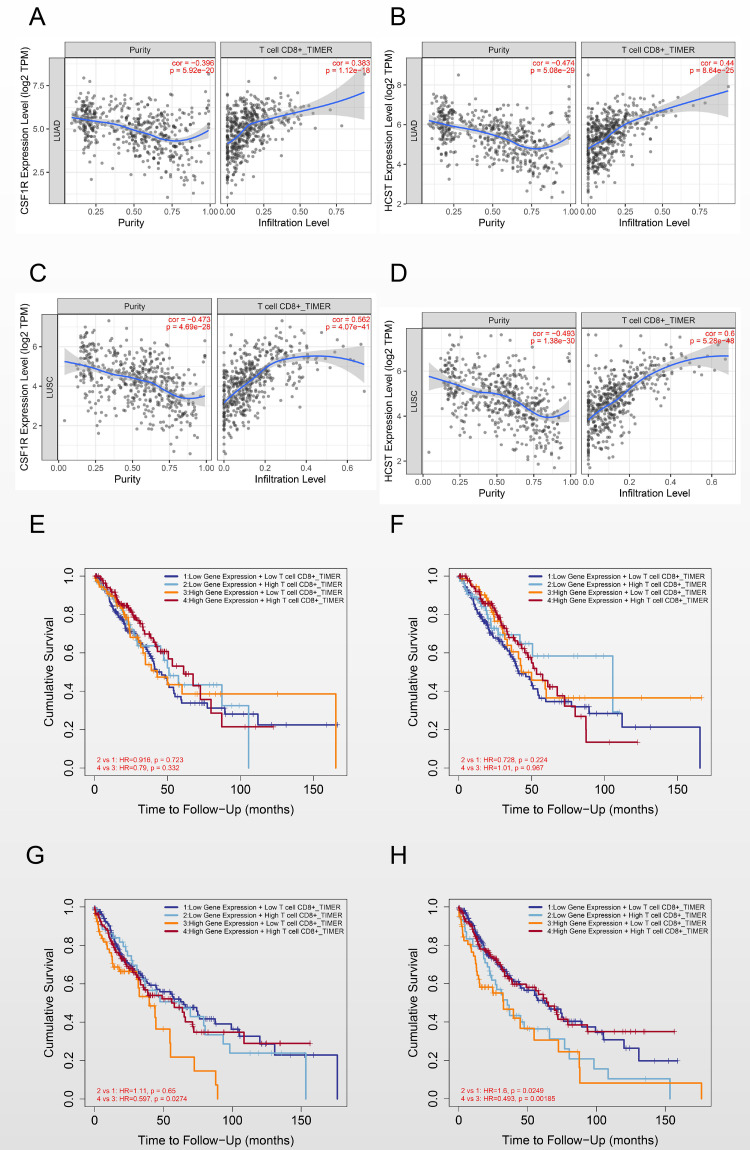
According to a correlation coefficient greater than 0.3, CSF1 R and HCST were positively correlated with CD8+ T cells in both lung adenocarcinoma (0.383, p = 1.12e-18 and 0.44, p = 8.64e-25, respectively) and lung squamous cell carcinoma (0.562, p = 4.07e-41 and 0.6, p = 5.28e-48, respectively). (Figure 8A-D).
Figure 8.
Correlation of CSF1 R and HCST with CD8+ T cells in the immune microenvironment. (A) CSF1 R with CD8+ T cells in LUAD. (B) HCST with CD8+ T cells in LUAD. (C) CSF1 R with CD8+ T cells in LUSC. (D) HCST with CD8+ T cells in LUSC. (E) Effect of CSF1 R and CD8+ T cell immune infiltration on the clinical outcome in LUAD. (F) Effect of HCST and CD8+ T cell immune infiltration on the clinical outcome in LUAD. (G) Effect of CSF1 R and CD8+ T cell immune infiltration on the clinical outcome in LUSC. (H) Effect of HCST and CD8+ T cell immune infiltration on the clinical outcome in LUSC.
Moreover, in the prognostic analysis of candidate genes together with CD8+ T cells in NSCLC, our results showed that, in the case of low CSF1 R or HCST expression, high infiltration of CD8+ T cells could not improve the prognosis of either lung adenocarcinoma (HR = 0.916, p = 0.723 and HR = 0.728, p = 0.224, respectively) or lung squamous cell carcinoma (HR = 1.11, p = 0.65 and HR = 1.6, p = 0.0249, respectively). In the case of high CSF1 R or HCST expression, high infiltration of CD8+ T cells could improve the prognosis in lung squamous cell carcinoma (HR = 0.597, p = 0.0274 and HR = 0.493, p = 0.00185, respectively) but not in lung adenocarcinoma (HR = 0.79, p = 0.332 and HR = 1.01, p = 0.967, respectively) (Figure 8E-H).
Discussion
Increasing studies have indicated that immunotherapy is a promising immunotherapy in NSCLC. However, the overall response rate is only approximately 20%. Hence, precision and individualized immunotherapy in NSCLC has become a hot topic for clinicians and researchers.15-17 Due to the complexity of the immune response and immunotherapy, it is unlikely that PDL1 or TMB alone will be sufficient to predict the response to immunotherapy in NSCLC.
The development of next-generation sequencing technology provides a new strategy to identify novel biomarkers predicting immune efficacy in NSCLC. Previous studies have shown that the KRAS and TP53 mutation status could predict the response to PD-1 blockade, and STK11/LKB1 mutations were a significant negative biomarker correlating with PDL1.18,19 However, due to the complexity of tumor immunotherapy, genomic changes alone cannot fully predict the efficacy of immunotherapy. It is essential to combine tumor genomics and transcriptomics to accurately predict the clinical benefits of immunotherapy.
One important finding in this study is that, based on next-generation sequencing, the results revealed that differences in transcriptome expression profile characteristics in the 2 groups of patients, which provided the basis for the subsequent identification of predictive biomarkers for anti-PD-1 therapy. Hwang S et al. used an immune gene panel to detect predictive markers of immunotherapy. The results showed that the mRNA expression levels of CD137 and PSMB9 in the durable clinical benefit (DCB) group were higher than those in the non-durable benefit (NDB) group.20 In addition, previous study have shown that the IFNγ+ mRNA signature might assist in identifying patients with improved outcomes for immunotherapy, independent of PD-L1 assessed by IHC.21 Although few studies have explored possible biomarkers, these studies only selected immune-related genes, and some important predictive biomarkers might be missing. In our study, all the high-throughput expression profile data were included to avoid the limitations of previous studies. More importantly, our results indicated that more immune-related pathways, such as the immune response and cytokine-related pathways, were found in the response group, which have been proved to be of importance to a better immunotherapeutic response in NSCLC. In addition, our results identified several important modules in immunotherapy. Moreover, the results of GO and KEGG pathway analyses in the modules were consistent with those in DEGs, which laid a theoretical foundation for further searching for seed genes in the modules. The identified pathways, such as antigen processing and presentation and the T cell receptor signaling pathway, have been proven to be important for a better immunotherapeutic response in NSCLC.22 These results were consistent with our findings.
Notably, our results also showed that CSF1 R and HCST were involved in the immune regulatory pathway in the modules. More importantly, our results indicated that, compared to the currently recognized expression of CD274, the expression of CSF1 R and HCST had better efficacy in predicting the response to anti-PD-1 therapy in NSCLC.
Understanding the possible pathways of candidate seed genes in immunotherapy is crucial for the precision immunotherapy of NSCLC. Considering the PDL1 and IL6 pathways are of great significance for immunotherapy in NSCLC, hence, the relationship of candidate seed genes with immune-related PDL1 and IL6 expression were further analyzed. Our results indicated that CSF1 R and HCST might participate in the PDL1 regulatory pathway in the immunotherapy of NSCLC, but not in the IL6 pathway.
Furthermore, the infiltration of CD8+ T cells, as the key effector cells, in the tumor microenvironment, is related to more than just tumor development,23-25 and, more importantly, plays a significant role in immunotherapy and prognosis. Our study further found a positive correlation between candidate genes and CD8+ T cells. The unexpected findings of this study were that the CD8+ T cell improvement of prognosis might depend on the high expression of CSF1 R or HCST in lung squamous cell carcinoma. As Wu L reported, the possible reason is that, compared with lung adenocarcinoma, lung squamous cell carcinoma has lower proportions of CD8+ T cells and lower activity of immune responses,26 and CD8+ T cells alone cannot improve the prognosis of lung squamous cell carcinoma. In addition, several studies have shown that CSF1 R play an important role in the regulation of CD8+ T cells in the tumor immune microenvironment.27
In this study, CSF1 R is involved in the regulation of cytokine-cytokine receptor interactions pathway, as demonstrated by KEGG analysis, which suggests that it might be involved in reprogramming and immune regulation of the tumor immune microenvironment. These results are consistent with previous results.28,29 A review by Katoh M showed that CSF1 R inhibitors could target mediators of immune escape within the tumor microenvironment; at the same time, combined immune checkpoint blockade (anti-CTLA and PD-1 monoclonal antibodies) might be a promising therapy in tumors, also indicating the role of this gene in the immune microenvironment.30 This observation was also confirmed by our results.
The HCST gene encodes a transmembrane signaling adaptor that forms part of the immune recognition receptor complex with the C-type lectin-like receptor NKG2D. This receptor complex may have a role in cell survival and proliferation by activation of NK and T cell responses, indicating that it may be involved in important immune response pathways. However, no report on the role of HCST in the immunotherapy of NSCLC was reported. Our results suggest that HCST is not only a new biomarker predicting the response to anti-PD-1 therapy but also might be involved in an important regulation of PDL1 pathway in NSCLC. And, the expression of PDL1 has been proved to be of great significance for immunotherapy in NSCLC. Hence, further research on HCST is crucial to find new treatment targets and improve individualized immunotherapy in NSCLC.
There are several limitations in this study. First, this study investigated human subjects and the efficacy of immunotherapy. Three data sets were retrieved from GEO. However, considering high-throughput sequencing, only one study was included in our analysis. Integration analysis is a shortcoming of our research. Second, the main purpose of this study was to analyze the predictive biomarkers of immunotherapy efficacy, so a functional study of the identified candidate genes was not carried out. However, to explore the possible pathways of the candidate genes, correlation analysis with PDL1 and CD8+ T cells in immune-related pathways was carried out. Third, in the TCGA database there was a lack of RNA sequencing data for immunotherapy and efficacy prediction and only related data on the genome mutation spectrum were found. Therefore, no TCGA analysis was conducted to verify our conclusion.
Conclusion
CSF1 R and HCST might be potential novel predictive markers for immunotherapy in NSCLC. Further research on these candidate genes might be beneficial to individualized immunotherapy in NSCLC, which is of great significance for precision immunotherapy in NSCLC.
Footnotes
Declaration of Conflicting Interests: The author(s) declared no potential conflicts of interest with respect to the research, authorship, and/or publication of this article.
Ethical Statement: Our data was obtained from Gene Expression Omnibus (GEO). Hence, ethical permission was unnecessary.
Funding: The author(s) received no financial support for the research, authorship, and/or publication of this article.
ORCID iD: Xiaoguang Qi  https://orcid.org/0000-0002-8148-3387
References
- 1. Romaszko AM, Doboszyńska A. Multiple primary lung cancer: a literature review. Adv Clin Exp Med 2018;27(5):725–730. [DOI] [PubMed] [Google Scholar]
- 2. Oudkerk M, Devaraj A, Vliegenthart R, et al. European position statement on lung cancer screening. Lancet Onco. 2017;18:e754–e766. [DOI] [PubMed] [Google Scholar]
- 3. Rizvi H, Sanchez-Vega F, La K, et al. Molecular determinants of response to Anti-Programmed Cell Death (PD)-1 and Anti-Programmed Death-Ligand 1 (PD-L1) Blockade in patients with non-small-cell lung cancer profiled with targeted next-generation sequencing. J Clin Oncol 2018;36(7):633–641. [DOI] [PMC free article] [PubMed] [Google Scholar]
- 4. Lorigan P, Eggermont AMM. Anti-PD1 treatment of advanced melanoma: development of criteria for a safe stop. Ann Oncol 2019; 30(7):1038–1040. [DOI] [PubMed] [Google Scholar]
- 5. Morse MA, Hochster H, Benson A. Perspectives on treatment of metastatic colorectal cancer with immune checkpoint inhibitor therapy. Oncologist 2020;25(1):33–45. [DOI] [PMC free article] [PubMed] [Google Scholar]
- 6. Haanen JB, Robert C. Immune checkpoint inhibitors. Prog Tumor Res 2015;42:55–66. [DOI] [PubMed] [Google Scholar]
- 7. Abril-Rodriguez G, Ribas A. SnapShot: immune checkpoint inhibitors. Cancer Cell 2017;31(6):848–848.el. [DOI] [PubMed] [Google Scholar]
- 8. Tanvetyanon T, Gray JE, Antonia SJ. PD-1 checkpoint blockade alone or combined PD-1 and CTLA-4 blockade as immunotherapy for lung cancer? Expert Opin Biol Ther 2017;17(3):305–312. [DOI] [PubMed] [Google Scholar]
- 9. Kim CG, Kim KH, Pyo KH, et al. Hyperprogressive disease during PD-1/PD-L1 blockade in patients with non-small-cell lung cancer. Ann Oncol 2019;30(7):1104–1113. [DOI] [PubMed] [Google Scholar]
- 10. Hellmann MD, Nathanson T, Rizvi H, et al. Genomic features of response to combination immunotherapy in patients with advanced non-small-cell lung cancer. version 2. Cancer Cell 2018;33(5):843–852. [DOI] [PMC free article] [PubMed] [Google Scholar]
- 11. Snyder A, Makarov V, Merghoub T, et al. Genetic basis for clinical response to CTLA-4 blockade in melanoma. N Engl J Med. 2015;317(23):2189–2199. [DOI] [PMC free article] [PubMed] [Google Scholar]
- 12. Rizvi NA, Hellmann MD, Snyder A, et al. Cancer immunology. Mutational landscape determines sensitivity to PD-1 blockade in non-small cell lung cancer. Science. 2015;348(6230):124–128. [DOI] [PMC free article] [PubMed] [Google Scholar]
- 13. Hellmann MD, Callahan MK, Awad MM, et al. Tumor mutational burden and efficacy of nivolumab monotherapy and in combination with Ipilimumab in small-cell lung cancer. Cancer Cell. 2018;33(5):853–861. [DOI] [PMC free article] [PubMed] [Google Scholar]
- 14. Cristescu R, Mogg R, Ayers M, et al. Pan-tumor genomic biomarkers for PD-1 checkpoint blockade-based immunotherapy. Science. 2018;362(641):eaar3593. [DOI] [PMC free article] [PubMed] [Google Scholar]
- 15. Long L, Zhao C, Ozarina M, Zhao X, Yang J, Chen H. Targeting immune checkpoints in lung cancer: current landscape and future prospects. Clin Drug Investig. 2019;39(4):341–353. [DOI] [PubMed] [Google Scholar]
- 16. Ferrer I, Zugazagoitia J, Herbertz S, John W, Paz-Ares L, Schmid-Bindert G. KRAS-Mutant non-small cell lung cancer: from biology to therapy. Lung Cancer. 2018;124:53–64. [DOI] [PubMed] [Google Scholar]
- 17. Lim C, Tsao MS, Le LW, et al. Biomarker testing and time to treatment decision in patients with advanced nonsmall-cell lung cancer. Ann Oncol. 2015;26:415–1421. [DOI] [PubMed] [Google Scholar]
- 18. Dong ZY, Zhong WZ, Zhang XC, et al. Potential predictive value of TP53 and KRAS mutation status for response to PD-1 blockade immunotherapy in lung adenocarcinoma. Clin Cancer Res. 2017;23(12):3012–3024. [DOI] [PubMed] [Google Scholar]
- 19. Biton J, Mansuet-Lupo A, Pécuchet N, et al. TP53, STK11, and EGFR mutations predict tumor immune profile and the response to Anti-PD-1 in lung adenocarcinoma. Clin Cancer Res. 2018;24(22):5710–5723. [DOI] [PubMed] [Google Scholar]
- 20. Hwang S, Kwon AY, Jeong JY, et al. Immune gene signatures for predicting durable clinical benefit of anti-PD-1 immunotherapy in patients with non-small cell lung cancer. Sci Rep. 2020;10(1):643. [DOI] [PMC free article] [PubMed] [Google Scholar]
- 21. Higgs BW, Morehouse CA, Streicher K, et al. Interferon gamma messenger RNA signature in tumor biopsies predicts outcomes in patients with non-small cell lung carcinoma or urothelial cancer treated with Durvalumab. Clin Cancer Res. 2018;24(16):3857–3866. [DOI] [PubMed] [Google Scholar]
- 22. Natarajan K, Jiang J, May NA, et al. The role of molecular flexibility in antigen presentation and T cell receptor-mediated signaling. Front Immunol. 2018;9:1657. [DOI] [PMC free article] [PubMed] [Google Scholar]
- 23. Wood SL, Pernemalm M, Crosbie PA, Whetton AD. The role of the tumor-microenvironment in lung cancer-metastasis and its relationship to potential therapeutic targets. Cancer Treat Rev. 2014;40(4):558–566. [DOI] [PubMed] [Google Scholar]
- 24. Altorki NK, Markowitz GJ, Gao D, et al. The lung microenvironment: an important regulator of tumour growth and metastasis. Nat Rev Cancer 2019;19(1):9–31. [DOI] [PMC free article] [PubMed] [Google Scholar]
- 25. Bonanno L, Zulato E, Pavan A, et al. LKB1 and tumor metabolism: the interplay of immune and angiogenic microenvironment in lung cancer. Int J Mol Sci. 2019;20(8):1874. [DOI] [PMC free article] [PubMed] [Google Scholar]
- 26. Wu L, Kang P, Tao S, et al. Genomic profiles and transcriptomic microenvironments in 2 patients with synchronous lung adenocarcinoma and lung squamous cell carcinoma: a case report. BMC Med Genomics. 2020;13(1):15. [DOI] [PMC free article] [PubMed] [Google Scholar]
- 27. Strachan DC, Ruffell B, Oei Y, et al. CSF1 R inhibition delays cervical and mammary tumor growth in murine models by attenuating the turnover of tumor-associated macrophages and enhancing infiltration by CD8+ T cells. Oncoimmunology. 2013;2(12):e26968. [DOI] [PMC free article] [PubMed] [Google Scholar]
- 28. Xu J, Escamilla J, Mok S, et al. CSF1 R signaling blockade stanches tumor-infiltrating myeloid cells and improves the efficacy of radiotherapy in prostate cancer. Cancer Res. 2013;73(9):2782–2794. [DOI] [PMC free article] [PubMed] [Google Scholar]
- 29. DeNardo DG, Brennan DJ, Rexhepaj E, et al. Leukocyte complexity predicts breast cancer survival and functionally regulates response to chemotherapy. Cancer Discov. 2011;1(1):54–67. [DOI] [PMC free article] [PubMed] [Google Scholar]
- 30. Katoh M. FGFR inhibitors: effects on cancer cells, tumor microenvironment and whole-body homeostasis (review). Int J Mol Med. 2016;38(1):3–15. [DOI] [PMC free article] [PubMed] [Google Scholar]


