

Abstract
The immune system is tightly regulated by the activity of stimulatory and inhibitory immune receptors. This immune homeostasis is usually disturbed during chronic viral infection. Using publicly available transcriptomic datasets, we conducted in silico analyses to evaluate the expression pattern of 38 selected immune inhibitory receptors (IRs) associated with different myeloid and lymphoid immune cells during coronavirus disease 2019 (COVID-19) infection. Our analyses revealed a pattern of overall upregulation of IR mRNA during severe acute respiratory syndrome coronavirus 2 (SARS-CoV-2) infection. A large number of IRs expressed on both lymphoid and myeloid cells were upregulated in nasopharyngeal swabs (NPSs), while lymphoid-associated IRs were specifically upregulated in autopsies, reflecting severe, terminal stage COVID-19 disease. Eight genes (BTLA, LAG3, FCGR2B, PDCD1, CEACAM1, CTLA4, CD72, and SIGLEC7), shared by NPSs and autopsies, were more expressed in autopsies and were directly correlated with viral levels. Single-cell data from blood and bronchoalveolar samples also reflected the observed association between IR upregulation and disease severity. Moreover, compared to SARS-CoV-1, influenza, and respiratory syncytial virus infections, the number and intensities of upregulated IRs were higher in SARS-CoV-2 infections. In conclusion, the immunopathology and severity of COVID-19 could be attributed to dysregulation of different immune inhibitors. Targeting one or more of these immune inhibitors could represent an effective therapeutic approach for the treatment of COVID-19 early and late immune dysregulations.
Keywords: SARS-CoV-2, COVID-19, immune inhibitory receptors, immune checkpoint inhibitors, CEACAM1, SIGLEC10, sialic acid, lung autopsies, respiratory viral infection, influenza A virus
Graphical Abstract
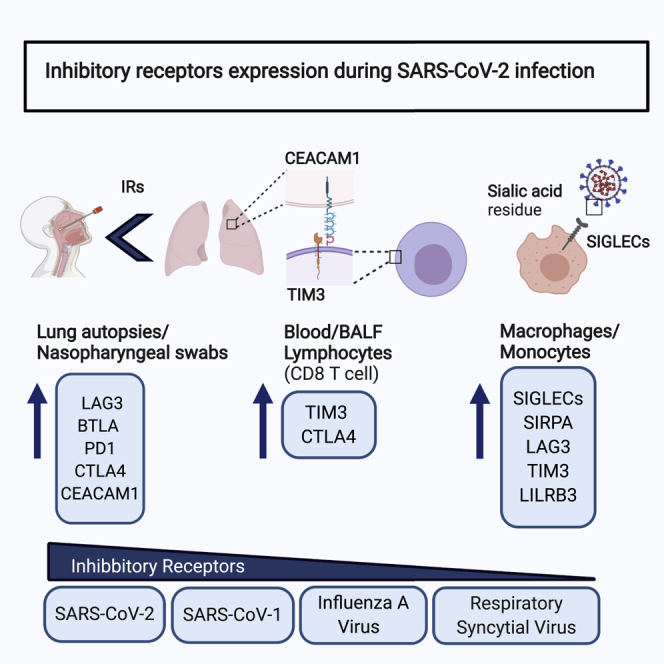
The immune system is tightly regulated by the activity of stimulatory and inhibitory immune receptors. Using gene expression datasets, Halwani and coworkers showed a pattern of overall upregulation of immune inhibitor receptors on different myeloid and lymphoid cells during SARS-CoV-2 infection. This dysregulation may contribute to the immunopathology and severity of COVID-19.
Introduction
Severe acute respiratory syndrome coronavirus 2 (SARS-CoV-2), the virus causing coronavirus disease 2019 (COVID-19), appeared first in Wuhan, China, in December 2019 and has since rapidly spread globally.1,2 The number of infected cases has exceeded 30 million, while more than 1 million people have already died from this pandemic.3 Global presentation of this infection varied with different individuals, different geographical regions, different sexes, age groups, and comorbidities, while its severity level ranged from asymptomatic infection to life-threatening disease.4, 5, 6, 7 Most patients were of an older age group (approximate age range of 30–79 years) and had mild symptoms, while 14% developed severe symptoms, and around 5% developed critical disease with a high mortality rate.8 Severe COVID-19 disease has been associated with delayed innate immune responses, early immunosuppression, lymphopenia, and cytokine storm.9, 10, 11, 12
Respiratory infections such as influenza often present with a median incubation period of 3–4 days, and the majority of intensive care admission occurs within 24–48 h of hospitalization.13 In the course of COVID-19 disease, the median viral incubation time is 5–7 days, and it requires an additional 3–4 days after hospitalization for disease progression and admission to an intensive care unit. The uncontrolled viral replication could mostly be driven by early immunosuppression and delayed immune responses.5,14
During COVID-19 infection, the early phase is characterized with a dysregulated innate immune response and upregulation of pro-inflammatory cytokines including interleukin (IL)-6 and IL-1B.15,16 Activation of antiviral type I interferon pathways were delayed or muted.10,17 This dysregulation of inflammation and delayed type I and III interferon production promoted further viral replication and infection, as well as quick viral dissemination from the upper respiratory tract to lower airways and other body organs.9,10
Various stimulatory and inhibitory receptors (IRs) tightly control immune cells activity and hence the immune response.18 The IRs have one or more immunoreceptor tyrosine-based inhibitory motifs (ITIMs) present in their cytoplasmic domains.19 IRs negatively regulate co-stimulatory and T cell receptor (TCR) signaling and adjust their activation threshold.20,21 They are also involved in non- immunoreceptor tyrosine-based activation motif (ITAM)-dependent downstream signaling, including the Toll-like receptors and cytokine signaling.
Lymphoid IRs such as programmed cell death protein 1 (PD-1) and cytotoxic T lymphocyte-associated protein 4 (CTLA4) have been extensively studied and targeted in the context of the tumor microenvironment and chronic viral infections.22 Common myeloid associated IRs, however, have been investigated more in the context of bacterial infection. These IRs include sialic acid-binding immunoglobulin-type lectins (SIGLECs),23 signal regulatory protein alpha (SIRPA), and the leukocyte immunoglobulin-like receptor subfamily B (LILRB). During regular immune responses, activation of immune cells triggers a parallel upregulation of inhibitory immune receptors as a feedback mechanism to prevent immune overactivation.24
Through effective viral evasion mechanisms, pathogen such as SARS-CoV-2 may escape the immune surveillance, resulting in long-term infection. Persistent exposure to virus and chronic antigen presentation to immune cells result in the exhaustion of immune cells, leading to the suppression of their effector functions and proliferative potential.25 During chronic infections, such as HIV and hepatitis B virus (HBV), IRs are upregulated, leading to a state of cellular deactivation or exhaustion, both of which result in delayed viral clearance and exaggerate infections.26 Likewise, SARS-CoV-2 infection may result in immunosuppression and dysregulation of inflammatory cells through upregulation of inhibitory immune receptors, leading to the observed delayed interferon response and inefficient viral clearance.
Recently, several studies have reported a decrease in the level of T cell, B cell, and natural killer (NK) cells during COVID-19 infection, with enhanced suppression of these cells relative to disease severity.11,12,27,28 Although the concept of immune exhaustion had been studied in cancer and chronic viral infection,22,24 its relevance to COVID-19 respiratory infection deserves more attention and could potentially provide avenues for effective therapeutic targets.
Results
Higher expression of immune IR genes in lung autopsies compared to nasopharyngeal swabs
Using publicly available transcriptomic datasets, we have determined the association between the expression of 38 immune inhibitors, known to be expressed on lymphoid and myeloid lineages, and COVID-19 severity (Table 1). The datasets used in this study are presented in Table 2. Expression levels of IRs were determined in nasopharyngeal swabs (NPSs) and lung autopsies (Figure 1). For NPSs, RNA sequencing (RNA-seq) data were obtained from 430 PCR-confirmed COVID-19 patients and 54 negative controls (GEO: GSE152075). For lung autopsies, RNA-seq data were extracted from 16 lung autopsies derived from five COVID-19 patients and five controls as presented in Figure 1B (GEO: GSE150316). Here, lung autopsies represented a late severe stage of COVID-19 infection. In NPSs, 31 IRs, known to be expressed on both cell lineages, were upregulated (Figure 1A). However, out of 38 IRs, only nine genes were upregulated in lung autopsies, and were mainly expressed on lymphoid immune cells (Figure 1B). Interestingly, eight out of the nine upregulated IRs were shared between lung autopsies and NPSs (BTLA, lymphocyte activation gene-3 [LAG3], FCGR2B, PDCD1, CEACAM1, CTLA4, CD72, and SIGLEC7). Out of the eight common IRs, seven genes (BTLA, LAG3, FCGR2B, PDCD1, CTLA4, CD72, and SIGLEC7) were more expressed in autopsies compared to NPSs (Figure 1C). We also looked at the immune activation markers comprised of two T cells (CD25 and CD69) and two macrophage markers (CD86 and HLA-DRA). All four immune activation markers were upregulated in the NPSs (Figure S1A).
Table 1.
List of immune inhibitory receptors
| Inhibitory receptor gene | Full name | Predominant cell distribution | References |
|---|---|---|---|
| LAG3 (CD223) | lymphocyte-activation gene 3 | T cells, B cells, NK cells, and DCs | 22,29,30 |
| TIGIT | T cell immunoreceptor with Ig and ITIM domains | T cells, NK cells | 31,32 |
| HAVCR2 (TIM3) | hepatitis A virus cellular receptor 2 or T cell immunoglobulin and mucin-domain containing-3 (TIM3) | NK cells, T cells, monocytes, macrophages | 33 |
| CD160 | cluster of differentiation 160 | NK cells, T cells, and myeloid cells | 22,34 |
| BTLA | B and T lymphocyte associated | B cells, T cells, and DCs | 35,36 |
| CD244 (2B4) | cluster of differentiation 244 | NK cells and T cells | 22 |
| FCGR2B (FcγRIIB, CD32B) | Fc fragment of IgG receptor IIb | B cells, basophils, monocytes, macrophages, neutrophils, mast cells | 37,38 |
| CTLA4 | cytotoxic T lymphocyte-associated protein 4 | T cells | 22,39 |
| PDCD1 (PD-1) | programmed cell death 1 | T cells, B cells, NK cells | 22,40,41 |
| PILRA (PILRα, FDF03) | paired immunoglobulin-like type 2 receptor alpha | monocytes, macrophages, neutrophils | 42,43 |
| CD72 | cluster of differentiation 72 | B cells | 44 |
| CD5 | cluster of differentiation 5 | T cells, subset B | 45 |
| PECAM1 (CD31) | platelet and endothelial cell adhesion molecule 1 | monocytes, macrophages, neutrophils, endothelial cells, subset T cells and B cells | 46,47 |
| CD22 (Siglec2) | cluster of differentiation 22 | B cells | 48,49 |
| CEACAM1 (CD66a) | carcinoembryonic antigen-related cell adhesion molecule 1 | monocytes, macrophages, granulocytes, T cells, subset, NK cells, B cells, epithelial cells | 50 |
| CD33 (Siglec3) | cluster of differentiation 33 | monocytes, macrophages | 51,52 |
| LAIR1 | leukocyte-associated immunoglobulin-like receptor 1 | T cells, B cells, neutrophils, monocytes | 53, 54, 55 |
| KLRC1 (NKG2A) | killer cell lectin like receptor C1 | NK cells, CD8+ T cells | 56, 57, 58 |
| KIR2DL1 | killer cell immunoglobulin-like receptor, two Ig domains and long cytoplasmic tail 1 | NK cells, T cells | 21,56 |
| KIR3DL1 | killer cell immunoglobulin-like receptor, three Ig domains and long cytoplasmic tail 1 | NK cells, T cells | 21,56 |
| SIRPA (SIRPα) | signal regulatory protein alpha | monocytes, macrophages | 59, 60, 61 |
| CD200R1 | cluster of differentiation 200r1 | neutrophils, monocytes, macrophages | 62,63 |
| CD300A (IRp60) | cluster of differentiation 300a | monocytes, neutrophils, mast cells, and some T and B cells | 64,65 |
| CD300LF (IREM-1) | cluster of differentiation 300lf | monocytes, macrophages, neutrophils, mast cells, and some T cells and B cells | 66,67 |
| LILRB1 (ILT-2) | leukocyte immunoglobulin-like receptor B1 | neutrophils, monocytes, macrophages, DCs, and NK cells | 68, 69, 70 |
| LILRB4 (ILT-3) | leukocyte immunoglobulin-like receptor B4 | neutrophils, monocytes, macrophages, and DCs | 71,72 |
| LILRB2 (ILT-4) | leukocyte immunoglobulin-like receptor B2 | neutrophils, monocytes | 70,73 |
| LILRB3 (ILT-5) | leukocyte immunoglobulin-like receptor B3 | neutrophils, monocytes, macrophages | 74, 75, 76 |
| LILRB5 (ILT2, 3, 4, 5; LIR8) | leukocyte-associated immunoglobulin-like receptor 5 | neutrophils, monocytes | 21,77 |
| VSTM1 (SIRL-1) | V-set and transmembrane domain containing 1 | neutrophils, monocytes | 78 |
| SIGLEC5 | sialic acid binding Ig-like lectin 5 | neutrophils, monocytes | 79,80 |
| SIGLEC6 | sialic acid binding Ig-like lectin 6 | B cells, cytotrophoblasts | 81 |
| SIGLEC7 | sialic acid binding Ig-like lectin 7 | NK cells, monocytes, granulocytes, mast cells, basophils | 21,82,83 |
| SIGLEC9 | sialic acid binding Ig-like lectin 9 | neutrophils, monocytes | 82 |
| SIGLEC10 | sialic acid binding Ig-like lectin 10 | monocytes | 84 |
| SIGLEC11 | sialic acid binding Ig-like lectin 11 | macrophages | 85 |
| CLEC4A (DCIR) | C-type lectin domain family 4 member A | neutrophils, eosinophils, monocytes, macrophages, DCs, B cells | 86 |
| CLEC12A (MICL) | C-type lectin domain family 12 member | neutrophils, eosinophils, monocytes, macrophages, DCs | 87 |
DC, dendritic cell; Ig, immunoglobulin.
Table 2.
Gene expression datasets used in this study
| GEO Accession No. | Platform | Sample | Condition 1 | Condition 2 |
|---|---|---|---|---|
| Microarray data | ||||
| GSE1739119 | GPL201 | PBMCs | controls (n = 4) | SARS-CoV-1 (n = 10) |
| GSE17156118 | GPL571 | PBMCs | controls (n = 17) | influenza H3N2 (n = 17) |
| GSE17156118 | GPL571 | PBMCs | controls (n = 20) | respiratory syncytial virus (n = 20) |
| RNA-seq data | ||||
| GSE150316 | GPL18573 | lung autopsies | controls (n = 5) | lung autopsies (n = 16) |
| GSE15207588 | GPL18573 | nasopharyngeal swabs | negative controls (n = 54) | COVID-19 (n = 430) |
| EGAS00001004503117 | GPL24676 | whole blood | controls (n = 10) | COVID-19 (n = 39) |
| Single-cell RNA-seq data | ||||
| GSE14592612 | GPL23227 | bronchoalveolar lavage fluid | healthy (n = 6) | moderate (n = 3) and severe (n = 6) COVID-19 |
| GSE14968911 | GPL24676 | PBMCs | healthy (n = 4) | severe influenza (n = 5), severe COVID-19 (n = 4), and mild COVID-19 (n = 4) |
SARS-CoV, severe acute respiratory syndrome coronavirus.
Figure 1.

Gene expression of immune inhibitory receptors in nasopharyngeal swabs and lung autopsies of COVID-19 patients
(A) Enhanced expression of 31 immune inhibitory receptors known to be associated with lymphoid and myeloid immune cells in nasopharyngeal swabs (n = 431 COVID-19 versus n = 54 controls, GEO: GSE152075). (B) Upregulation of nine immune inhibitors associated mostly with lymphoid immune cells in lung autopsies (n = 16 COVID-19 versus n = 5 control lung autopsies, GEO: GSE150316). (C) Genes that are shared between nasopharyngeal swabs and lung autopsies. Seven of the eight genes were more expressed in lung autopsies compared to swabs. Results are presented as fold change of gene expression between cases and controls.
The expression of immune IRs is regulated by SARS-CoV-2 viral levels
The expression of IRs is known to be enhanced upon persistent exposure to viral antigens. To investigate that in the context of SARS-CoV-2, we associated the expression of these receptors with the expression of SARS-CoV-2 N viral protein. COVID-19 infection was confirmed by quantitative PCR for the SARS-CoV-2 N protein.88 We have associated the expression of the eight common IRs between autopsies and NPSs with SARS-CoV-2 N reported viral protein levels. As expected, higher viral level was associated with higher expression of immune IRs (Figure 2).
Figure 2.

Association between SARS-CoV-2 viral levels and gene expression of immune inhibitory receptors
Gene expression of immune inhibitory receptors was positively correlated with viral load as shown in (A)–(H) (n = 431 COVID-19 versus n = 54 controls, GEO: GSE152075). An unpaired Student’s t test was used to compare between the independent groups (mRNA expression between different viral load groups). Results are presented as mean (±SEM) of mRNA expression. ∗p < 0.05, ∗∗p < 0.01, ∗∗∗p < 0.001, ∗∗∗∗p < 0.0001.
Upregulation of IRs on lung inflammatory cells during COVID-19 infection
After establishing an overall upregulation of IRs in autopsies of COVID-19 patients, we next determined whether the observed increase in IRs is reflected on the main inflammatory cells regulating COVID-19 severity. Single-cell datasets of monocytes/macrophages and CD8+ cells isolated from bronchoalveolar fluid (BALF) (GEO: GSE145926) and peripheral blood mononuclear cells (PBMCs) (GEO: GSE149689) of COVID-19 severe patients were used.11,12 Overall, the number of upregulated IRs and their level of expression were higher in BALF-isolated inflammatory cells compared to PBMCs. In the first study using BALF samples, macrophages were clustered into M1-like and M2-like macrophages. Both M1 and M2 macrophages were higher in severe compared to moderate COVID-19 patients and healthy donors.12 Immune IRs were expressed by both macrophage subsets as shown in Figure 3A. Furthermore, specific upregulation of KLRC1, CD244 (2B4), and PECAM was observed in BALF CD8+ T cells isolated from moderate COVID-19 patients, while CTLA4, HAVCR2 (TIM3), and TIGIT were upregulated in CD8+ T cells of severe COVID-19 patients (Figure 3B).
Figure 3.

Single-cell expression of bronchoalveolar lavage and PBMC immune cells in patients with COVID-19
(A) and (B) present the bronchoalveolar lavage data (GEO: GSE145926), while (C) and (D) present the data from PBMCs (GEO: GSE149689). Single-cell RNA sequencing was performed on bronchoalveolar lavage fluid (BALF) from 6 severe and 3 moderate COVID-19 patients and 3 healthy controls, and on PBMCs from 5 flu patients, 11 COVID-19 patients, and 4 healthy controls. (A) Expression of immune inhibitors in M1- and M2-like macrophage groups, which are enriched in severe COVID-19 patients. Fold changes were generated for each group of macrophages relative to total macrophages. (B) Specific upregulation of KLRC1, CD244 (2B4), and PECAM in moderate CD8+ T cells, while CTLA4, HAVCR2 (TIM3), and TIGIT were enhanced in CD8+ T cells from severe COVID-19 patients. The fold change compares expression of IRs in CD8+ T cells between moderate and severe groups. (C) Differential expression of IRs on monocytes during severe and mild course of COVID-19 disease within the same patients (n = 1, GEO: GSE149689). (D) Upregulation of HAVCR2 (TIM3) and CTLA4 in COVID-19-specific CD8+ T cell cluster. None of the immune inhibitors appeared in IAV-specific clusters.
Lung autopsies presented in Figure 1B included upregulation of LAG3 and CD72 that were also upregulated in BALF macrophages. Additionally, CTLA4 was upregulated in both lung autopsy and BALF CD8+ T cells. We then determined the differential expression of IRs on PBMCs of COVID-19 patients during different stages of the disease using single-cell data (GEO: GSE149689).11 On monocytes, the expression of LILRB1 was increased during the mild stage of the disease, while two immune inhibitors, CLECLT12A and PILRA, were upregulated during the severe stage (Figure 3C). Interestingly, LILRB1 was upregulated on macrophages of BALFs and monocytes of PBMCs, but its expression was 3-fold higher in lung compared to blood (Figures 3A and 3C). Furthermore, CTLA4 and HAVCR2 (TIM3) expression levels were higher in CD8+ cells of BALFs compared to CD8+ cells of PBMCs (Figures 3B and 3D). In this same study (GEO: GSE149689), the levels of expression of IRs on PBMCs from COVID-19 to those of influenza A virus (IAV)-infected patients were compared. Interestingly, the expression of IRs was not increased in IAV-specific groups, while two of the receptors (CTLA4 and HAVCR2) were significantly upregulated in the COVID-19-specific population. Next, we used the BALF study (GEO: GSE145926) to determine the expression of two T cell activation markers (CD25 and CD69) and two macrophage activation markers (histocompatibility leukocyte antigen [HLA]-DRA and CD86). Interestingly, T cell activation markers were not upregulated in CD8+ T cells isolated from BALF. Furthermore, HLA-DRA was not upregulated, while CD86 was slightly upregulated in the M2-like macrophage cluster enriched more in BALF from severe COVID-19 patients (Figure S2).
Prominent IR upregulation in SARS-CoV-2 infection relative to other viral infections, with SIGLECs identified as COVID-19-specific IR markers
To compare the profile of IR upregulation during SARS-CoV-2 relative to other respiratory viral infection, we used transcriptomic microarrays and RNA-seq data from PBMCs of SARS-CoV-1-, IAV-, and respiratory syncytial virus (RSV)-infected patients at the peak of disease. For each condition, differential expression and fold change were obtained by comparing the normalized gene expression of the infected group versus healthy donors (Figure 4A). We then intersected the differentially expressed genes in all four respiratory infections to obtain the shared signatures (Figure 4B). Overall, we observed the appearance of either myeloid-specific IRs or receptors such as CEACAM1 and LAIR1 that are expressed broadly in both myeloid and lymphoid immune cells. The result of this analysis revealed that in SARS-CoV-2, the number of immune receptors and the extent of upregulation were higher compared to those other groups (Figures 4A–4C). One gene, CEACAM1, was upregulated in all four infections (Figure 4B); however, its expression was higher in SARS-CoV-2 compared to SARS-CoV-1, IAV, and RSV (Figure 4C). Two genes (SIRPA and LILRB2) were upregulated only during SARS infections, but their expression was higher in SARS-CoV-2. Similarly, LILRB4 was upregulated during both SARS-CoV-2 and IAV infections, but its expression was higher during SARS-CoV-2 compared to IAV (fold change of 1.47 versus 0.74). Six genes, that is, LILRB3, LILRB5, SIGLEC5, SIGLEC9, SIGLEC11, and CLEC12A, were specifically upregulated during SARS-CoV-2 infection (Figure 4B) and were hence COVID-19-specific. Next, we looked at the PBMC expression levels of immune stimulatory genes (CD25, CD69, HLA-DRA, and CD86) during different respiratory infections. Compared to other infections, SARS-CoV-2 has a significant decrease in CD25 and HLA-DRA, while other respiratory infections induced upregulation of these receptors (Figure S3).
Figure 4.

Expression of IRs during COVID-19 and other viral infections
The number and intensity of IR upregulation is higher during COVID-19 compared to other respiratory viral infection. (A) Upregulation of immune inhibitory genes during different respiratory infections. The difference in gene expression of IRs of case and controls is provided as fold change. (B) Intersection of upregulated immune inhibitory signatures in four different respiratory viral infections (IAV, RSV, SARS-CoV-1, and SARS-CoV-2). (C) Expression of CEACAM1 gene shared between all viral groups. The following datasets were used; GEO: GSE17156 (n = 17 IAV versus n = 17 controls), GEO: GSE17156 (n = 20 RSV versus n = 20 controls), GEO: GSE1739 (n = 10 SARS-CoV-1 versus n = 4 controls), and EGAS00001004503 (n = 39 COVID-19 versus n = 10 controls). For all analyses, p < 0.05 was considered significant. IAV, influenza A virus; RSV, respiratory syncytial virus.
Discussion
In this study, we used in silico transcriptomic datasets of NPSs, lung autopsies, BALF, and blood from SARS-CoV-2-infected individuals to explore the expression of various immune IRs during COVID-19 viral infection. Thirty-eight immune IRs that were reported to be commonly expressed in different lymphoid and myeloid immune cells were tested. Analyses of COVID-19 whole transcriptomic data revealed an upregulation of a wide range of IRs in the upper airways, while a more selective increase of lymphoid IRs was observed in lung autopsies. The observed increase in the IR levels in NPSs could mostly be due to a normal negative feedback mechanism to immune activation,21,89 and hence these levels are expected to go back to normal following control of viral replication. However, the significantly higher levels of lymphoid IRs in lung tissue, compared to upper airways, could mostly be due to prolonged exposure to viral antigens (Figure 1).22
Although compared to lung autopsies NPSs had a higher number of upregulated IRs, the intensity of seven out of eight shared signatures were higher in lung autopsies. Further analyses of NPS data revealed an expected direct association between expression levels of IRs and SARS-CoV-2 viral load. This could possibly explain the enhanced expression of the lymphoid IRs observed in lung autopsies. The upregulation of IRs could also be an outcome of inflammation, viral persistence, and drug use. Anti-inflammatory medication such as glucocorticoid suppresses immune cells, resulting in impaired viral clearance, which could further enhance expression of IRs.18,90
Beside the IRs, we also examined the expression levels of T cell (CD25 and CD69) and macrophage (CD86 and HLA-DRA) activation markers. All four immune activation markers were upregulated in the NPSs. The observed upregulation of the immune IRs could hence be due to a feedback mechanism to suppress the immune response, although a SARS-CoV-2 evasion mechanism regulating that should not be excluded. Interestingly, T cell activation markers were not upregulated in CD8+ T cells isolated from BALF. This may indicate that these cells could be leaning more toward an exhaustion state. Furthermore, HLA-DRA was not upregulated, while the expression of CD86 was slightly enhanced in the M2-like macrophage cluster, enriched during severe COVID-19 infection. This inactivation of the M1 and M2 macrophage subsets during severe disease could also be the result of treatment with extensive immune-suppressive medications.
CEACAM-1 expression was noticeably increased in samples from NPSs, autopsies, and blood of COVID-19 patients. This receptor is expressed on a wide range of cells comprising epithelial, myeloid, lymphoid, and tumor cells. It binds to receptors within the CEACAM family, to other immune receptors such as the NKGD2 stimulatory receptor expressed on NK cells,91 or to TIM3 receptors expressed mostly on CD8+ T cells. Infection of lung epithelial cells with the pathogenic H5N1 strain enhanced the expression of CEACAM1 to a much higher level compared to infection with the H1N1 strain. Silencing of CEACAM1 in epithelial cells, however, was associated with reduction in viral replication.92 Likewise, in our results, CEACAM1 was the single signature upregulated in all viral respiratory infections. Interestingly, its expression level mirrored the pathogenicity of the associated viral infections, with the highest levels observed during SARS-CoV-2, followed by SARS-CoV-1, IAV, and RSV. Treatment of exhausted T cells with anti-hCEACAM1 antibody restored their effector activity. This suggest that during chronic infection, CEACAM1 overexpression in CD8+ T cells could exert inhibitory effect through acting as a ligand for TIM3 IRs.93
Little is known about the expression of IRs in immune cells other than T cells and NK cells. In this study, we show an increase in myeloid-related signatures, particularly in NPSs, PBMCs, and BALF cells. The overexpression of IRs could, at least partially, explain the delayed innate immune response and muted type I and III interferon signaling during SARS-CoV-2 infection.68,73,94,95 A large number of IRs were upregulated on BALF macrophages compared to blood monocytes (Figure 3). This includes LILRBs, SIGLECs, and SIRPA. LILRB1 was shared between both cell types but was 3-fold higher in BALF compared to blood. This could reflect the expected higher viral levels in BALF compared to blood. In fact, LILRBs were also broadly upregulated in NPSs and whole blood cells. Interestingly, dengue virus, an RNA virus, opposed the FcγR-dependent expression of type I interferon in macrophages and dendritic cells by activating the LILRB1.96 Moreover, RNA viruses induced SIGLEC10 (or SIGLEC-G in mice) and inhibited innate immune responses by promoting RIG-1 degradation.97 Therefore, the enhanced expression of LILRBs and SIGLEC10, observed in NPSs and BALF macrophages, could contribute to the delayed interferon production and the resulting viral persistence.
The myeloid SIRPA IR was also upregulated in NPSs, BALF macrophages, and blood cells. Among other viral infections, only SARS-CoV-1 also induced the expression of this receptor. SIRPA induction decreases macrophage phagocytic activity and cytokine secretion in an IRF3-dependent manner.98, 99, 100 Moreover, hepatitis E virus protein ORF3 was shown to activate SIRPA expression, which in turn suppressed both IRF3 phosphorylation and type I IFN production.101 Blockade of SIRPA restored phagocytosis in monocytes of critically ill patients.102 This suggests that SIRPA could constitute a potential treatment target for severe respiratory infections such as COVID-19.
Blood expression levels of these myeloid-associated inhibitors were also enhanced following infections with SARS-CoV1, IAV, and RSV (Figure 4). Interestingly, the number and intensity of upregulated IRs were higher in blood following SARS-CoV-2 infection compared to other viral infections. Upregulation of SIGLEC IRs, that is, SIGLEC5, SIGLEC9, and SIGLEC11, was specific to SARS-CoV-2 infection, hinting at a distinct interaction between this virus and immune cells. Glycosylation mappings have revealed that unlike SARS-CoV-1, SARS-CoV-2 has a sialic acid residue in its spike glycans.103 Sialic acid recognizes CD33-related SIGLECs (hCD33rSiglecs), including SIGLEC3 and SIGLEC5–SIGLEC11, and it has intracellular domains with an inhibitory ITIM or ITIM-like motif. Further investigations are needed to determine how the increase in expression of these myeloid IRs could affect the course of SARS-CoV-2 viral infection.
The increase in lymphoid immune IRs may contribute to the observed lymphopenia and delayed immune response.24,104, 105, 106 The upregulation of PD-1, CTLA4, BTLA, and LAG3 IRs observed in autopsies was also reflected in macrophages and CD8+ T cells, the main inflammatory cells isolated from BALF of severe COVID-19 patients. LAG3 is an immune checkpoint receptor expressed on T cells. Major histocompatibility complex (MHC) class II is its main ligand to which it binds with high affinity.107 Similar to CTLA4 and PD-1, LAG3 negatively regulates cellular proliferation, activation, and homeostasis of T cells.108, 109, 110 However, LAG3 is also considered as an activation marker.111 It is upregulated transiently during both CD4 and CD8 T cell activation, reaching the peak expression level at 48 h post-infection.111 Therefore, the observed upregulation of LAG3 in NPSs could be a negative feedback mechanism in response to immune activation, while its enhanced expression in lung autopsies and macrophages could most likely be due to terminal differentiation of these cells. Understanding the mechanism regulating these receptors, however, requires further investigation.
Interestingly, the number and intensities of lymphoid IRs expressed on viral-specific CD8 T cells were higher during COVID-19 disease than other respiratory infections. TIM3 and CTLA4 were significantly upregulated in COVID-19-specific, but not influenza-specific, CD8+ T cell (Figure 3D). This may explain the inefficient control of viral replication during late stages of the disease. It also suggests that the enhanced expression of lymphoid IRs observed in lung autopsies could in part be attributed to the infiltrated T cells.
The enhanced expression of myeloid and lymphoid IRs could also be induced directly by SARS-CoV-2 virus as an evasion mechanism. Epigenetic modulation of immune regulatory genes has been reported for other viral infections,112 and may constitute a mechanism of SARS-CoV-2 immune evasion. Collective activation of these IRs could suppress innate and adaptive immune responses, resulting in a defect in viral clearance. Prolonged inflammation and viral antigen presentation results in T cell exhaustion, which may shift the disease toward the refractory phase.
Currently, three immune checkpoint inhibitors are approved for treating different malignancies: CTLA4 (ipilimumab), PD-1 (pembrolizumab, nivolumab, cemiplimab), and programmed cell death protein ligand-1 (PD-L1) (durvalumab, atezolizumab, avelumab) inhibitors.113 Less evidence is available about the safety and effectiveness of these inhibitors for the treatment of infectious disorders. Blocking LAG-3 and PD-1, which were upregulated during lymphocytic choriomeningitis virus (LCMV) infection, synergistically improved T cell immune response and decreased viral load.22 In addition, in two clinical trials of HIV-infected patients, inhibition of CTLA4 (ipilimumab)114 and PD-1 (nivolumab)115 enhanced HIV-specific immunity. At present, there are no clinical data on the use of checkpoint inhibitors for respiratory viral infections. However, treatment with anti-PD-1 antibodies was shown to suppress the elevated PD-1 high immune cells in the lungs of IAV-infected mice.116 Given that, reversing the activity one or more of these immune inhibitors during the early and late phase of SARS-CoV-2 infection may constitute an effective therapeutic approach for the treatment of COVID-19 viral infection.
Our study is limited in the fact that it is based on transcriptomic data and mRNA levels of IRs and thus may or may not reflect changes in protein expression. Therefore, confirmatory experiments are needed to support our findings. Publicly available datasets have limited clinical information as well, which limited our ability to normalize for confounders. In addition, the clinical relevance of the observed differential gene expression levels requires further studies to confirm.
Materials and methods
For the purpose of this study we first established a list of 38 immune IRs that are known to be expressed in different innate and adaptive immune cells (Table 1). The receptors were broadly classified into myeloid (monocytes, macrophages, granulocytes, and dendritic cells) and lymphocyte (B cells, T cells, and NK cells) IRs, depending on the cell type on which they are mostly expressed. The expression of these receptors in the lungs and whole blood of COVID-19 patients was then determined in silico using publicly available datasets. Transcriptomic and single-cell datasets of NPSs, BALF (sorted macrophages and CD8 T cells), lung autopsies, and whole blood of COVID-19 patients with different disease severity were used (Table 2). These datasets were publicly available at the National Center for Biotechnology Information Gene Expression Omnibus (NCIB GEO, https://www.ncbi.nlm.nih.gov/geo) and the European Bioinformatics Institute (EMBL-EBI, https://www.ebi.ac.uk). Moreover, the expression of IRs on PBMCs following COVID-19 infection was compared to that following infection with three respiratory viruses: SARS-CoV-1, IAV, and RSV. In addition, the levels of two T cell (CD25 and CD69) and two macrophage immune activation markers (CD86 and HLA-DRA) were assessed within the same tissues.
RNA-seq platforms were used for COVID-19 studies, while microarray platforms were used for older datasets of SARS-CoV-1, IAV, and RSV (Table 2). For the COVID-19 lung autopsies dataset (GEO: GSE150316), the authors have extracted RNA from formalin-fixed, paraffin-embedded (FFPE) tissues devoid of inflammation area. A total of 16 lung autopsies were obtained from five diseased COVID-19 patients, and 5 lung autopsies from five healthy controls. For the NPSs dataset (GEO: GSE152075), Lieberman et al.88 extracted the total RNA from 3 mL of swab transport medium and then performed whole transcriptomic analysis. Quantitative PCR for the SARS-CoV2 N protein was also performed. Based on the threshold cycle (Ct) cutoff provided by the authors, we grouped COVID-19 patients into high (N Ct < 19), middle (N Ct 19–24), and low (N Ct > 24) viral load. For the COVID-19 whole-blood transcriptomic dataset, we used processed sequencing data deposited under project number EGAS00001004503.117 In this study, Aschenbrenner et al.117 extracted the RNA from whole blood of 39 COVID-19 patients and 10 healthy controls and analyzed it using NovaSeq 6000.
Transcriptomic datasets of PBMCs isolated from RSV- and IAV-infected patients (GEO: GSE17156)118 and from SARS-CoV-1-infected patients (GEO: GSE17156)119 were analyzed. In both studies, PBMCs were obtained during the peak of patients’ symptoms and processed by the authors for RNA extraction and hybridization following the Affymetrix protocol. After a quality check, we normalized and log transformed the raw Affymetrix data. Microarray data (CEL files) were pre-processed in our study with the robust multi-array average (RMA) technique using R software.120 The probe set with the largest interquartile range (IQR) of expression values were selected to represent the gene. For RNA-seq studies, we processed the data using the Bioconductor package limma-voom121 and presented the results as log2 counts per million (log CPM). Log-transformed normalized intensities were also used in linear models for microarray data (limma) analyses to identify differentially expressed genes between diseased and control groups.
Raw data from different studies were never mixed or combined. For each study, the fold change was obtained separately by analyzing data of diseased and controls. An unpaired Student’s t test122 was used to compare between the independent groups. Statistical analyses were performed using R software (v3.0.2) and Prism (v8; GraphPad). For all analyses, p values <0.05 were considered significant.
Single-cell RNA sequencing datasets were obtained from two studies. The first was performed by Lee et al.11 on PBMCs from five flu patients, eight COVID-19 patients, and four healthy controls, and the second was performed by Liao et al.12 on BALF from six severe COVID-19 patients, three moderate COVID-19 patients, and three healthy controls. The details of sample isolation, sequencing, and data processing are available at NCBI GEO, and the studies protocols have been published.11,12 Briefly, PBMCs (GEO: GSE149689) were isolated from blood via standard Ficoll-Paque density gradient centrifugation. Single-cell RNA-seq libraries were generated by the investigators using the Chromium Single Cell 3′ Library & Gel Bead Kit v3 (10x Genomics, Pleasanton, CA, USA). Libraries were constructed and sequenced on the NovaSeq 6000 platform (Illumina, San Diego, CA, USA). The investigators then compared the differential gene expression of monocytes at early and late stages of the disease. They also clustered CD8+ T cells into different groups using a Seurat graph-based algorithm. They identified the COVID-19- or IAV-specific CD8+ T cluster based on its gene enrichment profile. We have compared the differential expression of the IRs between these two groups. For the BALF study (GEO: GSE145926), the investigators passed the samples through a 100-μm nylon strainer, the supernatant was centrifuged, and the cells were re-suspended in cooled RPMI 1640 complete medium. Similarly, single-cell RNA-seq libraries were generated using the Chromium Single Cell 5′ Library & Gel Bead Kit v3 (10x Genomics ). Samples were sequenced on a BGI MGISEQ-2000 or Illumina platform. CellRanger (10x Genomics ) was used to generate fastq files from the sequenced data, and the reads were aligned to the human reference genome (GRCh38; 10x CellRanger reference GRCh38 v3.0.0). Further filtering and normalization were performed using the Seurat R package.123 The investigators then used the model-based analysis of single-cell transcriptomics (MAST) algorithm in Seurat v3 to identify differentially expressed genes (DEGs) and to determine the fold changes. The investigators clustered macrophages into four groups based on the expression of the differentiation markers. Group one and two represented M1-like macrophages, while group three represented M2-like macrophages. Fold changes were generated for each group of macrophages relative to the total macrophage population. In addition, the differential gene expression of CD8+ T cells was compared between moderate and severe groups.
Acknowledgments
This work was supported by a Tissue Injury and Repair Group (TIR Group) operational grant (code 150317), COVID-19 research grants (CoV19-0307 and CoV19-0308), and a seed grant (code 2001090275); by a collaborative research grant (code 2001090278) to R.H., University of Sharjah, UAE; by a Sandooq Al Watan Applied Research & Development Grant to R.H. (SWARD-S20-007); by an Al Jalila Foundation Seed Grant (AJF202019); and by the Prince Abdullah Ben Khalid Celiac Disease Research Chair, under the Vice Deanship of Research Chairs, King Saud University, Riyadh, Kingdom of Saudi Arabia.
Author contributions
R.H., Q.H., N.S.S.-A., F.S.S.-A, H.S.A., and S.A.H. conceived and designed the experiments. N.S.S.-A., F.S.S.-A., R.H., and B.M. analyzed the data. All authors contributed to writing and revision of the manuscript.
Declaration of interests
The authors declare no competing interests.
Footnotes
Supplemental Information can be found online at https://doi.org/10.1016/j.omtm.2020.11.002.
Supplemental information
References
- 1.Wu F., Zhao S., Yu B., Chen Y.-M., Wang W., Song Z.-G., Hu Y., Tao Z.-W., Tian J.-H., Pei Y.-Y. A new coronavirus associated with human respiratory disease in China. Nature. 2020;579:265–269. doi: 10.1038/s41586-020-2008-3. [DOI] [PMC free article] [PubMed] [Google Scholar]
- 2.Zhu N., Zhang D., Wang W., Li X., Yang B., Song J., Zhao X., Huang B., Shi W., Lu R., China Novel Coronavirus Investigating and Research Team A novel coronavirus from patients with pneumonia in China, 2019. N. Engl. J. Med. 2020;382:727–733. doi: 10.1056/NEJMoa2001017. [DOI] [PMC free article] [PubMed] [Google Scholar]
- 3.World Health Organization . 2020. Coronavirus disease (COVID-19): situation report – 205.https://www.who.int/docs/default-source/coronaviruse/situation-reports/20200812-covid-19-sitrep-205.pdf?sfvrsn=627c9aa8_2 [Google Scholar]
- 4.Chen H., Guo J., Wang C., Luo F., Yu X., Zhang W., Li J., Zhao D., Xu D., Gong Q. Clinical characteristics and intrauterine vertical transmission potential of COVID-19 infection in nine pregnant women: a retrospective review of medical records. Lancet. 2020;395:809–815. doi: 10.1016/S0140-6736(20)30360-3. [DOI] [PMC free article] [PubMed] [Google Scholar]
- 5.Huang C., Wang Y., Li X., Ren L., Zhao J., Hu Y., Zhang L., Fan G., Xu J., Gu X. Clinical features of patients infected with 2019 novel coronavirus in Wuhan, China. Lancet. 2020;395:497–506. doi: 10.1016/S0140-6736(20)30183-5. [DOI] [PMC free article] [PubMed] [Google Scholar]
- 6.Rothe C., Schunk M., Sothmann P., Bretzel G., Froeschl G., Wallrauch C., Zimmer T., Thiel V., Janke C., Guggemos W. Transmission of 2019-nCoV infection from an asymptomatic contact in Germany. N. Engl. J. Med. 2020;382:970–971. doi: 10.1056/NEJMc2001468. [DOI] [PMC free article] [PubMed] [Google Scholar]
- 7.Holshue M.L., DeBolt C., Lindquist S., Lofy K.H., Wiesman J., Bruce H., Spitters C., Ericson K., Wilkerson S., Tural A., Washington State 2019-nCoV Case Investigation Team First case of 2019 novel coronavirus in the United States. N. Engl. J. Med. 2020;382:929–936. doi: 10.1056/NEJMoa2001191. [DOI] [PMC free article] [PubMed] [Google Scholar]
- 8.Wu Z., McGoogan J.M. Characteristics of and important lessons from the coronavirus disease 2019 (COVID-19) outbreak in China: summary of a report of 72 314 cases from the Chinese Center for Disease Control and Prevention. JAMA. 2020;323:1239–1242. doi: 10.1001/jama.2020.2648. [DOI] [PubMed] [Google Scholar]
- 9.Vardhana S.A., Wolchok J.D. The many faces of the anti-COVID immune response. J. Exp. Med. 2020;217:e20200678. doi: 10.1084/jem.20200678. [DOI] [PMC free article] [PubMed] [Google Scholar]
- 10.Blanco-Melo D., Nilsson-Payant B.E., Liu W.-C., Uhl S., Hoagland D., Møller R., Jordan T.X., Oishi K., Panis M., Sachs D. Imbalanced host response to SARS-CoV-2 drives development of COVID-19. Cell. 2020;181:1036–1045.e9. doi: 10.1016/j.cell.2020.04.026. [DOI] [PMC free article] [PubMed] [Google Scholar]
- 11.Lee J.S., Park S., Jeong H.W., Ahn J.Y., Choi S.J., Lee H., Choi B., Nam S.K., Sa M., Kwon J.-S. Immunophenotyping of COVID-19 and influenza highlights the role of type I interferons in development of severe COVID-19. Sci. Immunol. 2020;5:eabd1554. doi: 10.1126/sciimmunol.abd1554. [DOI] [PMC free article] [PubMed] [Google Scholar]
- 12.Liao M., Liu Y., Yuan J., Wen Y., Xu G., Zhao J., Cheng L., Li J., Wang X., Wang F. Single-cell landscape of bronchoalveolar immune cells in patients with COVID-19. Nat. Med. 2020;26:842–844. doi: 10.1038/s41591-020-0901-9. [DOI] [PubMed] [Google Scholar]
- 13.Bautista E., Chotpitayasunondh T., Gao Z., Harper S.A., Shaw M., Uyeki T.M., Zaki S.R., Hayden F.G., Hui D.S., Kettner J.D., Writing Committee of the WHO Consultation on Clinical Aspects of Pandemic (H1N1) 2009 Influenza Clinical aspects of pandemic 2009 influenza A (H1N1) virus infection. N. Engl. J. Med. 2010;362:1708–1719. doi: 10.1056/NEJMra1000449. [DOI] [PubMed] [Google Scholar]
- 14.Shi Y., Wang Y., Shao C., Huang J., Gan J., Huang X., Bucci E., Piacentini M., Ippolito G., Melino G. COVID-19 infection: the perspectives on immune responses. Cell Death Differ. 2020;27:1451–1454. doi: 10.1038/s41418-020-0530-3. [DOI] [PMC free article] [PubMed] [Google Scholar]
- 15.Moore J.B., June C.H. Cytokine release syndrome in severe COVID-19. Science. 2020;368:473–474. doi: 10.1126/science.abb8925. [DOI] [PubMed] [Google Scholar]
- 16.Chua R.L., Lukassen S., Trump S., Hennig B.P., Wendisch D., Pott F., Debnath O., Thürmann L., Kurth F., Völker M.T. COVID-19 severity correlates with airway epithelium-immune cell interactions identified by single-cell analysis. Nat. Biotechnol. 2020;38:970–979. doi: 10.1038/s41587-020-0602-4. [DOI] [PubMed] [Google Scholar]
- 17.Vabret N., Britton G.J., Gruber C., Hegde S., Kim J., Kuksin M., Levantovsky R., Malle L., Moreira A., Park M.D., Sinai Immunology Review Project Immunology of COVID-19: current state of the science. Immunity. 2020;52:910–941. doi: 10.1016/j.immuni.2020.05.002. [DOI] [PMC free article] [PubMed] [Google Scholar]
- 18.Ravetch J.V., Lanier L.L. Immune inhibitory receptors. Science. 2000;290:84–89. doi: 10.1126/science.290.5489.84. [DOI] [PubMed] [Google Scholar]
- 19.Vivier E., Daëron M. Immunoreceptor tyrosine-based inhibition motifs. Immunol. Today. 1997;18:286–291. doi: 10.1016/s0167-5699(97)80025-4. [DOI] [PubMed] [Google Scholar]
- 20.Daëron M., Jaeger S., Du Pasquier L., Vivier E. Immunoreceptor tyrosine-based inhibition motifs: a quest in the past and future. Immunol. Rev. 2008;224:11–43. doi: 10.1111/j.1600-065X.2008.00666.x. [DOI] [PubMed] [Google Scholar]
- 21.Rumpret M., Drylewicz J., Ackermans L.J.E., Borghans J.A.M., Medzhitov R., Meyaard L. Functional categories of immune inhibitory receptors. Nat. Rev. Immunol. 2020 doi: 10.1038/s41577-020-0352-z. Published online July 1, 2020. [DOI] [PubMed] [Google Scholar]
- 22.Blackburn S.D., Shin H., Haining W.N., Zou T., Workman C.J., Polley A., Betts M.R., Freeman G.J., Vignali D.A.A., Wherry E.J. Coregulation of CD8+ T cell exhaustion by multiple inhibitory receptors during chronic viral infection. Nat. Immunol. 2009;10:29–37. doi: 10.1038/ni.1679. [DOI] [PMC free article] [PubMed] [Google Scholar]
- 23.Gray-Owen S.D., Blumberg R.S. CEACAM1: contact-dependent control of immunity. Nat. Rev. Immunol. 2006;6:433–446. doi: 10.1038/nri1864. [DOI] [PubMed] [Google Scholar]
- 24.Blank C.U., Haining W.N., Held W., Hogan P.G., Kallies A., Lugli E., Lynn R.C., Philip M., Rao A., Restifo N.P. Defining “T cell exhaustion”. Nat. Rev. Immunol. 2019;19:665–674. doi: 10.1038/s41577-019-0221-9. [DOI] [PMC free article] [PubMed] [Google Scholar]
- 25.Zheng M., Gao Y., Wang G., Song G., Liu S., Sun D., Xu Y., Tian Z. Functional exhaustion of antiviral lymphocytes in COVID-19 patients. Cell. Mol. Immunol. 2020;17:533–535. doi: 10.1038/s41423-020-0402-2. [DOI] [PMC free article] [PubMed] [Google Scholar]
- 26.Wykes M.N., Lewin S.R. Immune checkpoint blockade in infectious diseases. Nat. Rev. Immunol. 2018;18:91–104. doi: 10.1038/nri.2017.112. [DOI] [PMC free article] [PubMed] [Google Scholar]
- 27.Diao B., Wang C., Tan Y., Chen X., Liu Y., Ning L., Chen L., Li M., Liu Y., Wang G. Reduction and functional exhaustion of T cells in patients with coronavirus disease 2019 (COVID-19) Front. Immunol. 2020;11:827. doi: 10.3389/fimmu.2020.00827. [DOI] [PMC free article] [PubMed] [Google Scholar]
- 28.Wang F., Nie J., Wang H., Zhao Q., Xiong Y., Deng L., Song S., Ma Z., Mo P., Zhang Y. Characteristics of peripheral lymphocyte subset alteration in COVID-19 pneumonia. J. Infect. Dis. 2020;221:1762–1769. doi: 10.1093/infdis/jiaa150. [DOI] [PMC free article] [PubMed] [Google Scholar]
- 29.Li Z., Song Y., Cui C., Lan Y., Li X., Liu Y., Lu F., Zhang Y., Yu Y., Wang L. A LAG3-interfering oligonucleotide acts as an adjuvant to enhance the antibody responses induced by recombinant protein vaccines and inactivated influenza virus vaccines. Appl. Microbiol. Biotechnol. 2019;103:6543–6557. doi: 10.1007/s00253-019-09919-4. [DOI] [PubMed] [Google Scholar]
- 30.Maruhashi T., Okazaki I.M., Sugiura D., Takahashi S., Maeda T.K., Shimizu K., Okazaki T. LAG-3 inhibits the activation of CD4+ T cells that recognize stable pMHCII through its conformation-dependent recognition of pMHCII. Nat. Immunol. 2018;19:1415–1426. doi: 10.1038/s41590-018-0217-9. [DOI] [PubMed] [Google Scholar]
- 31.Stanietsky N., Simic H., Arapovic J., Toporik A., Levy O., Novik A., Levine Z., Beiman M., Dassa L., Achdout H. The interaction of TIGIT with PVR and PVRL2 inhibits human NK cell cytotoxicity. Proc. Natl. Acad. Sci. USA. 2009;106:17858–17863. doi: 10.1073/pnas.0903474106. [DOI] [PMC free article] [PubMed] [Google Scholar]
- 32.Yu X., Harden K., Gonzalez L.C., Francesco M., Chiang E., Irving B., Tom I., Ivelja S., Refino C.J., Clark H. The surface protein TIGIT suppresses T cell activation by promoting the generation of mature immunoregulatory dendritic cells. Nat. Immunol. 2009;10:48–57. doi: 10.1038/ni.1674. [DOI] [PubMed] [Google Scholar]
- 33.Golden-Mason L., Palmer B.E., Kassam N., Townshend-Bulson L., Livingston S., McMahon B.J., Castelblanco N., Kuchroo V., Gretch D.R., Rosen H.R. Negative immune regulator Tim-3 is overexpressed on T cells in hepatitis C virus infection and its blockade rescues dysfunctional CD4+ and CD8+ T cells. J. Virol. 2009;83:9122–9130. doi: 10.1128/JVI.00639-09. [DOI] [PMC free article] [PubMed] [Google Scholar]
- 34.Viganò S., Banga R., Bellanger F., Pellaton C., Farina A., Comte D., Harari A., Perreau M. CD160-associated CD8 T-cell functional impairment is independent of PD-1 expression. PLoS Pathog. 2014;10:e1004380. doi: 10.1371/journal.ppat.1004380. [DOI] [PMC free article] [PubMed] [Google Scholar]
- 35.Murphy K.M., Nelson C.A., Sedý J.R. Balancing co-stimulation and inhibition with BTLA and HVEM. Nat. Rev. Immunol. 2006;6:671–681. doi: 10.1038/nri1917. [DOI] [PubMed] [Google Scholar]
- 36.Otsuki N., Kamimura Y., Hashiguchi M., Azuma M. Expression and function of the B and T lymphocyte attenuator (BTLA/CD272) on human T cells. Biochem. Biophys. Res. Commun. 2006;344:1121–1127. doi: 10.1016/j.bbrc.2006.03.242. [DOI] [PubMed] [Google Scholar]
- 37.Anania J.C., Chenoweth A.M., Wines B.D., Hogarth P.M. The human FcγRII (CD32) family of leukocyte FcR in health and disease. Front. Immunol. 2019;10:464. doi: 10.3389/fimmu.2019.00464. [DOI] [PMC free article] [PubMed] [Google Scholar]
- 38.Cassel D.L., Keller M.A., Surrey S., Schwartz E., Schreiber A.D., Rappaport E.F., McKenzie S.E. Differential expression of Fcγ RIIA, Fcγ RIIB and Fcγ RIIC in hematopoietic cells: analysis of transcripts. Mol. Immunol. 1993;30:451–460. doi: 10.1016/0161-5890(93)90113-p. [DOI] [PubMed] [Google Scholar]
- 39.Tang A.L., Teijaro J.R., Njau M.N., Chandran S.S., Azimzadeh A., Nadler S.G., Rothstein D.M., Farber D.L. CTLA4 expression is an indicator and regulator of steady-state CD4+ FoxP3+ T cell homeostasis. J. Immunol. 2008;181:1806–1813. doi: 10.4049/jimmunol.181.3.1806. [DOI] [PMC free article] [PubMed] [Google Scholar]
- 40.Sharpe A.H., Pauken K.E. The diverse functions of the PD1 inhibitory pathway. Nat. Rev. Immunol. 2018;18:153–167. doi: 10.1038/nri.2017.108. [DOI] [PubMed] [Google Scholar]
- 41.Ahn E., Araki K., Hashimoto M., Li W., Riley J.L., Cheung J., Sharpe A.H., Freeman G.J., Irving B.A., Ahmed R. Role of PD-1 during effector CD8 T cell differentiation. Proc. Natl. Acad. Sci. USA. 2018;115:4749–4754. doi: 10.1073/pnas.1718217115. [DOI] [PMC free article] [PubMed] [Google Scholar]
- 42.Fournier N., Chalus L., Durand I., Garcia E., Pin J.J., Churakova T., Patel S., Zlot C., Gorman D., Zurawski S. FDF03, a novel inhibitory receptor of the immunoglobulin superfamily, is expressed by human dendritic and myeloid cells. J. Immunol. 2000;165:1197–1209. doi: 10.4049/jimmunol.165.3.1197. [DOI] [PubMed] [Google Scholar]
- 43.Mousseau D.D., Banville D., L’Abbé D., Bouchard P., Shen S.H. PILRα, a novel immunoreceptor tyrosine-based inhibitory motif-bearing protein, recruits SHP-1 upon tyrosine phosphorylation and is paired with the truncated counterpart PILRβ. J. Biol. Chem. 2000;275:4467–4474. doi: 10.1074/jbc.275.6.4467. [DOI] [PubMed] [Google Scholar]
- 44.Van de Velde H., von Hoegen I., Luo W., Parnes J.R., Thielemans K. The B-cell surface protein CD72/Lyb-2 is the ligand for CD5. Nature. 1991;351:662–665. doi: 10.1038/351662a0. [DOI] [PubMed] [Google Scholar]
- 45.Mageed R.A., Garaud S., Taher T.E., Parikh K., Pers J.-O., Jamin C., Renaudineau Y., Youinou P. CD5 expression promotes multiple intracellular signaling pathways in B lymphocyte. Autoimmun. Rev. 2012;11:795–798. doi: 10.1016/j.autrev.2012.02.007. [DOI] [PubMed] [Google Scholar]
- 46.Newman P.J., Berndt M.C., Gorski J., White G.C., 2nd, Lyman S., Paddock C., Muller W.A. PECAM-1 (CD31) cloning and relation to adhesion molecules of the immunoglobulin gene superfamily. Science. 1990;247:1219–1222. doi: 10.1126/science.1690453. [DOI] [PubMed] [Google Scholar]
- 47.Cheung K., Ma L., Wang G., Coe D., Ferro R., Falasca M., Buckley C.D., Mauro C., Marelli-Berg F.M. CD31 signals confer immune privilege to the vascular endothelium. Proc. Natl. Acad. Sci. USA. 2015;112:E5815–E5824. doi: 10.1073/pnas.1509627112. [DOI] [PMC free article] [PubMed] [Google Scholar]
- 48.Müller J., Nitschke L. The role of CD22 and Siglec-G in B-cell tolerance and autoimmune disease. Nat. Rev. Rheumatol. 2014;10:422–428. doi: 10.1038/nrrheum.2014.54. [DOI] [PubMed] [Google Scholar]
- 49.Han S., Collins B.E., Bengtson P., Paulson J.C. Homomultimeric complexes of CD22 in B cells revealed by protein-glycan cross-linking. Nat. Chem. Biol. 2005;1:93–97. doi: 10.1038/nchembio713. [DOI] [PubMed] [Google Scholar]
- 50.Huang Y.-H., Zhu C., Kondo Y., Anderson A.C., Gandhi A., Russell A., Dougan S.K., Petersen B.-S., Melum E., Pertel T. CEACAM1 regulates TIM-3-mediated tolerance and exhaustion. Nature. 2015;517:386–390. doi: 10.1038/nature13848. [DOI] [PMC free article] [PubMed] [Google Scholar]
- 51.Laszlo G.S., Estey E.H., Walter R.B. The past and future of CD33 as therapeutic target in acute myeloid leukemia. Blood Rev. 2014;28:143–153. doi: 10.1016/j.blre.2014.04.001. [DOI] [PubMed] [Google Scholar]
- 52.Pérez-Oliva A.B., Martínez-Esparza M., Vicente-Fernández J.J., Corral-San Miguel R., García-Peñarrubia P., Hernández-Caselles T. Epitope mapping, expression and post-translational modifications of two isoforms of CD33 (CD33M and CD33m) on lymphoid and myeloid human cells. Glycobiology. 2011;21:757–770. doi: 10.1093/glycob/cwq220. [DOI] [PubMed] [Google Scholar]
- 53.Maasho K., Masilamani M., Valas R., Basu S., Coligan J.E., Borrego F. The inhibitory leukocyte-associated Ig-like receptor-1 (LAIR-1) is expressed at high levels by human naive T cells and inhibits TCR mediated activation. Mol. Immunol. 2005;42:1521–1530. doi: 10.1016/j.molimm.2005.01.004. [DOI] [PubMed] [Google Scholar]
- 54.van der Vuurst de Vries A.R., Clevers H., Logtenberg T., Meyaard L. Leukocyte-associated immunoglobulin-like receptor-1 (LAIR-1) is differentially expressed during human B cell differentiation and inhibits B cell receptor-mediated signaling. Eur. J. Immunol. 1999;29:3160–3167. doi: 10.1002/(SICI)1521-4141(199910)29:10<3160::AID-IMMU3160>3.0.CO;2-S. [DOI] [PubMed] [Google Scholar]
- 55.Meyaard L. The inhibitory collagen receptor LAIR-1 (CD305) J. Leukoc. Biol. 2008;83:799–803. doi: 10.1189/jlb.0907609. [DOI] [PubMed] [Google Scholar]
- 56.Mahaweni N.M., Ehlers F.A.I., Bos G.M.J., Wieten L. Tuning natural killer cell anti-multiple myeloma reactivity by targeting inhibitory signaling via KIR and NKG2A. Front. Immunol. 2018;9:2848. doi: 10.3389/fimmu.2018.02848. [DOI] [PMC free article] [PubMed] [Google Scholar]
- 57.Gunturi A., Berg R.E., Forman J. The role of CD94/NKG2 in innate and adaptive immunity. Immunol. Res. 2004;30:29–34. doi: 10.1385/IR:30:1:029. [DOI] [PubMed] [Google Scholar]
- 58.Zhang C., Zhang J., Sun R., Feng J., Wei H., Tian Z. Opposing effect of IFNγ and IFNα on expression of NKG2 receptors: negative regulation of IFNγ on NK cells. Int. Immunopharmacol. 2005;5:1057–1067. doi: 10.1016/j.intimp.2005.02.003. [DOI] [PubMed] [Google Scholar]
- 59.Matlung H.L., Szilagyi K., Barclay N.A., van den Berg T.K. The CD47-SIRPα signaling axis as an innate immune checkpoint in cancer. Immunol. Rev. 2017;276:145–164. doi: 10.1111/imr.12527. [DOI] [PubMed] [Google Scholar]
- 60.Mantovani A., Longo D.L. Macrophage checkpoint blockade in cancer—back to the future. N. Engl. J. Med. 2018;379:1777–1779. doi: 10.1056/NEJMe1811699. [DOI] [PubMed] [Google Scholar]
- 61.Seiffert M., Cant C., Chen Z., Rappold I., Brugger W., Kanz L., Brown E.J., Ullrich A., Bühring H.J. Human signal-regulatory protein is expressed on normal, but not on subsets of leukemic myeloid cells and mediates cellular adhesion involving its counterreceptor CD47. Blood. 1999;94:3633–3643. [PubMed] [Google Scholar]
- 62.Vaine C.A., Soberman R.J. The CD200-CD200R1 inhibitory signaling pathway: immune regulation and host-pathogen interactions. Adv. Immunol. 2014;121:191–211. doi: 10.1016/B978-0-12-800100-4.00005-2. [DOI] [PMC free article] [PubMed] [Google Scholar]
- 63.Rygiel T.P., Meyaard L. CD200R signaling in tumor tolerance and inflammation: a tricky balance. Curr. Opin. Immunol. 2012;24:233–238. doi: 10.1016/j.coi.2012.01.002. [DOI] [PubMed] [Google Scholar]
- 64.Bachelet I., Munitz A., Moretta A., Moretta L., Levi-Schaffer F. The inhibitory receptor IRp60 (CD300a) is expressed and functional on human mast cells. J. Immunol. 2005;175:7989–7995. doi: 10.4049/jimmunol.175.12.7989. [DOI] [PubMed] [Google Scholar]
- 65.Cantoni C., Bottino C., Augugliaro R., Morelli L., Marcenaro E., Castriconi R., Vitale M., Pende D., Sivori S., Millo R. Molecular and functional characterization of IRp60, a member of the immunoglobulin superfamily that functions as an inhibitory receptor in human NK cells. Eur. J. Immunol. 1999;29:3148–3159. doi: 10.1002/(SICI)1521-4141(199910)29:10<3148::AID-IMMU3148>3.0.CO;2-L. [DOI] [PubMed] [Google Scholar]
- 66.Alvarez-Errico D., Aguilar H., Kitzig F., Brckalo T., Sayós J., López-Botet M. IREM-1 is a novel inhibitory receptor expressed by myeloid cells. Eur. J. Immunol. 2004;34:3690–3701. doi: 10.1002/eji.200425433. [DOI] [PubMed] [Google Scholar]
- 67.Kim E.J., Lee S.M., Suk K., Lee W.H. CD300a and CD300f differentially regulate the MyD88 and TRIF-mediated TLR signalling pathways through activation of SHP-1 and/or SHP-2 in human monocytic cell lines. Immunology. 2012;135:226–235. doi: 10.1111/j.1365-2567.2011.03528.x. [DOI] [PMC free article] [PubMed] [Google Scholar]
- 68.Young N.T., Waller E.C.P., Patel R., Roghanian A., Austyn J.M., Trowsdale J. The inhibitory receptor LILRB1 modulates the differentiation and regulatory potential of human dendritic cells. Blood. 2008;111:3090–3096. doi: 10.1182/blood-2007-05-089771. [DOI] [PubMed] [Google Scholar]
- 69.Heidenreich S., Zu Eulenburg C., Hildebrandt Y., Stübig T., Sierich H., Badbaran A., Eiermann T.H., Binder T.M.C., Kröger N. Impact of the NK cell receptor LIR-1 (ILT-2/CD85j/LILRB1) on cytotoxicity against multiple myeloma. Clin. Dev. Immunol. 2012;2012:652130. doi: 10.1155/2012/652130. [DOI] [PMC free article] [PubMed] [Google Scholar]
- 70.Fanger N.A., Cosman D., Peterson L., Braddy S.C., Maliszewski C.R., Borges L. The MHC class I binding proteins LIR-1 and LIR-2 inhibit Fc receptor-mediated signaling in monocytes. Eur. J. Immunol. 1998;28:3423–3434. doi: 10.1002/(SICI)1521-4141(199811)28:11<3423::AID-IMMU3423>3.0.CO;2-2. [DOI] [PubMed] [Google Scholar]
- 71.Lu H.K., Rentero C., Raftery M.J., Borges L., Bryant K., Tedla N. Leukocyte Ig-like receptor B4 (LILRB4) is a potent inhibitor of FcgammaRI-mediated monocyte activation via dephosphorylation of multiple kinases. J. Biol. Chem. 2009;284:34839–34848. doi: 10.1074/jbc.M109.035683. [DOI] [PMC free article] [PubMed] [Google Scholar]
- 72.Cella M., Döhring C., Samaridis J., Dessing M., Brockhaus M., Lanzavecchia A., Colonna M. A novel inhibitory receptor (ILT3) expressed on monocytes, macrophages, and dendritic cells involved in antigen processing. J. Exp. Med. 1997;185:1743–1751. doi: 10.1084/jem.185.10.1743. [DOI] [PMC free article] [PubMed] [Google Scholar]
- 73.Chen H.-M., van der Touw W., Wang Y.S., Kang K., Mai S., Zhang J., Alsina-Beauchamp D., Duty J.A., Mungamuri S.K., Zhang B. Blocking immunoinhibitory receptor LILRB2 reprograms tumor-associated myeloid cells and promotes antitumor immunity. J. Clin. Invest. 2018;128:5647–5662. doi: 10.1172/JCI97570. [DOI] [PMC free article] [PubMed] [Google Scholar]
- 74.Bashirova A.A., Apps R., Vince N., Mochalova Y., Yu X.G., Carrington M. Diversity of the human LILRB3/A6 locus encoding a myeloid inhibitory and activating receptor pair. Immunogenetics. 2014;66:1–8. doi: 10.1007/s00251-013-0730-9. [DOI] [PMC free article] [PubMed] [Google Scholar]
- 75.Burshtyn D.N., Morcos C. The expanding spectrum of ligands for leukocyte Ig-like receptors. J. Immunol. 2016;196:947–955. doi: 10.4049/jimmunol.1501937. [DOI] [PubMed] [Google Scholar]
- 76.Steevels T.A.M., Meyaard L. Immune inhibitory receptors: essential regulators of phagocyte function. Eur. J. Immunol. 2011;41:575–587. doi: 10.1002/eji.201041179. [DOI] [PubMed] [Google Scholar]
- 77.Hogan L.E., Jones D.C., Allen R.L. Expression of the innate immune receptor LILRB5 on monocytes is associated with mycobacteria exposure. Sci. Rep. 2016;6:21780. doi: 10.1038/srep21780. [DOI] [PMC free article] [PubMed] [Google Scholar]
- 78.Steevels T.A.M., van Avondt K., Westerlaken G.H.A., Stalpers F., Walk J., Bont L., Coffer P.J., Meyaard L. Signal inhibitory receptor on leukocytes-1 (SIRL-1) negatively regulates the oxidative burst in human phagocytes. Eur. J. Immunol. 2013;43:1297–1308. doi: 10.1002/eji.201242916. [DOI] [PubMed] [Google Scholar]
- 79.Cornish A.L., Freeman S., Forbes G., Ni J., Zhang M., Cepeda M., Gentz R., Augustus M., Carter K.C., Crocker P.R. Characterization of siglec-5, a novel glycoprotein expressed on myeloid cells related to CD33. Blood. 1998;92:2123–2132. [PubMed] [Google Scholar]
- 80.Macauley M.S., Crocker P.R., Paulson J.C. Siglec-mediated regulation of immune cell function in disease. Nat. Rev. Immunol. 2014;14:653–666. doi: 10.1038/nri3737. [DOI] [PMC free article] [PubMed] [Google Scholar]
- 81.Büll C., Heise T., Adema G.J., Boltje T.J. Sialic acid mimetics to target the sialic acid-Siglec axis. Trends Biochem. Sci. 2016;41:519–531. doi: 10.1016/j.tibs.2016.03.007. [DOI] [PubMed] [Google Scholar]
- 82.Zhang J.Q., Nicoll G., Jones C., Crocker P.R. Siglec-9, a novel sialic acid binding member of the immunoglobulin superfamily expressed broadly on human blood leukocytes. J. Biol. Chem. 2000;275:22121–22126. doi: 10.1074/jbc.M002788200. [DOI] [PubMed] [Google Scholar]
- 83.Nicoll G., Ni J., Liu D., Klenerman P., Munday J., Dubock S., Mattei M.G., Crocker P.R. Identification and characterization of a novel siglec, siglec-7, expressed by human natural killer cells and monocytes. J. Biol. Chem. 1999;274:34089–34095. doi: 10.1074/jbc.274.48.34089. [DOI] [PubMed] [Google Scholar]
- 84.Munday J., Kerr S., Ni J., Cornish A.L., Zhang J.Q., Nicoll G., Floyd H., Mattei M.G., Moore P., Liu D., Crocker P.R. Identification, characterization and leucocyte expression of Siglec-10, a novel human sialic acid-binding receptor. Biochem. J. 2001;355:489–497. doi: 10.1042/0264-6021:3550489. [DOI] [PMC free article] [PubMed] [Google Scholar]
- 85.Angata T., Kerr S.C., Greaves D.R., Varki N.M., Crocker P.R., Varki A. Cloning and characterization of human Siglec-11. A recently evolved signaling molecule that can interact with SHP-1 and SHP-2 and is expressed by tissue macrophages, including brain microglia. J. Biol. Chem. 2002;277:24466–24474. doi: 10.1074/jbc.M202833200. [DOI] [PubMed] [Google Scholar]
- 86.Nasu J., Uto T., Fukaya T., Takagi H., Fukui T., Miyanaga N., Nishikawa Y., Yamasaki S., Yamashita Y., Sato K. Pivotal role of the carbohydrate recognition domain in self-interaction of CLEC4A to elicit the ITIM-mediated inhibitory function in murine conventional dendritic cells in vitro. Int. Immunol. 2020;32:673–682. doi: 10.1093/intimm/dxaa034. [DOI] [PubMed] [Google Scholar]
- 87.Marshall A.S., Willment J.A., Pyz E., Dennehy K.M., Reid D.M., Dri P., Gordon S., Wong S.Y., Brown G.D. Human MICL (CLEC12A) is differentially glycosylated and is down-regulated following cellular activation. Eur. J. Immunol. 2006;36:2159–2169. doi: 10.1002/eji.200535628. [DOI] [PubMed] [Google Scholar]
- 88.Lieberman N.A.P., Peddu V., Xie H., Shrestha L., Huang M.-L., Mears M.C., Cajimat M.N., Bente D.A., Shi P.-Y., Bovier F. In vivo antiviral host response to SARS-CoV-2 by viral load, sex, and age. bioRxiv. 2020 doi: 10.1101/2020.06.22.165225. [DOI] [PMC free article] [PubMed] [Google Scholar]
- 89.Brunet J.-F., Denizot F., Luciani M.-F., Roux-Dosseto M., Suzan M., Mattei M.-G., Golstein P. A new member of the immunoglobulin superfamily—CTLA-4. Nature. 1987;328:267–270. doi: 10.1038/328267a0. [DOI] [PubMed] [Google Scholar]
- 90.Foley J.F. Glucocorticoids and PD-1. Sci. Signal. 2018;11:eaav2683. [Google Scholar]
- 91.Hosomi S., Grootjans J., Huang Y.H., Kaser A., Blumberg R.S. New insights into the regulation of natural-killer group 2 member D (NKG2D) and NKG2D-ligands: endoplasmic reticulum stress and CEA-related cell adhesion molecule 1. Front. Immunol. 2018;9:1324. doi: 10.3389/fimmu.2018.01324. [DOI] [PMC free article] [PubMed] [Google Scholar]
- 92.Ye S., Cowled C.J., Yap C.H., Stambas J. Deep sequencing of primary human lung epithelial cells challenged with H5N1 influenza virus reveals a proviral role for CEACAM1. Sci. Rep. 2018;8:15468. doi: 10.1038/s41598-018-33605-6. [DOI] [PMC free article] [PubMed] [Google Scholar]
- 93.Khairnar V., Duhan V., Patil A.M., Zhou F., Bhat H., Thoens C., Sharma P., Adomati T., Friendrich S.-K., Bezgovsek J. CEACAM1 promotes CD8+ T cell responses and improves control of a chronic viral infection. Nat. Commun. 2018;9:2561. doi: 10.1038/s41467-018-04832-2. [DOI] [PMC free article] [PubMed] [Google Scholar]
- 94.Oliveira J.J., Karrar S., Rainbow D.B., Pinder C.L., Clarke P., Rubio García A., Al-Assar O., Burling K., Morris S., Stratton R. The plasma biomarker soluble SIGLEC-1 is associated with the type I interferon transcriptional signature, ethnic background and renal disease in systemic lupus erythematosus. Arthritis Res. Ther. 2018;20:152. doi: 10.1186/s13075-018-1649-1. [DOI] [PMC free article] [PubMed] [Google Scholar]
- 95.Barclay A.N., Van den Berg T.K. The interaction between signal regulatory protein alpha (SIRPα) and CD47: structure, function, and therapeutic target. Annu. Rev. Immunol. 2014;32:25–50. doi: 10.1146/annurev-immunol-032713-120142. [DOI] [PubMed] [Google Scholar]
- 96.Murphy B.R., Whitehead S.S. Immune response to dengue virus and prospects for a vaccine. Annu. Rev. Immunol. 2011;29:587–619. doi: 10.1146/annurev-immunol-031210-101315. [DOI] [PubMed] [Google Scholar]
- 97.Chen W., Han C., Xie B., Hu X., Yu Q., Shi L., Wang Q., Li D., Wang J., Zheng P. Induction of Siglec-G by RNA viruses inhibits the innate immune response by promoting RIG-I degradation. Cell. 2013;152:467–478. doi: 10.1016/j.cell.2013.01.011. [DOI] [PubMed] [Google Scholar]
- 98.Morrissey M.A., Kern N., Vale R.D. CD47 ligation repositions the inhibitory receptor SIRPA to suppress integrin activation and phagocytosis. Immunity. 2020;53:290–302.e6. doi: 10.1016/j.immuni.2020.07.008. [DOI] [PMC free article] [PubMed] [Google Scholar]
- 99.Cham L.B., Torrez Dulgeroff L.B., Tal M.C., Adomati T., Li F., Bhat H., Huang A., Lang P.A., Moreno M.E., Rivera J.M. Immunotherapeutic blockade of CD47 inhibitory signaling enhances innate and adaptive immune responses to viral infection. Cell Rep. 2020;31:107494. doi: 10.1016/j.celrep.2020.03.058. [DOI] [PMC free article] [PubMed] [Google Scholar]
- 100.Dong L.-W., Kong X.-N., Yan H.-X., Yu L.-X., Chen L., Yang W., Liu Q., Huang D.-D., Wu M.-C., Wang H.-Y. Signal regulatory protein α negatively regulates both TLR3 and cytoplasmic pathways in type I interferon induction. Mol. Immunol. 2008;45:3025–3035. doi: 10.1016/j.molimm.2008.03.012. [DOI] [PubMed] [Google Scholar]
- 101.Huang F., Yang C., Yu W., Bi Y., Long F., Wang J., Li Y., Jing S. Hepatitis E virus infection activates signal regulator protein α to down-regulate type I interferon. Immunol. Res. 2016;64:115–122. doi: 10.1007/s12026-015-8729-y. [DOI] [PubMed] [Google Scholar]
- 102.Roquilly A., Jacqueline C., Davieau M., Mollé A., Sadek A., Fourgeux C., Rooze P., Broquet A., Misme-Aucouturier B., Chaumette T. Alveolar macrophages are epigenetically altered after inflammation, leading to long-term lung immunoparalysis. Nat. Immunol. 2020;21:636–648. doi: 10.1038/s41590-020-0673-x. [DOI] [PubMed] [Google Scholar]
- 103.Murch S.H. Common determinants of severe Covid-19 infection are explicable by SARS-CoV-2 secreted glycoprotein interaction with the CD33-related Siglecs, Siglec-3 and Siglec-5/14. Med. Hypotheses. 2020;144:110168. doi: 10.1016/j.mehy.2020.110168. [DOI] [PMC free article] [PubMed] [Google Scholar]
- 104.Fuertes Marraco S.A., Neubert N.J., Verdeil G., Speiser D.E. Inhibitory receptors beyond T cell exhaustion. Front. Immunol. 2015;6:310. doi: 10.3389/fimmu.2015.00310. [DOI] [PMC free article] [PubMed] [Google Scholar]
- 105.Chen G., Wu D., Guo W., Cao Y., Huang D., Wang H., Wang T., Zhang X., Chen H., Yu H. Clinical and immunological features of severe and moderate coronavirus disease 2019. J. Clin. Invest. 2020;130:2620–2629. doi: 10.1172/JCI137244. [DOI] [PMC free article] [PubMed] [Google Scholar]
- 106.Ansari A.W., Khan M.A., Schmidt R.E., Broering D.C. Harnessing the immunotherapeutic potential of T-lymphocyte co-signaling molecules in transplantation. Immunol. Lett. 2017;183:8–16. doi: 10.1016/j.imlet.2017.01.008. [DOI] [PubMed] [Google Scholar]
- 107.Huard B., Prigent P., Tournier M., Bruniquel D., Triebel F. CD4/major histocompatibility complex class II interaction analyzed with CD4- and lymphocyte activation gene-3 (LAG-3)-Ig fusion proteins. Eur. J. Immunol. 1995;25:2718–2721. doi: 10.1002/eji.1830250949. [DOI] [PubMed] [Google Scholar]
- 108.Workman C.J., Vignali D.A.A. The CD4-related molecule, LAG-3 (CD223), regulates the expansion of activated T cells. Eur. J. Immunol. 2003;33:970–979. doi: 10.1002/eji.200323382. [DOI] [PubMed] [Google Scholar]
- 109.Huang C.-T., Workman C.J., Flies D., Pan X., Marson A.L., Zhou G., Hipkiss E.L., Ravi S., Kowalski J., Levitsky H.I. Role of LAG-3 in regulatory T cells. Immunity. 2004;21:503–513. doi: 10.1016/j.immuni.2004.08.010. [DOI] [PubMed] [Google Scholar]
- 110.Sega E.I., Leveson-Gower D.B., Florek M., Schneidawind D., Luong R.H., Negrin R.S. Role of lymphocyte activation gene-3 (Lag-3) in conventional and regulatory T cell function in allogeneic transplantation. PLoS ONE. 2014;9:e86551. doi: 10.1371/journal.pone.0086551. [DOI] [PMC free article] [PubMed] [Google Scholar]
- 111.Andrews L.P., Marciscano A.E., Drake C.G., Vignali D.A.A. LAG3 (CD223) as a cancer immunotherapy target. Immunol. Rev. 2017;276:80–96. doi: 10.1111/imr.12519. [DOI] [PMC free article] [PubMed] [Google Scholar]
- 112.Menachery V.D., Schäfer A., Burnum-Johnson K.E., Mitchell H.D., Eisfeld A.J., Walters K.B., Nicora C.D., Purvine S.O., Casey C.P., Monroe M.E. MERS-CoV and H5N1 influenza virus antagonize antigen presentation by altering the epigenetic landscape. Proc. Natl. Acad. Sci. USA. 2018;115:E1012–E1021. doi: 10.1073/pnas.1706928115. [DOI] [PMC free article] [PubMed] [Google Scholar]
- 113.Gambichler T., Reuther J., Scheel C.H., Becker J.C. On the use of immune checkpoint inhibitors in patients with viral infections including COVID-19. J. Immunother. Cancer. 2020;8:e001145. doi: 10.1136/jitc-2020-001145. [DOI] [PMC free article] [PubMed] [Google Scholar]
- 114.Colston E., Grasela D., Gardiner D., Bucy R.P., Vakkalagadda B., Korman A.J., Lowy I. An open-label, multiple ascending dose study of the anti-CTLA-4 antibody ipilimumab in viremic HIV patients. PLoS ONE. 2018;13:e0198158. doi: 10.1371/journal.pone.0198158. [DOI] [PMC free article] [PubMed] [Google Scholar]
- 115.Gay C.L., Bosch R.J., Ritz J., Hataye J.M., Aga E., Tressler R.L., Mason S.W., Hwang C.K., Grasela D.M., Ray N., AIDS Clinical Trials 5326 Study Team Clinical trial of the anti-PD-L1 antibody BMS-936559 in HIV-1 infected participants on suppressive antiretroviral therapy. J. Infect. Dis. 2017;215:1725–1733. doi: 10.1093/infdis/jix191. [DOI] [PMC free article] [PubMed] [Google Scholar]
- 116.Yu Y., Tsang J.C.H., Wang C., Clare S., Wang J., Chen X., Brandt C., Kane L., Campos L.S., Lu L. Single-cell RNA-seq identifies a PD-1hi ILC progenitor and defines its development pathway. Nature. 2016;539:102–106. doi: 10.1038/nature20105. [DOI] [PubMed] [Google Scholar]
- 117.Aschenbrenner A.C., Mouktaroudi M., Kraemer B., Antonakos N., Oestreich M., Gkizeli K., Nuesch-Germano M., Saridaki M., Bonaguro L., Reusch N. Disease severity-specific neutrophil signatures in blood transcriptomes stratify COVID-19 patients. medRxiv. 2020 doi: 10.1101/2020.07.07.20148395. [DOI] [PMC free article] [PubMed] [Google Scholar]
- 118.Zaas A.K., Chen M., Varkey J., Veldman T., Hero A.O., 3rd, Lucas J., Huang Y., Turner R., Gilbert A., Lambkin-Williams R. Gene expression signatures diagnose influenza and other symptomatic respiratory viral infections in humans. Cell Host Microbe. 2009;6:207–217. doi: 10.1016/j.chom.2009.07.006. [DOI] [PMC free article] [PubMed] [Google Scholar]
- 119.Reghunathan R., Jayapal M., Hsu L.Y., Chng H.H., Tai D., Leung B.P., Melendez A.J. Expression profile of immune response genes in patients with severe acute respiratory syndrome. BMC Immunol. 2005;6:2. doi: 10.1186/1471-2172-6-2. [DOI] [PMC free article] [PubMed] [Google Scholar]
- 120.Hughey J.J., Butte A.J. Robust meta-analysis of gene expression using the elastic net. Nucleic Acids Res. 2015;43 doi: 10.1093/nar/gkv229. e79–e79. [DOI] [PMC free article] [PubMed] [Google Scholar]
- 121.Ritchie M.E., Phipson B., Wu D., Hu Y., Law C.W., Shi W., Smyth G.K. limma powers differential expression analyses for RNA-sequencing and microarray studies. Nucleic Acids Res. 2015;43:e47. doi: 10.1093/nar/gkv007. [DOI] [PMC free article] [PubMed] [Google Scholar]
- 122.Dudoit S., Yang Y.H., Callow M.J., Speed T.P. Statistical methods for identifying differentially expressed genes in replicated cDNA microarray experiments. Stat. Sin. 2002;12:111–139. [Google Scholar]
- 123.Butler A., Hoffman P., Smibert P., Papalexi E., Satija R. Integrating single-cell transcriptomic data across different conditions, technologies, and species. Nat. Biotechnol. 2018;36:411–420. doi: 10.1038/nbt.4096. [DOI] [PMC free article] [PubMed] [Google Scholar]
Associated Data
This section collects any data citations, data availability statements, or supplementary materials included in this article.