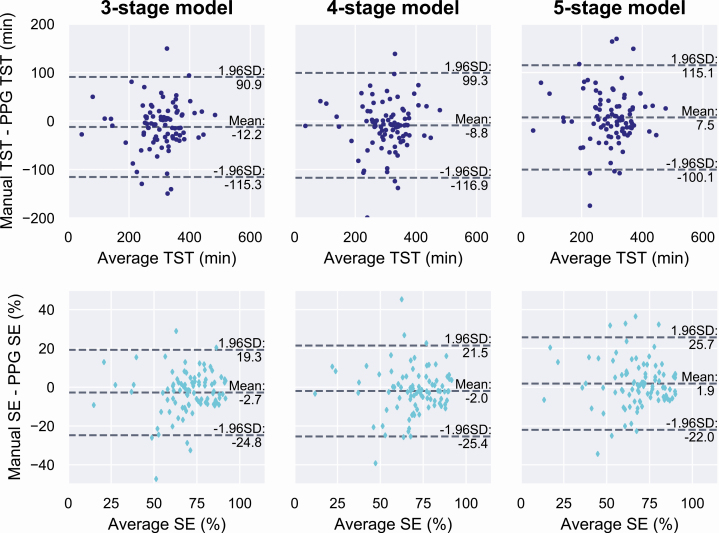
Figure 7.
Bland–Altman plots for total sleep time (TST, top row) and sleep efficiency (SE, bottom row) from the deep learning models trained to identify three, four, or five sleep stages. Values are calculated as the average and difference between the values obtained from manual PSG-based sleep scoring and from the automatic PPG-based scoring in an independent test set of 89 patients suspected with obstructive sleep apnea.

