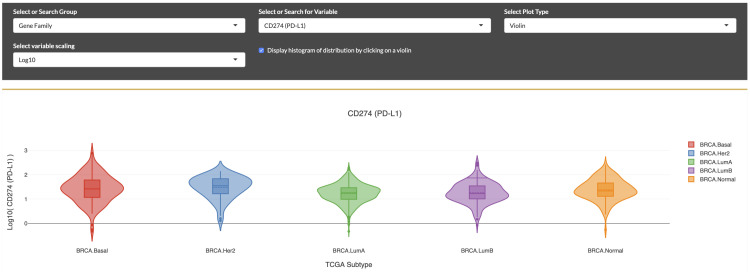
Figure 4. Visualization of the PD-L1 immunomodulator expression patterns in breast cancer subtypes.
Selection for PD-L1 expression distributions displayed as violin plots within molecular subtypes of breast cancer, according to “PAM-50” classification. Elevated expression is seen in the HER2 subtype.

