

Abstract
The structure of a Ni/Al2O3 monolithic catalyst after methanation reaction and its methanation performance were studied by taking analogue syngas of biomass gasification H2/CO/N2 as feed gas when the temperature ranged from 250 to 550 °C, and the weight hourly space velocity (WHSV) was between 6000 and 14,000 mL g–1 h–1. The Ni/Al2O3 catalysts using cordierite honeycomb ceramics as the substrate were prepared by dipping and sol–gel methods. The results show that the Ni/Al2O3 catalyst prepared by the dipping method (DIP-Ni/Al2O3) has better methanation performance than the Ni/Al2O3 catalyst prepared by the sol–gel method (SG-Ni/Al2O3) through many tests such as TEM, BET, XRD, H2-TPD, H2-TPR, and TG analysis. The DIP-Ni/Al2O3 catalyst exhibits the best methanation performance at 400 °C when the molar ratio of H2, CO, and N2 is 3/1/1 and the WHSV is 10,000 mL g–1 h–1. Under this condition, the CO conversion and CH4 selectivity are 98.6 and 90.9%, respectively. In addition, the methanation performance of the DIP-Ni/Al2O3 catalyst is relatively more stable, and the CO conversion and CH4 selectivity were basically maintained at around 90% within the experimental WHSV range. The influence of Ni content on the methanation performance of the DIP-Ni/Al2O3 catalyst can be seen in the order from high to low of methanation performance: 15% Ni, 20% Ni, and 10% Ni, and the maximum values of CO conversion and CH4 selectivity reach 96.8 and 96%, respectively, at 400 °C for 15% Ni/Al2O3.
1. Introduction
Syngas methanation technology is the core of biomass to produce natural gas. Its main process is to convert H2 and CO in biomass gasification of syngas into CH4 by using a catalyst, which plays a dominant role in this process. At present, the catalysts used for methanation still have a series of problems such as high reaction temperature, low weight hourly space velocity (WHSV), and difficult replacement.1 If a low-temperature catalyst can be used in the methanation reaction, it can not only reduce operational costs of the system but also improve the safety of the reaction. Therefore, the preparation of a low-temperature methanation catalyst is the key to the study of syngas methanation. Usually, porous materials are loaded with metals as methanation catalysts, which are mainly composed of active components and carriers. As for the active component, metallic nickel has high methanation activity, good methane selectivity, and low cost, so it is an ideal choice for the active component of the methanation catalyst.2−8
In recent years, most researchers have mainly studied the methanation performance of nickel-based catalysts under different single carriers such as Al2O3, CeO2, SiO2, ZnO, and TiO2. The results showed that Al2O3 exhibited a larger specific surface area, which made the active component more dispersed, and the methanation performance of catalyst was better.9−12 Cordierite has high mechanical strength, low pressure drop, good thermal stability, and low thermal expansion coefficient, so it has become one of the best choices for molding catalysts in recent years.13−15 Grzybek et al.16 studied the catalytic effect of the Co–Ni/cordierite monolithic catalyst on the decomposition reaction of N2O using the structural advantage of cordierite; the results showed that the conversion rate of N2O can reach 96% at 400–450 °C. Sollier et al.17 researched the oxidation coupling reaction of methane by loading Sr/La2O3 on cordierite, comparing the catalytic effect of the Sr/La2O3 monolithic catalyst with that of the Sr/La2O3 powder catalyst. The results showed that the contact area between the feed gas and catalyst increased because of the honeycomb structure of the monolithic catalyst, and the reaction rate improved. At the same time, Mg and Si contained in cordierite can effectively improve the catalytic performance of the catalyst, so that the monolithic catalyst has a better catalytic effect. By loading Pd on cordierite coated with graphene, Zhu et al.18 found that the monolithic catalyst had a good effect on the catalytic reaction of the hydrogenation of styrene to ethylbenzene. In addition, Khani et al.19 prepared two monolithic catalysts by coating the Cu−Ni/LaZnAlO4 catalyst and Cu−Ni/Al2O3 catalyst on a single cordierite reactor and compared the catalytic effects of the two monolithic catalysts in the reforming reaction of methanol steam hydrogen production. However, it has been rarely reported that the cordierite is used as a matrix for the methanation study of biomass gasification syngas.
The nickel-based catalysts prepared by the dipping and sol–gel methods have been applied to the CO methanation reaction. The results suggested that each of them has the characteristics of high activity, stability, and CH4 selectivity.20−23 However, the preparation process of the dipping method is more simple. At present, the catalysts prepared by the two preparation methods lack comparative analysis for the methanation property. Hence, it is necessary to further explore the methanation property of the catalysts prepared by the two methods.
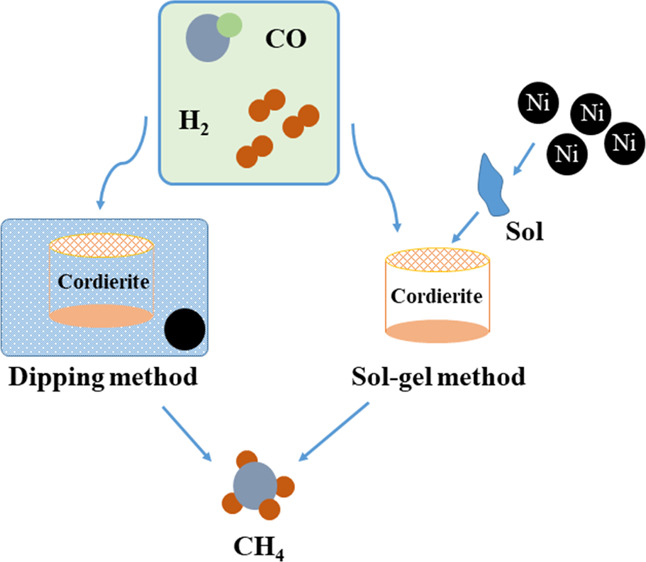
Therefore, in this study, cordierite honeycomb ceramics were used as the substrate, and Ni/Al2O3 was supported on cordierite by dipping and sol–gel methods to prepare Ni/Al2O3 monolithic honeycomb catalysts. Using syngas with a H2/CO/N2 molar ratio of 3/1/1 as the feed gas, the effects of different preparation methods, temperature, WHSV, and nickel content on the methanation performance of catalysts were investigated under the conditions that the reaction temperature was 250–550 °C and the WHSV was 6000–14,000 mL g–1 h–1 by means of transmission electron microscopy (TEM), Brunauer–Emmett–Teller, X-ray diffraction (XRD), hydrogen temperature programmed desorption (H2-TPD), and thermogravimetric (TG) analysis.
2. Experimental Section
2.1. Catalyst Preparation
The cordierite needs to be preprocessed before the methanation experiment; cordierite was placed in 20% dilute nitric acid solution, soaked for 12 h at room temperature, then washed with deionized water until it became neutral, dried in oven, and stored for later use.
2.1.1. Catalyst Prepared by the Dipping Method
The pretreated cordierite is placed in a mixed solution of nickel nitrate and aluminum nitrate with a molar ratio of nickel and aluminum of 10:3, soaked for 12 h, dried at 105 °C for 12 h, and roasted at 500 °C in a muffle furnace for 4 h. The above operation is repeated twice to obtain the Ni/Al2O3 monolithic honeycomb catalyst, DIP-Ni/Al2O3 catalyst in short.
2.1.2. Catalyst Prepared by the Sol–Gel Method
-
(1)
Ni/Al2O3 powder is prepared using ref (21).
-
(2)
preparation of the aluminum gel, a certain volume of deionized water was heated to 85 °C, a certain mass of pseudoboehmite powder was added, magnetically stirred into a suspension, continued to heat for 1 h, then 1 mol/L of dilute nitric acid was added, continued to stir 1.5–2 h until it became translucent, and it was aged 24 h at room temperature.
-
(3)
load the nickel-based active component, the above Ni/Al2O3 powder was added to an appropriate amount of aluminum gel, stirred well, immersed the pretreated cordierite in the sol (the sol covers the entire cordierite matrix), and taken out after a certain period of time. The residual sol in the cordierite channel was blown off, let stand for 30 min after baking in an oven, and roasted for 4 h at 500 °C. The above operation was repeated twice to obtain the Ni/Al2O3 monolithic honeycomb catalyst, SG-Ni/Al2O3 catalyst in short.
2.2. Evaluation of Catalyst Activity
The experimental system used for the evaluation of catalyst activity during the methanation reaction is shown in Figure 1a. It mainly consists of an intake system, reaction system, and detection system. Among them, the intake system is composed of feed gas, a mass flow meter, and its control device; the reaction system contains a fixed-bed reactor and its temperature controller, and the detection system is mainly a gas chromatograph. The catalytic test is conducted in the fixed-bed reactor, which consists of a quartz tube and insulation system. The inner diameter of the quartz tube is 50 mm, the length of isothermal zone is 300 mm, and the catalyst bed is situated at the bottom of the constant temperature zone, with a thickness of 2 mm. More detailed dimensions of the fixed-bed reactor are shown in Figure 1b. In addition, the experiments of the methanation reaction are performed at room pressure, and the methanation performance of the catalyst is evaluated using CO conversion and CH4 selectivity.
Figure 1.

Schematic diagram of the experimental system (a) and the size of the fixed-bed reactor (b).
The experimental procedure is as follows: First, the Ni/Al2O3 catalyst placed in the constant temperature zone of the quartz tube is purged with 50 mL/min of N2 and heated to 470 °C. Then, the catalyst is subjected to reduction treatment in a H2 atmosphere of 50 mL/min for 3 h when the temperature stabilizes. Next, the quartz tube is cooled to the reaction temperature, and the feed gas H2/CO/N2 with the molar ratio 3/1/1 is injected into it. In experiments, N2 is added as an inert component for decreasing the gas-volume reduction rate and employed as internal standard gas. After the methanation reaction, the generated gas is collected using a gas bag, and the gas composition and content are analyzed by using gas chromatography.
The CO conversion (abbreviated as XCO) and CH4 selectivity (abbreviated as SCH4) can be calculated based on the formulas given below. In all formulas, Ax,in and Ax,out represent the flow rate of the x species, which flow into and out of the reactor, respectively.
3. Results and Discussion
3.1. Effect of the Catalyst Preparation Method on the Catalyst Structure
3.1.1. Microtopographic Analysis of Catalysts
The particle size of the catalysts was analyzed by a TF20 transmission electron microscope. The test steps are as follows: the catalyst is carefully ground and evenly dispersed in anhydrous ethanol and then treated in a microwave ultrasonic instrument for 20 min. The suspension is added dropwise on the copper network and observed after infrared drying.
In order to visually observe the distribution of the active component and the carrier of the catalyst, TEM characterization and particle size distribution analysis were performed on the DIP-Ni/Al2O3 and SG-Ni/Al2O3 catalysts after reduction. The results are shown in Figure 2. As can be seen from Figure 2a1,b1, the Ni grains are evenly distributed on the surface of the catalysts, and the Ni crystalline grain sizes range from 0 to 8 nm and from 0 to 12 nm, the average values are 4.10 and 5.21 nm, respectively, for the DIP-Ni/Al2O3 and SG-Ni/Al2O3 catalysts. The average crystalline grain size of Ni for the former is smaller than for the latter, which shows the DIP-Ni/Al2O3 catalyst has higher Ni dispersion, and the particle agglomeration occurs in the SG-Ni/Al2O3 catalyst. The existence of Ni grains is mainly determined by the interplanar spacing in the TEM diagram. It can be seen from Figure 2a2,b2 that there are obvious lattice fringes that exist on both catalysts with the interplanar spacing of 0.203 nm; it mainly corresponds to the Ni crystal surface (111).
Figure 2.
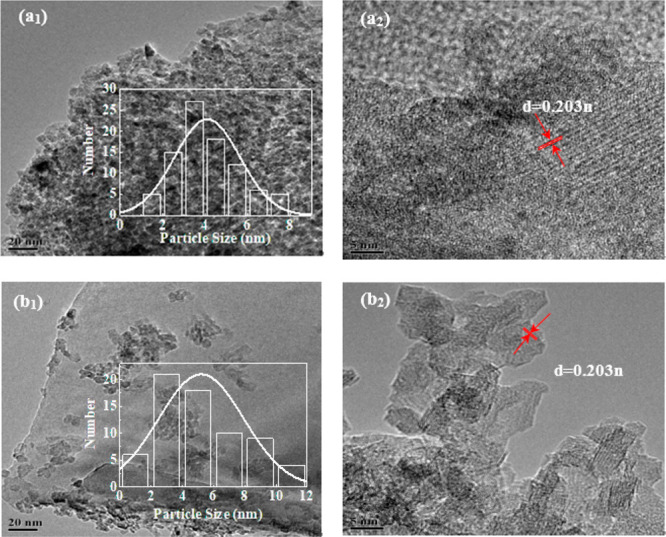
TEM diagrams of reduced catalysts: (a1), (a2) DIP-Ni/Al2O3; (b1), (b2) SG-Ni/Al2O3.
3.1.2. Crystal Phase Analysis of Catalysts
The crystal component and micrograph of catalysts were analyzed by XRD, and the model is known as XRD-7000S. The excitation source was Cu Kα radiation with a scan rate of 5°/min and the diffraction angle 2θ values ranged from 5 to 90°. The crystallite size was calculated via the Scherrer equation.
Figure 3 shows XRD patterns of the cordierite and the SG-Ni/Al2O3 and DIP-Ni/Al2O3 catalysts after reduction. It can be seen that there are no the characteristic peaks of NiO and Al2O3 for cordierite; the diffraction peaks at 2θ = 36.9, 43, and 66.7° are attributed to the alumina phase (PDF no. 50-1496); the corresponding particle sizes of Al2O3 are 26.3, 21.2, and 28.0 nm; they are present in both catalysts. Also, the diffraction peaks of the NiO phase appear at 2θ = 36.6, 62.9, and 75.4° (PDF no. 47-1049) for the DIP-Ni/Al2O3 catalyst. No NiO peak appears in the detection result of the SG-Ni/Al2O3 catalyst, but there is a very obvious reduction peak in the H2-TPR results; these results indicate that incorporation of nickel oxide occurs in the SG-Ni/Al2O3 catalyst. It is closely related to the reasons that are as follows: (1) this might happen because the diffraction peaks of Al2O3 are close to NiO in the XRD spectrum; the diffraction peak of Al2O3 covers the diffraction peak of NiO, making NiO unable to distinguish. (2) The fine NiO particles are highly dispersed on the carrier Al2O3, which is below the detection limit of the instrument, resulting in no characteristic diffraction peak of NiO in the test results.24 (3) The microporous structure of the gel itself increases the possibility of active ingredient coverage, and the coverage of the active ingredient is generated in the XRD test results, which is consistent with the TEM results in Section 3.1.1: the NiO particle agglomeration occur in the SG-Ni/Al2O3 catalyst.
Figure 3.
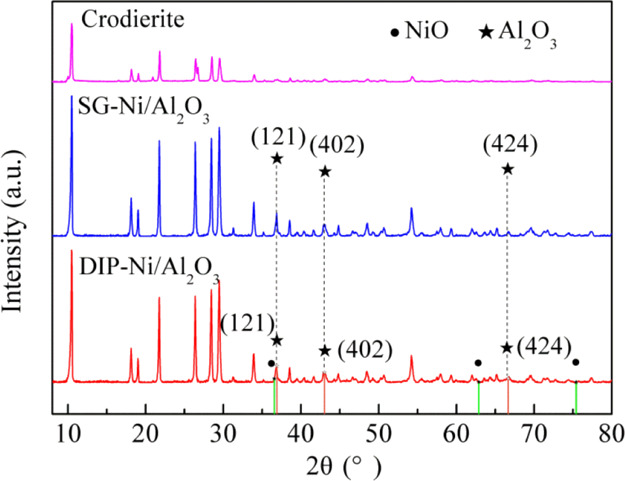
XRD patterns of the cordierite and the SG-Ni/Al2O3 and DIP-Ni/Al2O3 catalysts after reduction.
3.1.3. Active Site Analysis of Catalysts
H2-TPD can be used for quantitative analysis of active sites on catalyst samples. The experiment of H2-TPD was carried out on a PCA-1200 chemical adsorption instrument, and 100 mg of the catalyst was loaded into the reactor. First, the catalyst sample was blown by a H2 flow rate of 50 mL/min for 1 h at room temperature. After that, the gas was changed into helium for removing the physical adsorption of H2. Then, the sample was heated to 900 °C (heating rate of 20 °C/min) in helium with a flow rate of 50 mL/min.
Figure 4 shows the H2-TPD patterns of the reduced catalysts. The temperature of hydrogen desorption are different for the DIP-Ni/Al2O3 and SG-Ni/Al2O3 catalysts, as can be seen from the figure. It was reported that the hydrogen adsorption took place in the adsorption site of both the active component and carrier. The DIP-Ni/Al2O3 catalyst shows four desorption peaks at 150, 250, 330, and 480 °C, and the amount of hydrogen chemisorbed is very considerable. Research shows that the H2 desorption in the low-temperature region is from the hydrogen adsorption on highly dispersed Ni nanoparticles, whose surface often has high-density surface defects. These defect sites can be used as the capture centers of hydrogen to reduce the activation energy of hydrogen dissociation and make the methanation reaction easier.25,26 For the SG-Ni/Al2O3 catalyst, the adsorption capacities of hydrogen are obviously low, and this indicates poor dispersion of Ni. Although many nickel species are reduced at low temperature in the results of H2-TPR, the aggregation of nickel into large particles after reduction occurs, which will have a bad effect during the methanation reaction. For the DIP-Ni/Al2O3 catalyst, the desorption peaks are more obvious in the low temperature region; this indicates that the active metal Ni is highly dispersed, thereby improving the catalytic performance of CO methanation. The results are in agreement with the conclusion given by H2-TPR.
Figure 4.
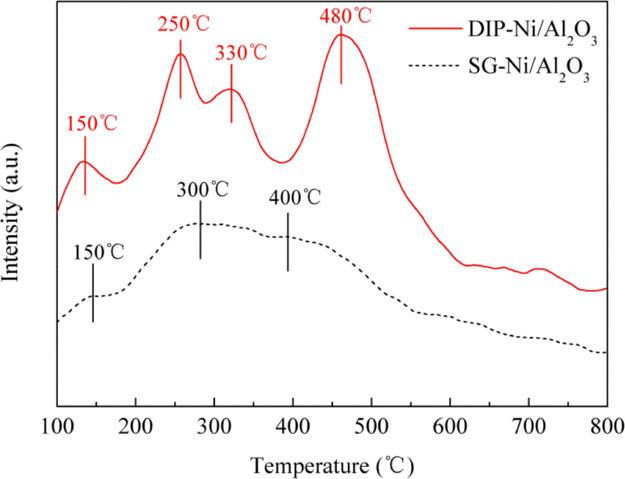
H2-TPD curves of the DIP-Ni/Al2O3 and SG-Ni/Al2O3 catalysts.
3.1.4. Reduction Characteristic Analysis of Catalysts
The reduction characteristic of the catalysts was tested and analyzed on a Micromeritics AutoChem1 II 2920 adsorption apparatus by the temperature-programmed reduction (TPR) technique. The powder form of the catalyst sample (120 mg) was heated from room temperature to 900 °C (heating rate of 10 °C/min) under 10% H2/90% He with a flow rate of 30 mL/min. The H2 concentration was estimated by TCD.
Figure 5 gives the reduction characteristic curves of the SG-Ni/Al2O3 and DIP-Ni/Al2O3 catalysts. It can be seen that the different preparation methods have a significant effect on the phase formation of the sample. According to reports in the literatures,27−30 the peak of TPR below 450 °C is due to reduction of free NiO (denoted as α peak); the peak at or above 750 °C is due to reduction of spinel NiAl2O4 (γ peak). The broad peak in temperature ranging from 450 to 750 °C (β peak) can be assigned to reduction of nonstoichiometric nickel aluminates, which are largely classified into Ni2+-rich nickel aluminate (β1 peak) and Al3+-rich nickel aluminate (β2 peak); the former has a relatively higher reducibility than the latter.
Figure 5.

H2-TPR curves of the DIP-Ni/Al2O3 and SG-Ni/Al2O3 catalysts.
In addition, the SG-Ni/Al2O3 catalyst has a strong reduction peak at 348 °C and a weak shoulder peak at 430 °C; both of them correspond to the α-NiO species. The free α-NiO interacts weakly with the carrier Al2O3, which makes NiO easy to be reduced. In addition, the migration and aggregation may occur during the reduction and methanation reactions because the α-NiO species have a large particle size, and this leads to a decrease in the effective specific surface area and catalyst activity. However, the DIP-Ni/Al2O3 catalyst has four reduction peaks, and the overall reduction temperature is higher than that of the SG-Ni/Al2O3 catalyst. Reduction peaks correspond to the Ni2+-rich nickel aluminate, Al3+-rich nickel aluminate, and stable NiAl2O4 phase; these three species have a stronger degree of interaction with the carrier, indicating the formation of hard reduced species in the DIP-Ni/Al2O3 catalyst.31,32 It is known that the strong interaction plays a key role in suppressing the metallic sintering and carbon formation. This makes the DIP-Ni/Al2O3 catalyst have good heat resistance and stability in the methanation reaction. This can be confirmed in the catalyst activity test.
3.1.5. TG Analysis of Catalysts
The TG analysis of the catalysts after the methanation reaction was carried out in the TGA/DTA system of model QMA200M. The reaction atmosphere was O2, the flow rate was 10 mL/min, and the analysis temperature was from room temperature to 900 °C. Carbon deposition on the surface of the catalyst during methanation reaction mainly comes from the CO disproportionation reaction and CH4 cracking process.33
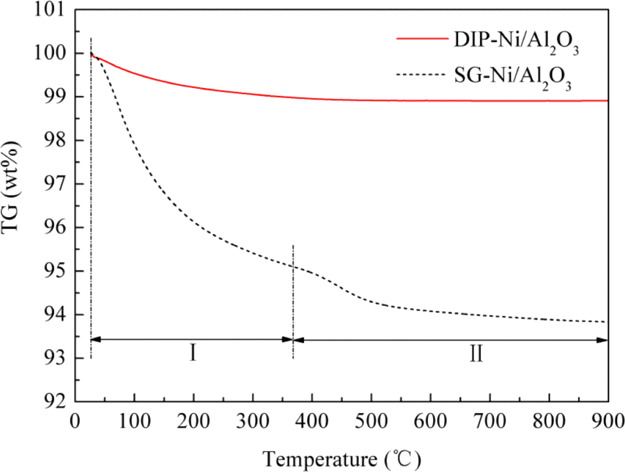
Figure 6 gives the TG curves of the catalysts after methanation. The result shows that the SG-Ni/Al2O3 and DIP-Ni/Al2O3 catalysts exhibit different degrees of weight loss. The TG curve of the SG-Ni/Al2O3 catalyst is divided into stage Ι and stage II according to the research of Li et al.34 A lot of gases and organic matter escape during the drying process in the first stage, and then the carbon attached to the surface of the catalyst is released by oxidation in the second stage. This shows that the amounts of carbon deposits of the SG-Ni/Al2O3 and DIP-Ni/Al2O3 catalysts after the methanation reaction are 1.3 and 1.2 wt %, respectively. The weight loss of the SG-Ni/Al2O3 catalyst comes mainly from the adsorbed water and structured water. It is closely related to the microporous structure of the gel itself. Massive micropores in the gel provide a large contact area during the methanation reaction process, but it also absorbs more adsorbed water and structured water at the same time. Hence, a slight carbon deposit is produced in the SG-Ni/Al2O3 catalyst.
Figure 6.
TG curves of the two catalysts after the methanation reaction.
3.2. Effect of Temperature on Methanation Performance of Catalysts
The catalysts prepared by the dipping and the sol–gel methods were used to carry out the methanation reaction of syngas H2/CO/N2 with a molar ratio of 3/1/1 and a WHSV of 10,000 mL g–1 h–1; the reaction temperature ranged from 250 to 550 °C. Figure 7 shows the effect of different reaction temperatures on the methanation performance of the catalyst. It can be seen that in the range of experimental temperature, the CO conversion rate and CH4 selectivity of the catalysts prepared by the two methods have basically the same trends, that is, both of them increase with increasing temperature between 250 and 400 °C and then decrease at 400–550 °C. The methanation performance of the SG-Ni/Al2O3 catalyst is the best at 400 °C, and the CO conversion and CH4 selectivity are 81.8 and 80.7%, respectively, which refer to the maximum values during the process of methanation reaction. While the CH4 selectivity of the DIP-Ni/Al2O3 catalyst is slightly higher at 350 °C than at 400 °C, the CO conversion is obviously higher at 400 °C. Overall, the DIP-Ni/Al2O3 catalyst has the best methanation performance at 400 °C; the CO conversion and CH4 selectivity are 98.6 and 90.9%, respectively, under the optimum condition. Xiong et al.35 studied the methanation performance of different Ni-based catalysts for pyrolysis gas of biomass; the results showed that the Ni/Al2O3 powder catalyst has the best methanation activity at 400 °C, and the CO conversion was about 85% when the volume composition of biomass pyrolysis gas was 9.98% CH4, 1.85% C2H4, 27.51% CO2, 5.18% N2, 40.17% CO, and 15.31% H2 with a space velocity of 6000 h–1. By contrast, the Ni/Al2O3 monolithic catalyst prepared with cordierite honeycomb ceramics as the substrate can effectively improve the catalytic performance of the catalyst. However, the methanation performance of the catalyst declines gradually between 400 and 550 °C. This is mainly related to the CO stability; the number of active molecules in the methanation reaction will increase with the increase of temperature to promote the reaction. However, the methanation reaction is a strongly exothermic reaction, and the high temperature is not conducive to CO conversion into methane because of the limitation of thermodynamics and the occurrence of carbon deposition reaction; hence, the methanation performance decreases.36
Figure 7.

Effect of temperature on the methanation reaction. (H2/CO/N2 = 3/1/1, WHSV = 10,000 mL g–1 h–1).
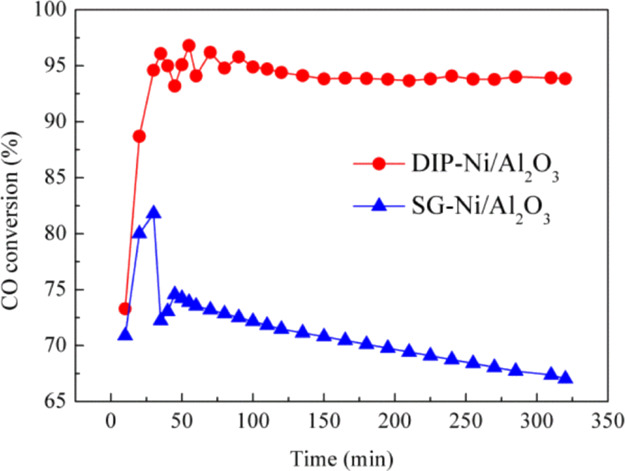
The stability of the SG-Ni/Al2O3 and DIP-Ni/Al2O3 catalysts was tested at 400 °C and a WHSV of 10,000 mL g–1 h–1, as shown in Figure 8. The DIP-Ni/Al2O3 catalyst has good stability after 25 min of the methanation reaction, and the CO conversion rate is stable around 94%. While the stability of the SG-Ni/Al2O3 catalyst gradually decreases after 25 min, and the CO conversion is only 66% when the reaction proceeds to 320 min. In summary, the Ni/Al2O3 catalyst prepared by the dipping method has higher methanation performance and good stability at 400 °C.
Figure 8.
Stability test of the methanation reaction. (H2/CO/N2 = 3/1/1, WHSV = 10,000 mL g–1 h–1).
3.3. Effect of WHSV on Methanation Performance of Catalysts
The effect of WHSV on methanation performance of the catalyst was investigated at 400 °C. The results are shown in Figure 9; it can be seen that the CO conversion and CH4 selectivity of the DIP-Ni/Al2O3 catalyst are basically maintained at around 90% with the increasing WHSV, indicating that the catalytic activity and selectivity of the catalyst prepared by the dipping method is relatively stable. However, the CO conversion and CH4 selectivity for the SG-Ni/Al2O3 catalyst show a decreasing trend; the CO conversion decreases from 81.9 to 62.7% and CH4 selectivity decreases from 73.4 to 56.2% when the WHSV increases from 6000 to 14,000 mL g–1 h–1. We know that the WHSV of the reaction gas can affect the external diffusion and thus the residence time of the reaction gas on the catalyst surface to further affect the methanation effect. The results of this study indicate that the effect of external diffusion on the catalyst gradually weakens with the gradual increase of WHSV, resulting in short residence time of feed gas on the catalyst surface and incomplete methanation reaction. In other words, part of the feed gas is taken away by the airflow before it diffuses to the inner surface of the catalyst for sufficient reaction, leading to a decrease in catalyst activity. In conclusion, the overall catalytic performance of the DIP-Ni/Al2O3 catalyst prepared by the dipping method is significantly better than that of the SG-Ni/Al2O3 catalyst prepared by the sol–gel method. Combining with characterization analysis of the catalyst, the DIP-Ni/Al2O3 catalyst has a stronger interaction between the carrier and active component. It can effectively suppress the catalytic sintering and make the catalyst with good stability. Therefore, the DIP-Ni/Al2O3 catalyst shows better methanation performance.
Figure 9.

Effect of WHSV on methanation performance of the catalyst. (H2/CO/N2 = 3/1/1, T = 400 °C, WHSV = 6000–14,000 mL g–1 h–1).
3.4. Effect of Ni Content on Methanation Performance of the Catalyst
3.4.1. Characterization of the Catalyst Structure
3.4.1.1. Analysis of Specific Surface Area and Pore Structure
N2 physical adsorption was used to characterize the specific surface area and pore structure characteristics of the reduced catalyst, which contained different Ni contents. The results are shown in Table 1 and Figure 10. The Ni/Al2O3 catalyst with 15% Ni content has the highest specific surface area, total pore volume, and average pore diameter up to 7.139 m2/g, 0.017 cm3/g, and 9.764 nm, respectively. However, the specific surface area of the Ni/Al2O3 catalyst with 10% Ni content is minimal, only 4.795 m2/g, and the total pore volume and average pore diameter are 0.016 cm3/g and 9.297 nm. It helps the gas molecules to break away from the catalyst. The specific surface area of the Ni/Al2O3 catalyst with 20% Ni content is between 15% Ni and 10% Ni.
Table 1. Physical Properties of the Reduced Catalyst.
| Ni content (mole fraction) (%) | specific surface area (m2/g) | total pore volume (cm3/g) | average pore diameter (nm) |
|---|---|---|---|
| 10 | 4.795 | 0.016 | 9.297 |
| 15 | 7.139 | 0.017 | 9.764 |
| 20 | 6.262 | 0.017 | 9.078 |
Figure 10.

Isotherms and pore size distribution results for reduced catalysts. (a) Adsorption/desorption isotherms. (b) Pore size distribution.
Figure 10 gives the N2 adsorption/desorption isotherms and pore size distribution of Barret–Joyner–Halenda adsorption for reduced catalysts. It can be seen that the adsorption and desorption isotherms of the Ni/Al2O3 catalysts with different Ni contents exhibit hysteretic loops. They belong to the typical type IV isotherms and H3 hysteresis loops. Most of the pore widths focus on 2–20 nm; this shows that the catalysts are all composed of slit-like pores formed by polymer flake particles, and internal pores of catalysts have a mesoporous characteristic.
3.4.1.2. Analysis of Microtopography
TEM characterization and particle size distribution analysis were carried out for the three catalysts with different Ni contents after reduction, and the results are shown in Figure 11. The Ni grains are not evenly distributed on the surface of the Ni/Al2O3 catalyst with 10% Ni content; the metal Ni particle size distribution ranges from 1 to 20 nm, and average particle diameter is 2.59 nm. For 15% Ni/Al2O3 and 20% Ni/Al2O3 (as shown in Figure 11b,c), the Ni particle size ranges from 0 to 8 nm and from 0 to 35 nm, respectively, and the average particle sizes are 4.10 and 11.33 nm, respectively. While, the Ni grains are uniformly distributed on the surface of the 15% Ni/Al2O3 catalyst. In summary, although the particle size of the active component of the 10% Ni/Al2O3 catalyst is small, the particle size distribution is not uniform, while the particle size of the 15% Ni/Al2O3 catalyst is smaller than that of the 20% Ni/Al2O3 catalyst, indicating that the 15% Ni/Al2O3 catalyst has a higher dispersion of Ni.
Figure 11.

TEM diagrams of reduced catalysts: (a)10% Ni/Al2O3, (b)15% Ni/Al2O3, and (c)20% Ni/Al2O3.
3.4.1.3. Analysis of the Crystal Phase
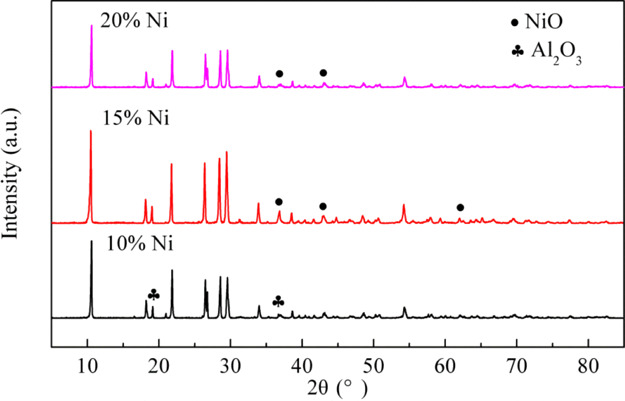
The XRD patterns of the catalysts with different Ni contents after reduction are shown in Figure 12. The diffraction peaks of Al2O3 are only detected at 18 and 37° diffraction angles for the 10% Ni/Al2O3 catalyst, and those of NiO are only detected at 37 and 43° for the 20% Ni/Al2O3 catalyst. There might be the diffraction peak of Al2O3 that coincides with that of NiO particles, and the diffraction peaks of NiO and Al2O3 are, respectively, covered by the diffraction peaks of Al2O3 and NiO. For the 15% Ni/Al2O3 catalyst, the NiO diffraction peaks are detected at 37, 43, and 62.5°. Combined with TEM results, one possible reason is the smaller particle size of the NiO particle and Al2O3 carrier, which are highly dispersed on the surface of the catalyst, and the levels are below the limit of detection for XRD. In addition, it may also be because of the NiO diffraction peak over that of Al2O3 so that Al2O3 is not detected.
Figure 12.
XRD patterns of the reduced catalysts: 10% Ni/Al2O3, 15% Ni/Al2O3, and 20% Ni/Al2O3.
3.4.1.4. Analysis of Reduction Characteristics
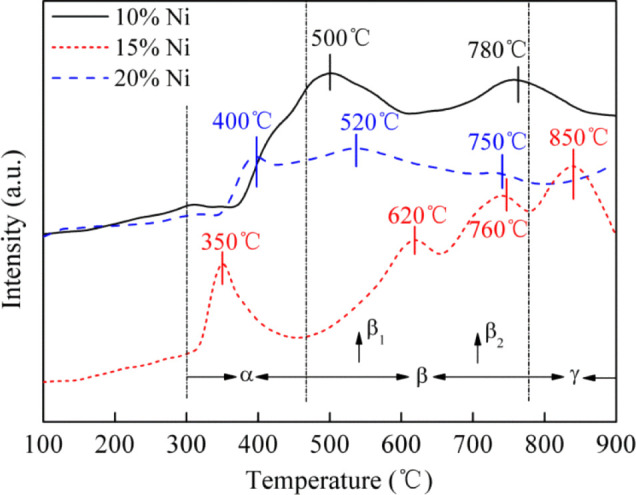
The TPR test for reduction characteristics of the three catalysts was carried out, and the results are shown in Figure 13. It is revealed that β1-type and β2-type NiO are the dominant species in the 10% Ni/Al2O3 catalyst. The above two species show a trend of transformation to α-NiO and γ-NiO in the 15% Ni/Al2O3 catalyst with the increase of Ni loading. For the 20% Ni/Al2O3 catalyst, the three reduction peaks indicate the existence of three NiO species, and the interaction between NiO and the carrier decreases correspondingly with the disappearance of γ-NiO in the 20% Ni/Al2O3 catalyst, and the reduction of NiO (NiO → Ni) occurs in the reduction reaction. Meanwhile, the results also show that the Ni loading has a great influence on the reduction characteristics of the catalysts. It affects the interaction between the active ingredients and carrier by changing the NiO species on the catalyst surface, thereby affecting the methanation reaction activity.
Figure 13.
H2-TPR curves of catalysts.
In addition, with the increase of Ni loading, the hydrogen-consuming peak gradually increased in the lower temperature region. When the Ni loading ranges from 10% Ni to 15% Ni, the reduction temperature moves toward the high-temperature region, which leads to the enhanced interaction between the species and carrier. This kind of strong interaction restrains sintering well in overreaction. However, with the further increase of Ni loading, the hydrogen-consumption peaks decrease gradually and transfer to the low-temperature section, which results in the weaker interaction between nickel oxide and the carrier. The carrier surface may be stacked with active components, which limits the “reaction site” of methanation, and this leads to easier sintering of active components.37
3.4.2. Methanation Performance of Catalysts
The effect of Ni content on the methanation performance of the catalyst was investigated under the condition that the molar ratio of H2/CO/N2 was 3/1/1, and the WHSV was 10,000 mL g–1 h–1 at 250–550 °C. The Ni-based catalysts were prepared by using the dipping method, and the mole fractions of Ni are, respectively, 10, 15, and 20%. The results are shown in Figure 14; it can be seen that whole variant trends of the CH4 selectivity and CO conversion are similar; all of them show the change in the trend of “volcanic type” for catalysts with different Ni contents. The results of the CH4 selectivity and CO conversion at 250 °C show that the feed gas of H2/CO is converted to hydrocarbons other than methane under the action of a catalyst, and it is certainly possible that the concentration of methane is below detection limit of the gas chromatograph. The CH4 selectivity and the CO conversion first increase and then decrease with increasing temperature in this study. Overall, the order of methanation performance from high to low is 15% Ni, 20% Ni, and 10% Ni, and the Ni/Al2O3 catalyst with 15% Ni content has the highest CO conversion and CH4 selectivity, 96.8 and 96%, respectively, at 400 °C; this result is consistent with the conclusions of characterization of the catalyst structure.
Figure 14.

Effect of Ni content on methanation reaction. (H2/CO/N2 = 3/1/1, WHSV = 10,000 mL g–1 h–1).
4. Conclusions
(1) The overall methanation performance of the Ni/Al2O3 catalyst prepared by the dipping method is significantly better than that of the Ni/Al2O3 catalyst prepared by the sol–gel method. The DIP-Ni/Al2O3 catalyst shows good resistance to carbon deposition and antisintering performance, showing good temperature resistance and stability.
(2) When the H2/CO molar ratio is 3/1 and the temperature is 400 °C, the CO conversion rate and CH4 selectivity of the Ni/Al2O3 catalyst prepared by the dipping method are basically stable at around 90% within the experimental WHSV range, which has better methanation performance stability.
(3) Under the reaction conditions of H2/CO molar ratio of 3/1 and WHSV of 10,000 mL g–1 h–1, the Ni/Al2O3 monolithic catalyst exhibits the best methanation performance at 400 °C. Under these conditions. The CO conversion and CH4 selectivity of the DIP-Ni/Al2O3 catalyst were 98.6 and 90.9%, respectively.
(4) The loading of nickel also has a great influence on the methanation effect. The catalyst with a loading of 20% has higher CO conversion and CH4 selectivity, and the best effect is observed at 400 °C, with a CO conversion of 96% and a CH4 selectivity of 97%.
Acknowledgments
We express our appreciation to the Scientific Research Starting Foundation for Doctor of Liaoning Province (no. 2019-BS-183), Natural Science Foundation of Liaoning Province (nos. 20180550834 and 20180551004), National Natural Science Foundation of China (no. 51808350), and Liaoning Revitalization Talents Program (no. XLYC1907114) for financial support.
The authors declare no competing financial interest.
References
- Zhou J.; Ma H.; Liu C.; Zhang H.; Ying W. High temperature methanation over Ni catalysts supported on high surface area ZnxMg1-xAl2O4: Influence on Zn loading[J]. Int. J. Hydrogen Energy 2019, 44, 13253–13261. 10.1016/j.ijhydene.2019.03.197. [DOI] [Google Scholar]
- Zhao H.; Xu C.; Wang T. Production of methane from biomass glycerol through coupling of steam reforming and methanation on Ni-Mn/Al2O3[J]. Sustainable Chem. Pharm. 2019, 13, 100150. 10.1016/j.scp.2019.100150. [DOI] [Google Scholar]
- Tao Q.; Huang S.; Yan C.; Yin L.; Zhao X. High activity Ni-Mo2C/ZrO2 catalyst dry reforming methane to syngas[J]. Taiyangneng Xuebao 2019, 40, 831–837. [Google Scholar]
- Li J.; Zhou L.; Li P.; Zhu Q.; Gao J.; Gu F.; Su F. Production of synthetic natural gas by CO methanation over Ni/Al2O3 catalyst in fluidized bed reactor[J]. Catal. Commun. 2018, 105, 37–42. [Google Scholar]
- Le T. A.; Kang J. K.; Park E. D. Active Ni/SiO2 catalysts with high Ni content for benzene hydrogenation and CO methanation[J]. Appl. Catal., A 2019, 581, 67–73. 10.1016/j.apcata.2019.05.020. [DOI] [Google Scholar]
- Wang W.; Li X.; Zhang Y.; Zhang R.; Ge H.; Bi J.; Tang M. Strong metal-support interactions between Ni and ZnO particles and their effect on the methanation performance of Ni/ZnO[J]. Catal. Sci. Technol. 2017, 7, 4413–4421. 10.1039/c7cy01119a. [DOI] [Google Scholar]
- Alihosseinzadeh A.; Nematollahi B.; Rezaei M.; Lay E. N. CO methanation over Ni catalysts supported on high surface area mesoporous nanocrystalline γ-Al2O3 for CO removal in H2-rich stream[J]. Int. J. Hydrogen Energy 2015, 40, 1809–1819. 10.1016/j.ijhydene.2014.11.138. [DOI] [Google Scholar]
- Urasaki K.; Tanpo Y.; Nagashima Y.; Kikuchi R.; Satokawa S. Effects of preparation conditions of Ni/TiO2 catalysts for selective CO methanation in the reformate gas[J]. Appl. Catal., A 2013, 453, 174–178. 10.1016/j.apcata.2012.06.021. [DOI] [Google Scholar]
- Tada S.; Shimizu T.; Kameyama H.; Haneda T.; Kikuchi R. Ni/CeO2 catalysts with high CO2 methanation activity and high CH4 selectivity at low temperatures[J]. Int. J. Hydrogen Energy 2012, 37, 5527–5531. 10.1016/j.ijhydene.2011.12.122. [DOI] [Google Scholar]
- Su X.; Xu J.; Liang B.; Duan H.; Hou B.; Huang Y. Catalytic carbon dioxide hydrogenation to methane: A review of recent studies[J]. J. Energy Chem. 2016, 25, 553–565. 10.1016/j.jechem.2016.03.009. [DOI] [Google Scholar]
- Wang X.; Zhu L.; Liu Y.; Wang S. CO2 methanation on the catalyst of Ni/MCM-41 promoted with CeO2[J]. Sci. Total Environ. 2018, 625, 686–695. 10.1016/j.scitotenv.2017.12.308. [DOI] [PubMed] [Google Scholar]
- Liu B.; Nan S.; Wang J.; Lv D.; Li X. Methanation of CO in hydrogen-rich gas on Ni–Ru/SiO2 catalyst: The type of active sites and Ni–Ru synergistic effect[J]. Chem. Eng. J. 2016, 304, 476–484. 10.1016/j.cej.2016.06.113. [DOI] [Google Scholar]
- Ambrožová N.; Edelmannová M.; Troppová I.; Kocí K.; Valášková M. Photocatalytic Decomposition of N2O Over Ceramics Cordierite/CeO2 Nanoparticles[J]. J. Nanosci. Nanotechnol. 2019, 19, 7339–7344. [DOI] [PubMed] [Google Scholar]
- Khani Y.; Bahadoran F.; Safari N.; Soltanali S.; Taheri S. A. Hydrogen production from steam reforming of methanol over Cu-based catalysts: The behavior of ZnxLaxAl1-xO4 and ZnO/La2O3/Al2O3 lined on cordierite monolith reactors[J]. Int. J. Hydrogen Energy 2019, 44, 11824–11837. 10.1016/j.ijhydene.2019.03.031. [DOI] [Google Scholar]
- Yuan J.; Zhao K.; Cai T.; Gao Z.; Yang L.; He D. One-step dip-coating of uniform γ-Al2O3 layers on cordierite honeycombs and its environmental applications[J]. Ceram. Int. 2016, 42, 14384–14390. 10.1016/j.ceramint.2016.06.003. [DOI] [Google Scholar]
- Grzybek G.; Stelmachowski P.; Indyka P.; Inger M.; Wilk M.; Kotarba A.; Sojka Z. Cobalt-zinc spinel dispersed over cordierite monoliths for catalytic N2O abatement from nitric acid plants[J]. Catal. Today 2015, 257, 93–97. 10.1016/j.cattod.2015.02.022. [DOI] [Google Scholar]
- Sollier B. M.; Gómez L. E.; Boix A. V.; Miró E. E. Oxidative coupling of methane on cordierite monoliths coated with Sr/La2O3 catalysts. Influence of honeycomb structure and catalyst-cordierite chemical interactions on the catalytic behavior[J]. Appl. Catal., A 2018, 550, 113–121. 10.1016/j.apcata.2017.10.023. [DOI] [Google Scholar]
- Zhu Y.; Yu L.; Wang X.; Zhou Y.; Ye H. A novel monolithic Pd catalyst supported on cordierite with graphene coating[J]. Catal. Commun. 2013, 40, 98–102. 10.1016/j.catcom.2013.06.018. [DOI] [Google Scholar]
- Khani Y.; Bahadoran F.; Soltanali S.; Ahari J. S. Hydrogen production by methanol steam reforming on a cordierite monolith reactor coated with Cu-Ni/LaZnAlO4 and Cu-Ni/γ-Al2O3 catalysts[J]. Res. Chem. Intermed. 2018, 44, 925–942. 10.1007/s11164-017-3144-8. [DOI] [Google Scholar]
- Romero-Sáez M.; Dongil A. B.; Benito N.; Espinoza-González R.; Escalona N.; Gracia F. CO2 methanation over nickel-ZrO2 catalyst supported on carbon nanotubes: A comparison between two impregnation strategies[J]. Appl. Catal., B 2018, 237, 817–825. 10.1016/j.apcatb.2018.06.045. [DOI] [Google Scholar]
- Mohammad Z.; Zarringhalam M.; Mehdi A. The influence of nickel loading on reducibility of NiO/Al2O3 catalysts synthesized by sol-gel method[J]. Chem. Eng. Res. Bull. 2010, 14, 97–102. 10.3329/cerb.v14i2.5052. [DOI] [Google Scholar]
- Ocampo F.; Louis B.; Roger A.-C. Methanation of carbon dioxide over nickel-based Ce0.72Zr0.28O2 mixed oxide catalysts prepared by sol-gel method[J]. Appl. Catal., A 2009, 369, 90–96. 10.1016/j.apcata.2009.09.005. [DOI] [Google Scholar]
- Hwang S.; Hong U. G.; Lee J.; Baik J. H.; Koh D. J.; Lim H.; Song I. K. Methanation of carbon dioxide over mesoporous nickele Mealumina (M=Fe, Zr, Ni, Y, and Mg) xerogel catalysts: effect of second metal[J]. Catal. Lett. 2012, 142, 860–868. 10.1007/s10562-012-0842-0. [DOI] [Google Scholar]
- Sengupta S.; Ray K.; Deo G. Effects of modifying Ni/Al2O3 catalyst with cobalt on the reforming of CH4 with CO2 and cracking of CH4 reactions[J]. Int. J. Hydrogen Energy 2014, 39, 11462–11472. 10.1016/j.ijhydene.2014.05.058. [DOI] [Google Scholar]
- Hu X. F.; Yang W.; Wang N.; Luo S. Z.; Chu W. Catalytic Properties of Ni/CNTs and Ca-Promoted Ni/CNTs for Methanation Reaction of Carbon Dioxide[J]. Adv. Mater. Res. 2014, 924, 217–226. 10.4028/www.scientific.net/amr.924.217. [DOI] [Google Scholar]
- Li D.; Xi M.; Tao X.; Shi X.; Dai X.; Yin Y. TPD Studies on Ni/γ-Al2O3 Catalysts Reduced by Atmosphere Plasma[J]. Chin. J. Catal. 2008, 29, 287–291. [Google Scholar]
- Alihosseinzadeh A.; Nematollahi B.; Rezaei M.; Lay E. N. CO methanation over Ni catalysts supported on high surface area mesoporous nanocrystalline γ-Al2O3 for CO removal in H2-rich stream[J]. Int. J. Hydrogen Energy 2015, 40, 1809–1819. 10.1016/j.ijhydene.2014.11.138. [DOI] [Google Scholar]
- Zhao A.; Ying W.; Zhang H.; Ma H.; Fang D. Ni-Al2O3 catalysts prepared by solution combustion method for syngas methanation[J]. Catal. Commun. 2012, 17, 34–38. 10.1016/j.catcom.2011.10.010. [DOI] [Google Scholar]
- Guo C.; Wu Y.; Qin H.; Zhang J. CO methanation over ZrO2/Al2O3 supported Ni catalysts: a comprehensive study[J]. Fuel Process. Technol. 2014, 124, 61–69. 10.1016/j.fuproc.2014.02.017. [DOI] [Google Scholar]
- Li C.; Chen Y.-W. Temperature-programmed-reduction studies of nickel oxide/alumina catalysts: effects of the preparation method[J]. Thermochim. Acta 1995, 256, 457–465. 10.1016/0040-6031(94)02177-p. [DOI] [Google Scholar]
- Akia M.; Alavi S. M.; Rezaei M.; Yan Z.-F. Optimizing the sol-gel parameters on the synthesis of mesostructure nanocrystalline γ-Al2O3[J]. Microporous Mesoporous Mater. 2009, 122, 72–78. 10.1016/j.micromeso.2009.02.008. [DOI] [Google Scholar]
- Khalesi A.; Arandiyan H. R.; Parvari M. Production of syngas by CO2 reforming on MxLa1-xNi0.3Al0.7O3-d (M=Li, Na, K) catalysts[J]. Ind. Eng. Chem. Res. 2008, 47, 5892–5898. 10.1021/ie800111e. [DOI] [Google Scholar]
- Shinde V.; Giridhar M. CO Methanation toward the Production of Synthetic Natural Gas over Highly Active Ni/TiO2 Catalyst[J]. AIChE J. 2014, 60, 1027–1035. 10.1002/aic.14304. [DOI] [Google Scholar]
- Li X.; Mou W.; Li K.; Zhang S.; Guo Y.; Wu X.; Li Z. Preparation and denitration performance of Mn-Ce/(CC-A)@12TiO2 monolithic honeycomb catalyst[J]. Yingyong Huagong 2018, 047, 2329–2335. [Google Scholar]
- Xiong W.; Ding M.; Tu J.; Chen L.; Wang T.; Zhang Q.; Ma L. Methanation of biomass pyrolysis gas with different support Ni- basedcatalysts[J]. Ranliao Huaxue Xuebao 2014, 42, 958–964. [Google Scholar]
- Zhang G.; Peng J.; Sun T.; Wang S. Effects of the oxidation extent of the SiC surface on the performance of Ni/SiC methanation catalysts[J]. Chin. J. Catal. 2013, 34, 1745–1755. 10.1016/s1872-2067(12)60639-1. [DOI] [Google Scholar]
- Hu D.; Gao J.; Ping Y.; Jia L.; Gunawan P.; Zhong Z.; Xu G.; Gu F.; Su F. Enhanced Investigation of CO Methanation over Ni/Al2O3 Catalysts for Synthetic Natural Gas Production[J]. Ind. Eng. Chem. Res. 2012, 51, 4875–4886. 10.1021/ie300049f. [DOI] [Google Scholar]