

Abstract

Oil palm trunk (OPT) represents one of the five main oil palm biomass wastes with high carbon content that can be economically converted to a large surface area, porous activated carbon (AC) adsorbent to treat palm oil mill effluent wastewater in Indonesia and Malaysia. In the first portion of this work, the design of the experiment was used to determine the optimum set of synthesis parameters required to maximize the iodine number of AC [i.e., Brunauer–Emmett–Teller (BET) specific surface area indicator] prepared from OPT via chemical activation route using H3PO4. The iodine numbers of AC and AC yield were probed as the impregnation ratio, the activation time, and the activation temperature were varied in the range of 0.28–3.47, 5.68–69.32 min, and 379–521 °C, respectively. An impregnation ratio of 2.29, an activation time of 6 min, and an activation temperature of 450 °C were identified as the optimum set of synthesis parameters. In the second portion of the work, the AC synthesized using the optimum parameters were then characterized and tested as an adsorbent for tannin. N2 sorption results revealed that the AC exhibits type IV isotherm, that is, contains micropores and mesopores and displays a relatively high BET specific surface area of 1657 m2 g–1. Adsorption equilibria isotherms for tannin adsorption onto the AC were collected at three different pH of 2, 4, and 6 and were nonlinearly fitted using Langmuir and Freundlich isotherm models, where the Langmuir isotherm gave better fitting than Freundlich. The higher adsorption capacity at lower pH can be explained in terms of the absence of electrostatic repulsion interaction between the AC surface and the tannic acid species as suggested by the point of zero charges (pHpzc) of 4.8 and an increasing ionization of tannic acid with pH rise between 4 and 7. Adsorption kinetics data were also obtained at four different pH of 2, 4, 6, and 8 where the nonlinear pseudo-first-order model best fitted the kinetic at pH of 2 and the nonlinear pseudo-second-order model represented the kinetic best at the remaining higher pH, which suggests that tannin adsorption onto AC occurred by physisorption at pH of 2 and by chemisorption at pH of 4, 6, and 8.
Introduction
Malaysia is the second leading nation in the global production of palm oil.1 In 2017, for example, approximately 21 million tonnes of palm oil were generated in Malaysia, which translates to the production of 52.5 million m3 palm oil mill effluent (POME) over this particular year.1 POME is an oily acidic brownish wastewater generated by the palm oil processing mills, which contains approximately (by volume) 95–96% water, 0.6–0.7% oil, and 4–5% total solids (that includes 2–4% suspended solids with high chemical oxygen demand, biological oxygen demand, and color intensity).2 The high color intensity in POME mainly comes from the presence of tannin (i.e., dark-colored noncrystalline compound commonly found in plants), lignin (i.e., brown-colored organic polymer compound generally deposited in the cell walls of most plants that provides their structural support), and other organic matters such as humic acids and carotene. These compounds are the products of the decomposition of lignocellulosic materials during palm oil processing.3,4 The presence of these dark-colored compounds in POME is not desirable since they reduce the photosynthesis activity required and prohibit the growth of aquatic living organisms if discharged into the marine habitat. The colored compound present may chelate with metal ions and become directly toxic to the aquatic biota.5 Therefore, these compounds should be removed from POME before releasing it to the environment to avoid harmful effects on living beings.
Several processes have been developed to remove contaminants from POME such as ponding system, membrane filtration, and coagulation–flocculation.3 While the ponding system requires long retention time, membrane filtration and coagulation–flocculation require high capital and/or operational cost. It is more attractive to offset the cost associated with POME treatment by exploiting the oil palm biomass waste generated within the oil palm industry itself for such treatment. To this end, adsorption using the adsorbent made from oil palm biomass waste can be promising. There are five main oil palm biomass wastes, that is, oil palm trunk (OPT), oil palm frond, empty fruit bunches (EFB), palm kernel shell (PKS), and mesocarp fiber.6,7 Among these five biomasses, OPT has a relatively high carbon content of around 35–44% and a low inorganic mineral content of around 2–4%,8,9 which shows its potential as the precursor for an activated carbon (AC) adsorbent. OPT has received less attention in research studies compared to the other four oil palm biomass wastes.
Adsorption is a surface phenomenon in which the contaminant (defined as adsorbate) comes into contact with a high surface area porous solid (defined as adsorbent) and becomes deposited on the solid (adsorbent) surface because of the presence of physical bonding (e.g., van der Waals force) and/or chemical bonding between the adsorbate and the adsorbent.10 Relative to the other aforementioned processes, adsorption in the liquid phase provides unique advantages in terms of low operation cost and simple operating procedure.11 AC, in particular, can be made from the carbon-containing precursor, which displays high adsorption capacity and close to complete removal efficiency for certain organic compounds. The adsorption capacity of AC, however, strongly depends on the activation method and the nature of the precursor.12 Generally, chemical activation (i.e., thermal decomposition of the precursor that is impregnated with a chemical agent to convert carbon precursor into a porous material) route enables the production of AC with higher porosity, surface area, and yield within shorter processing time using lower temperature relative to the physical activation (where a physical agent instead of a chemical agent is used) route.13,14 The chemical activating agent selected in this work is phosphoric acid (H3PO4) since it enables lower activation temperature during synthesis and gives higher AC yield compared to the other chemical agents [e.g., potassium hydroxide (KOH)].15
Back in 1997, Mohan and Karthikeyan reported the performance of commercial AC to adsorb tannin and lignin as individual adsorbate components.5 Since then, there have been no subsequent studies that determine the performance of AC made from oil palm biomass waste such as OPT to adsorb these two components. While the works of Mohammed and Mohammed and Chong evaluated the performance of PKS and EFB-derived AC and banana peel-derived AC, respectively, for tannin and lignin-containing POME decolorization, their works do not provide insights into the adsorption performance of these ACs to adsorb targeted compounds (i.e., tannin and lignin as individual components).16,17 Therefore, in this work, we report the synthesis and characterization of OPT-derived AC to remove tannin or lignin separately from tannin or lignin-containing aqueous solution. We studied the effect of activation time, activation temperature, and impregnation ratio (IR) on the iodine number of the resultant AC and used Design-Expert software to determine the optimum combination of these three variables that gives the highest iodine number. Iodine number has been widely used as a quick estimator of the porosity of AC according to ASTM D-94 and the work of Mianowski et al.18,19 It has previously been shown that the Brunauer–Emmett–Teller (BET) specific surface area (SSA) of AC exhibits linear relationship with the SSA determined from the iodine number for BET SSA below 1000 m2 g–1.18,19 The morphology, BET surface area, functional groups, and thermal stability of the AC synthesized using the optimum variables were subsequently characterized. The major part of this work then focuses on the performance of OPT-derived AC for tannin adsorption, where the effect of pH, initial adsorbate concentration, and adsorption time were evaluated. Pseudo-first-order and pseudo-second-order kinetic models were utilized to correlate the adsorption kinetics data. Langmuir and Freundlich models were used to correlate the adsorption equilibrium data.
Results and Discussion
Iodine Number and Yield as Functions of Synthesis Parameters
The three main parameters that influence the porous properties of AC in the chemical activation process are IR, activation time, and temperature.20,21 Therefore, these three parameters were statistically varied to determine the set of parameters that gives AC with the highest iodine number.
Activation Time
Figure 1 shows the effect of activation time on the yield and iodine number of AC. The IR and the activation temperature were kept constant at 1.88 and 450 °C, respectively, while the activation time was varied. An increase in the activation time from 5.68 to 37.5 min leads to a steep decrease in the AC yield from 45.49 to 43.22% and in iodine number from 881.08 to 835.73 mg g–1, while further increase in the activation time from 37.5 to 69.32 min provides a marginal decrease in the AC yield from 43.22 to 42.82% and in the iodine number from 835.73 to 812.39 (Figure 1). We postulated that at 450 °C, char structure was well developed over short activation duration of up to 5.68 min, as evidenced by the highest AC yield and iodine number obtained at the end of 5.68 min (Figure 1). The steep decrease in AC yield and iodine number between 5.68 and 37.5 min likely comes from the rapid diffusion and release of volatile compounds from the pores, the breakage of the bonds within the carbon structure, and the collapse of micropores (to form mesopores and macropores).22 Beyond 37.5 min, almost all volatile compounds were already removed, thus resulting in a negligible reduction in AC yield while bond breakage and pore collapse still continued, thus giving a further noticeable reduction in the iodine number. For the sake of obtaining the maximum AC yield and iodine number, the shortest activation time of 5.68 min is desirable.
Figure 1.
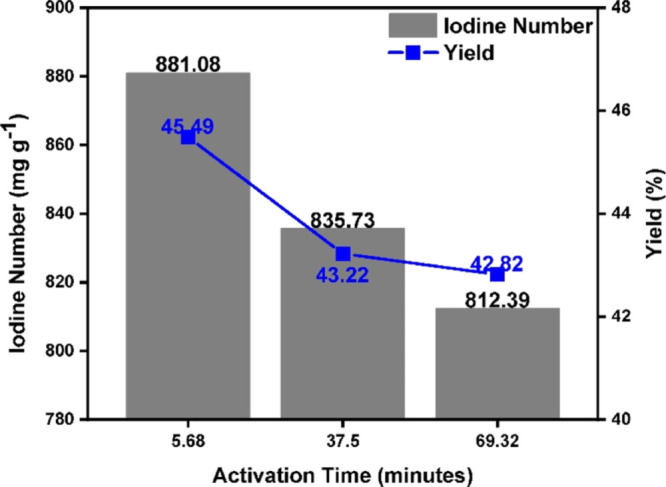
Iodine number and yield as a function of activation time up to 69.32 min.
Activation Temperature
Figure 2 shows the effect of activation temperature on the yield and iodine number of AC. The IR and the activation time were maintained constant at 1.88 and 37.5 min, respectively, while the activation temperature was changed. Activation temperature rise from 379.29 to 520.71 °C leads to a linear decrease in the AC yield from 49.64 to 45.24% (Figure 2). Such a decrease in the AC yield can be attributed to the aromatic condensation reaction that took place among the adjacent molecules and the generation and subsequent release of gaseous products such as H2O, CO, CO2, and CH4, the extent of which increases at higher temperature.23 This temperature rise, however, translates to an optimum trend in iodine number where the highest iodine number of 835.73 was obtained at 450 °C (Figure 2). Minor increment of iodine number with temperature rise from 379.29 to 450 °C suggests this temperature range as an appropriate temperature range for activation process, whereby the presence of phosphoric acid facilitates the depolymerization, dehydration, and redistribution of the constituent biopolymers of OPT (i.e., cellulose, hemicellulose, and lignin) and catalyzes the conversion of aliphatic to aromatic compounds, which promotes the formation of higher porosity and surface area.24 Beyond 450 °C nonetheless, a secondary contraction of the structure occurred due to the thermal degradation of phosphate bonds, which reduces the crosslinking density to facilitate the growth and alignment of polyaromatic clusters. A more densely packed and less porous structure was created, which translates to a relatively low iodine number.
Figure 2.
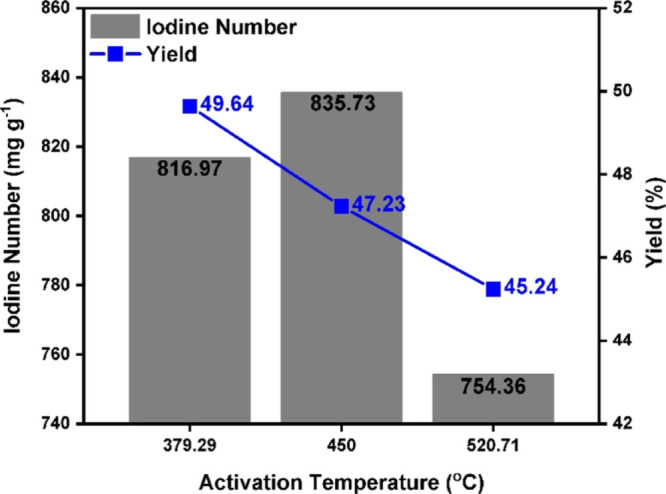
Iodine number and yield as a function of activation temperature up to 520.71 °C.
IR
Figure 3 shows the effect of IR on the yield and iodine number of AC. The activation temperature and the activation time were kept constant at 37.5 min and 450 °C, respectively, while the IR was modified. An increase in the IR from 0.28 to 3.47 generates a linear decrease in the AC yield from 46.61 to 42.27% (Figure 3). Such a trend can be rationalized in terms of the enhanced reaction rate at a higher concentration of activating agent as widely observed elsewhere also.25 Increasing the IR by 6.7-fold from 0.28 to 1.88 generated 72.8% increase in the iodine number from 500.1 to 864.1 (Figure 3). Such an increase in the iodine number likely reflects the formation of micropores due to the removal of tars from the precursor.26 When the IR was increased further by 1.8-fold from 1.88 to 3.47, however 4.3% reduction in iodine number from 864.1 to 826.56 occurred (Figure 3). It is likely that at such excessive loading of phosphoric acid, the collapse of micropores became dominant. Based on the trend shown in Figure 3, an IR between 1.88 and 3.47 can be selected.
Figure 3.

Iodine number and yield as a function of IR up to 3.47.
Using the relationships between the iodine number and activation time, activation temperature, and IR, Design-Expert software determined an IR of 2.29, an activation time of 6 min, and an activation temperature of 450 °C as an optimum combination of parameters that will give the highest iodine number.27 The results from response surface methodology (RSM) analysis are listed in Tables S1–S7 in the Supporting Information. Using these chosen parameters, we repeated the synthesis of OPT-derived AC three times. The results are reproducible, where the generated ACs had an average iodine number of 950.95 mg g–1 and exhibited only 1.4% variation from the average value. We have also confirmed that the iodine number exhibited a linear relationship with the BET specific surface area within the range of 600 to 1450 m2 g–1, the plot of which is displayed in Figure S1 in the Supporting Information. To this end, we will use OPT-derived AC synthesized using these parameters for subsequent adsorption of tannin from aqueous solution.
Optimum Synthesis Parameters
An activation time of 6 min, an activation temperature of 450 °C, and an IR of 2.29 were identified as the optimum set of synthesis parameters that provides the most optimum iodine number among the rest of the parameters set generated (Table S7 in Supporting Information). AC synthesized using this set of parameters was characterized in the subsequent sections and used for adsorption of tannin from aqueous solution.
Table 1 provides a summary of the proximate compositions and the iodine number as well as the BET surface area, the total pore volume, and the average pore diameter of the OPT from Barret–Joyner–Halenda (BJH) analysis. The raw OPT contains high volatile matter content and low ash content. According to Rafatullah et al.,28 AC precursor with high volatile matter content is desirable as the volatile matters would be removed during the carbonization and activation process under high temperature, which gives rise to pore formation. Volatile matter content in AC was reduced by almost 5 times relative to that in its precursor (Table 1). Moreover, low ash (or inorganic constituents) content is also desirable since their presence may restrict pore formation during the activation process. The efficacy of the activation process to create a porous structure is indicated by a significant increase in the surface area by up to 3 orders of magnitude, that is, from 0.9 to 1657 m2 g–1 (Table 1).
Table 1. Proximate Compositions, Iodine Number, and N2 Sorption Results of Raw OPT and OPT-Derived AC.
| characteristics | raw OPT | OPT-derived AC |
|---|---|---|
| ash (%) | 2.95 | 4.96 |
| fixed carbon content (%) | 24.62 | 80.18 |
| moisture content (%) | 9.80 | 0.33 |
| volatile matter (%) | 72.43 | 14.86 |
| iodine number (mg g–1) | 950.95 | |
| BET surface area (m2 g–1) | 0.8886 | 1657.06 |
| total pore volume (cm3 g–1) | 0.0037 | 1.53 |
| average pore diameter (nm) | 42.4 | 4.75 |
Characterization
OPT-derived AC synthesized using an activation time of 6 min, an activation temperature of 450 °C, and an IR of 2.29 was subjected to further characterizations to evaluate its physicochemical properties in relation to its performance to adsorb tannin in aqueous solution.
Surface and Pore Characteristics
Figure 4a,c shows the scanning electron microscopy images of raw OPT and OPT-derived AC, respectively, while Figure 4b,d displays the magnification into the red dashed square sections indicated in Figure 4a,c, respectively. Irregular, incomplete elliptical holes with different diameters that range from 5 to 50 μm can be observed on the surface of OPT-derived AC (Figure 4c,d), which are absent on the surface of raw OPT (Figure 4a,b). These holes were formed by the evaporation of phosphoric acid during carbonization. Numerous relatively flat agglomerates of globules instead are present on the surface of raw OPT (Figure 4a,b). These observations highlight the absence of porous structure in raw OPT, which is present in OPT-derived AC.
Figure 4.

Scanning electron microscopy images and the respective magnifications of (a,b) raw OPT and (c,d) OPT-derived AC; (e) N2 adsorption–desorption isotherm of OPT-derived AC; (f) pore size distribution derived from the BJH analysis of the N2 isotherm.
Figure 4e displays the N2 adsorption–desorption isotherm of OPT-derived AC, and Figure 4f displays the respective pore size distribution obtained by the BJH method. The existence of slant to the right curve at the low P/P0 range and the hysteresis loop at the medium to high P/P0 range are characteristics of type IV isotherm in IUPAC classification (Figure 4e), which indicates the presence of micropores (pores with size less than 2 nm or 20 Å) and mesopores (pores with size between 2 and 50 nm or 20 and 500 Å) (Figure 4f).29,30 The hysteresis loop has relatively low steepness and can be categorized into H4 hysteresis loop, which suggests that the mesopores consist of narrow slit-like pores or particles with internal voids of irregular shape and broad size distribution.31,32 The BET specific surface area of OPT-derived AC was 1657 m2 g–1 (see OPT-derived AC in Table 1). This is comparable to the BET surface area of commercial AC, which typically varies from 800 to 1500 m2 g–1.33 The BET surface area of OPT-derived AC in this work is higher than that reported for OPT-derived AC made via ZnCl2 activation (1102 m2 g–1) and OPT-derived AC made via physical activation (1084 m2 g–1).34,35 OPT-derived AC synthesized via phosphoric acid activation by Hussein et al. nonetheless generated slightly higher BET surface area (1764 m2 g–1) since it is subjected to further treatment with CO2 after activation.36
After tannin adsorption, the surface area of OPT-derived AC was reduced by 50% from 1657 to 835 m2 g–1, while the pore volume was reduced by 39% from 1.53 to 0.93 cm3 g–1, although the pore size distribution of AC subjected to tannin adsorption looks identical to that of the fresh one shown in Figure 4f.
Surface Functional Groups and Point of Zero Charges (pHpzc)
Fourier transform infrared (FTIR) spectroscopy was performed to identify the surface functional groups of OPT-derived AC. Figure 5a(i),(ii) displays the FTIR spectra of OPT-derived AC before and after the adsorption of tannin at pH of 4, respectively, at the wavenumber range of 400–4000 cm–1. The bands at 720 and 819 cm–1 correspond to the C–H out-of-plane stretching [Figure 5a(i)].37 The presence of this C–H band as well as an intense C–O band at 1085 cm–1 indicates the presence of lignin remains in OPT-derived AC [Figure 5a(i)].38,39 The bands that come out between 1500 and 1640 cm–1 are characteristics of the stretching vibration of the asymmetric and symmetric COO groups from the deprotonated carboxylate functional groups of cellulose.38 The band that appears at around 1710 cm–1 likely comes from the stretching vibration of C=O bonds, which can be attributed to the aliphatic ketone, carboxylic acid, conjugated acid, or conjugated aldehyde.40,41 The presence of an intense band at 2345 cm–1 can be attributed to several different origins, for example, O=C=O (CO2) stretching, N=C=O (isocyanate) stretching, C≡N (nitrile) stretching, or C≡C (alkyne) stretching, the real contributor of which cannot be determined using FTIR alone.42 The insignificant presence of CO2 in the FTIR instrument chamber and the reduction of this peak after tannin adsorption do not seem to support the notion that CO2 is the contributing factor. The broad peak at 3430 cm–1, on the other hand, can be ascribed to the presence of adsorbed water on the surface of AC.
Figure 5.

(a) FTIR spectra for OPT-derived AC: (i) before and (ii) after adsorption of tannin; (b) determination of pHpzc of OPT-derived AC.
After tannin adsorption, the intensities of the bands at 720 and 819 cm–1 from C–H bonds and that at 1085 cm–1 from C–O bonds were reduced [compare Figure 5a(i),(ii)], which suggests the active role of these bonds in the adsorption process.43 Changes in bands are also observed between 1500 and 1640 cm–1, which suggests the change in COO– environment due to the electrostatic forces of attraction between negatively charged carboxylate ions and tannate ions.38 Likewise, the reduction in the intensities of the bands at 1710 and 2345 cm–1 suggest the participation or breakage of C=O and N=C=O, C≡N, or C≡C bonds during the adsorption process.42 The changes occurring in bands between 3040 and 3600 cm–1, on the other hand, can be best attributed to the complexation of tannate ions with the ionized O–H group of free hydroxyl groups, that is, O–H groups in the carboxylic acids in the inter- and intramolecular hydrogen bonding of polymeric compounds such as alcohols, phenols, and carboxylic acids in pectin, cellulose, and lignin.44
Point of zero charge (pHpzc) is defined as the pH at which the surface of the adsorbent is wholly neutral (i.e., it contains as much positively charged as negatively charged surface functions). Thus, if the solution pH measured is below its pHpzc, the surface functional groups of the adsorbent will be protonated by excess protons, causing the anion to be the desirable adsorbate for adsorption. Conversely, if the solution pH measured is above its pHpzc, the surface functional groups will be deprotonated by hydroxide ions, making it desirable to attract the cation.45Figure 5b displays the plot used to determine the point of zero charges, where a pHpzc value of 4.8 was obtained for OPT-derived AC. In this context, if the solution pH is below 4.8, OPT-derived AC will have a positively charged surface. On the other hand, if the solution pH is above 4.8, the AC will have a negatively charge surface.
Adsorption Equilibria Isotherms
Figure 6 shows the experimental adsorption equilibria data of tannin onto OPT-derived AC at three different solution pH of 2, 4, and 6 in the form of dot points. These data were fitted using Langmuir and Freundlich isotherm models via the nonlinear method, respectively, in Figure 6a,b. The isotherm fits are shown as dashed lines. These two models are discussed briefly below.
Figure 6.

Nonlinear fitting of the experimental adsorption equilibria data at three different solution pH of 2, 4, and 6 by the (a) Langmuir isotherm model and (b) Freundlich isotherm model. Experimental data is indicated by dot points, and isotherm fits are shown by dashed lines.
Langmuir isotherm shown in eq 1 assumes monolayer adsorption onto the adsorbent surface, which contains a finite number of uniform adsorption sites.46 The adsorption process takes place through an identical mechanism with no interaction between the adsorbed molecules. Langmuir isotherm is characterized by a plateau curve, which means that no adsorption occurs after equilibrium is achieved.
| 1 |
where qm (mg g–1) is the maximum adsorption capacity and KL (L mg–1) is the Langmuir isotherm constant.
Freundlich isotherm, shown in eq 2, on the other hand, is an empirical equation developed from an assumption that the sorption occurs on a heterogeneous surface or that the adsorption affinity of the adsorbate varies over the adsorbent surface.47 This isotherm also assumes that the stronger binding sites are occupied first and that the binding strength decreases with increasing degree of site occupation.48
| 2 |
where KF and n are the Freundlich constant of adsorption affinity [mg g–1 (L mg–1)1/n] and the degree of heterogeneity of the system, respectively. The adsorption favorability can be determined by the n value where it is favorable if 2 < n < 10, moderate if 1 < n < 2, or unfavorable if n < 1. If the n value is larger than 10, the adsorption isotherm is considered nonreversible.49
Table 2 summarizes the obtained parameter values and reliability indicators from the nonlinear fitting. Comparison between the results for Langmuir and Freundlich isotherms, in particular, the adjusted coefficient of determination (COD), that is, Adj R2, indicates that Langmuir isotherm performed better than Freundlich isotherm, as also can be observed from the better isotherm fitting in Figure 6a relative to that in Figure 6b. RL values for the fitted Langmuir isotherms at three different solution pH of 2, 4, and 6 lie between 0 and 1, which indicate their favorable adsorption nature.
Table 2. Adsorption Equilibrium Isotherm Parameters for Tannin Adsorption onto OPT-Derived AC Obtained from Nonlinear Fitting and Reliability Indicators.
| Langmuir |
Freundlich |
||||||
|---|---|---|---|---|---|---|---|
| adsorbate | pH | qmax (mg g–1) | KL (L mg–1) | Adj R2 | n–1 | Kf (mg g–1) (L mg–1)1/n | Adj R2 |
| tannin | 2 | 1047.47 | 0.0783 | 0.9953 | 0.7248 | 85.6352 | 0.9989 |
| 4 | 1087.28 | 0.0082 | 0.9942 | 0.7762 | 14.2409 | 0.9855 | |
| 6 | 681.41 | 0.0293 | 0.9866 | 0.6106 | 34.1891 | 0.9563 | |
Langmuir results indicate that significantly higher adsorption performance was obtained at a low pH range with maximum adsorption capacities of 1047.47 and 1087.28 mg g–1 at pH of 2 and 4, respectively, relative to that of 681.41 mg g–1 at pH of 6. The higher adsorption performance at pH of 4 and below can be rationalized in terms of the more favorable interaction between the adsorbent and the adsorbate in the former relative to the latter. Tannic acid is a weak organic acid, the ionization tendency of which depends on the solution pH.50 Tannic acid is present in its neutral form with an oxidation state of close to 0 at solution pH below 4.5. With increasing pH above 4, the ionization tendency of tannic acid increases in parallel and becomes complete at around pH 7.50 At pH below pHpzc of 4.8, that is, pH of 2 and 4, AC has a positively charged surface, and so the adsorption of neutral tannic acid likely takes place via hydrogen bonding and organic partition instead of electrostatic interaction as illustrated in Figure S2(a) in the Supporting Information.51 At pH above pHpzc of 4.8, that is, pH of 6, on the other hand, AC has a negatively charged surface. At this pH, the concentration of negatively charged anions from tannic acid ionization is relatively high, which leads to the existence of electrostatic repulsion between the anions and the negatively charged AC surface as illustrated in Figure S2(b). The absence of such repulsion in pH 2 and pH 4 cases explains their better adsorbate–adsorbent interaction. The phenomenon observed here is consistent with those reported by other researchers.5,51−53
Adsorption Kinetics
Adsorption kinetics is expressed as the rate of solute removal at a particular time, the characteristic of which controls the time required for a particular adsorption process. Figure 7 shows the experimental adsorption kinetics data of tannin onto OPT-derived AC at four different solution pH of 2, 4, 6, and 8 in the form of dot points. These data were fitted using nonlinear pseudo-first-order (PFO) and pseudo-second-order (PSO) kinetic models, respectively, in Figure 7a,b. The kinetic fits are shown as dashed lines. Linear intraparticle diffusion (IPD) model was then applied to determine whether the IPD is a rate-limiting step in the adsorption kinetics, the results of which are displayed in Figure S3 in the Supporting Information. These three models are discussed briefly below.
Figure 7.

Fitting of the experimental adsorption kinetics data at four different solution pH of 2, 4, 6, and 8 by nonlinear (a) pseudo-first-order model and (b) pseudo-second-order model. Experimental data is indicated by dot points, and isotherm fits are shown by dashed lines. The insets provide magnification into the initial time region between 0 and 10 min, where a rapid increase in qt was obtained at pH below 8.
A general expression of PFO model presented by Lagergren is expressed in eq 3.54
| 3 |
where qe and qt are the amounts of adsorbate uptake per mass of adsorbent at equilibrium and at any time t (min), respectively, whereas k1 (min–1) is the rate constant of PFO equation. Integrating eq 3 with boundary conditions of qt = 0 at t = 0 and qe = qt at t = t leads to the linear equation shown in eq 4.
| 4 |
Equation 4 can be rearranged to its nonlinear form shown in eq 5.
| 5 |
The general expression of PSO model, on the other hand, is expressed in eq 6.55
| 6 |
where qe and qt are the amounts of adsorbate uptake per mass of adsorbent at equilibrium and at any time t (min), respectively, whereas k2 [g (mg min–1)] is the rate constant of PSO equation. Integration of eq 6 with boundary conditions of qt = 0 at t = 0 and qe = qt at t = t leads to the linear equation shown in eq 7.
| 7 |
Equation 7 can be rearranged to its nonlinear form shown in eq 8.
| 8 |
Since PFO and PSO do not provide any information on the diffusion mechanism of the adsorption system, a linear IPD model was applied, which is shown in eq 9.56
| 9 |
where C (mg g–1) is the intercept and ki is the IPD rate constant (mg g–1 min–1/2). Equation 9 suggests that the plot of the average particle loading, qt (mg g–1), against the square root of time, t1/2 (min1/2), should yield a straight line passing through the coordinate (0,C) if the IPD is the only rate-limiting factor.57
The fitting reliability of the model was determined using the adjusted COD, that is, Adj R2, instead of the conventional COD, R2, and the standard deviation, Δq (%), which can be calculated using eq 10.58 The best fitting model should have simultaneously high Adj R2 that is close to 1 and low Δq such that the predicted adsorption capacity, qtcal, is close to the experimentally derived value, qtexp.
| 10 |
where qtexp and qtcal are the experimental and calculated adsorption capacities, respectively, and n is the number of data points.
In Figure 7a,b, two different regions can be observed at different time ranges, that is, region 1 in which there is a rapid uptake of adsorbate onto the surface of the adsorbent followed by region 2 in which the adsorption process slows down and the adsorption capacity reaches its plateau. The fitting of the kinetics data does not include the data in region 2 to avoid the methodological bias.59 Inspection into the data fitting in both Figure 7a,b indicates equally identical good fitting, which makes it difficult to determine which one is better, thus requiring detailed inspection into the parameter values and reliability indicators.
Table 3 summarizes the obtained parameter values and reliability indicators from the fitting using linear and nonlinear equations forms of PFO and PSO. Nonlinear PFO and PSO gave better fitting results as indicated by the simultaneously higher Adj R2 and lower Δq compared to their linear analogues. The use of nonlinear kinetics models over their linear counterparts has been recommended, given the lower error propagation for the former relative to the latter.60 The kinetics data at pH of 2 exhibits the best fitting using a nonlinear PFO model while those at pH of 4, 6, and 8 are best fitted using a nonlinear PSO model. We observed that the experimental data and PFO model only correlate well within the adsorption contact time duration of 20–30 min.61 Good fitting with the PFO model generally indicates the dominance of physisorption, while good fitting with the PSO model suggests the dominance of chemisorption.62 Thus, adsorption of tannin onto OPT-derived AC occurs by physisorption at pH of 2 and by chemical bonding of the functional groups on the tannic acid with those on the AC surface (i.e., the sharing or exchange of electrons between the adsorbent and the adsorbate through covalent bonding) at pH of 4–8. Such a change in the bonding mechanism with increasing pH is consistent with the increasing ionization extent of tannin with increasing pH between pH 4 and 7 and the fact that AC has positive charge below pH of 4.8 as discussed before, although physical and chemical adsorption may become indistinguishable in certain circumstances.61 Furthermore, the obtained k values for PFO and PSO kinetic models here are higher at pH closer to the pHpzc than the rest of the pH studied, which suggests that the adsorption process is faster when tannin was present in its neutral form.
Table 3. Adsorption Kinetics Parameters for Tannin Adsorption onto OPT-Derived AC Obtained from the Fitting and Reliability Indicators.
| PFO Lagergren63 |
PSO Ho
and McKay55 |
|||||||||
|---|---|---|---|---|---|---|---|---|---|---|
| pH | qtexp (mg g–1) | k1 (min–1) | qtcal (mg g–1) | Adj R2 | Δq (%) | k2 [g (mg min)−1] | qtcal (mg g–1) | Adj R2 | Δq (%) | |
| linear equation | 2 | 24.71 | 0.0108 | 0.53 | 0.5268 | 7.522 | 0.26 | 24.98 | 0.9990 | 0.083 |
| 4 | 23.73 | 0.0085 | 1.54 | 0.5912 | 7.195 | 0.07 | 24.01 | 0.9990 | 0.091 | |
| 6 | 23.22 | 0.0055 | 0.98 | 0.3064 | 7.366 | 0.06 | 23.55 | 0.9990 | 0.108 | |
| 8 | 22.41 | 0.0079 | 5.32 | 0.7409 | 5.866 | 0.02 | 22.43 | 0.9880 | 0.007 | |
| nonlinear equation | 2 | 24.71 | 2.70 | 24.78 | 0.9997 | 0.023 | 0.61 | 24.95 | 0.9995 | 0.075 |
| 4 | 23.73 | 2.75 | 23.51 | 0.9946 | 0.072 | 0.65 | 23.56 | 0.9987 | 0.054 | |
| 6 | 22.63 | 2.66 | 23.12 | 0.9935 | 0.033 | 0.44 | 23.28 | 0.9985 | 0.020 | |
| 8 | 22.41 | 0.85 | 19.98 | 0.8592 | 0.834 | 0.07 | 20.97 | 0.9487 | 0.495 | |
The adsorption kinetics data modeled using a linear IPD model (Figure S3) do not seem to fit the linear relationship suggested by the model, which indicates that the IPD is not the rate-limiting factor in the tannin adsorption onto OPT-derived AC.
Conclusions
This work has demonstrated the application of design of experiment via the use of RSM method to pinpoint the optimum set of values for the IR, the activation time, and the activation temperature required to obtain AC with the highest iodine number (and thus BET SSA) from OPT via H3PO4 chemical activation route. The linear correlation between the iodine number and BET SSA was shown in the iodine number range of 500–1000 to validate the use of iodine number as an indicator for SSA. The optimum set of synthesis parameters here (i.e., an IR of 2.29, an activation time of 6 min, and an activation temperature of 450 °C) may be of interest for industrial “waste-to-wealth” AC production in Indonesia and Malaysia.
The applicability of OPT-derived AC to remove tannin in aqueous solution was further evaluated by collecting the adsorption equilibria isotherms and kinetics data at different pH between 2 and 6. The AC showed the highest adsorption capacity at pH of 4, which can be explained in terms of its positively charged surface and the low concentration of negatively charged tannic acid species at this pH. Our literature survey indicated that POME has a pH of around 4.5, which supports the suitability of OPT-derived AC to remove tannin in such effluent wastewater. Adsorption kinetics results additionally revealed physisorption as a dominant adsorption mechanism at pH of 2 and chemisorption as the dominant mechanism at pH between 4 and 8. Poor-fitting of the kinetics data to the IPD model negates the hypothesis that IPD is the only rate-limiting step for tannin adsorption onto OPT-derived AC.
Materials and Methods
Materials
OPT was obtained from an oil palm estate located at Kota Samarahan, Kuching, Sarawak. Prior to use, OPT was dried at 105 °C for 24 h to remove moisture content. Then, it was crushed and screened with No. 16 mesh sieves to obtain the size fraction ranging from 0.3 to 1.18 mm. Tannin (tannic acid, ACS reagent) was purchased from Sigma Aldrich. Table S8 in the Supporting Information lists the physicochemical and structure information of tannic acid. Hydrochloric acid (HCl), sodium hydroxide (NaOH), and phosphoric acid (H3PO4) were also purchased from Sigma-Aldrich. All reagents were of analytical grade and used directly without further purification. All solutions were prepared with distilled water.
Preparation of OPT-Based AC
The preparation of AC from OPT was performed by chemical activation. Phosphoric acid was used as a chemical activating agent. The preparation procedure of AC via chemical activation was performed according to the work of Lim et al.64 as follows: 5 g of dried OPT was mixed with the required volume of phosphoric acid. The amount of phosphoric acid used was adjusted according to the IR, that is, the weight ratio of the phosphoric acid (without solvent) used to the raw material. Then, distilled water was added to the OPT until it is covered completely with water to facilitate the absorption of phosphoric acid by the sample. The phosphoric acid amount was adjusted based on the desired IR. Then, the sample was left overnight at room temperature. Subsequently, it was dried at 100 °C for 24 h to remove the excess water and allow complete absorption of phosphoric acid by the OPT.
The resultant OPT sample was then subjected to semicarbonization at 170 °C in an oven for 1 h. The semicarbonized sample was then taken out of the oven and left to cool to room temperature before activation. Following this, the sample was heated in a muffle furnace at 450 °C for 6 min. The collected AC was then washed with distilled water until the conductivity of the wash liquor became less than 50 μS. After that, the samples were dried at 105 °C in an oven for 24 h. The collected AC was finally ground into a fine powder and stored in a desiccator for further use.
Design of Experiment
An experimental test matrix for identification of the optimized synthesis parameter of OPT-derived AC that will give the largest iodine number was obtained using the RSM method via Design-Expert Software (i.e., statistical software specially used to perform the design of experiments). RSM was selected to generate the test matrix to optimize the response of interest that is affected by several independent variables, and the central composite design module under RSM was selected for data optimization.27 The experimental design was a 22 full-factorial central composite experimental plan with three variables of interest to be investigated, that is, factor A, IR, factor B, activation time (Act. Time), and factor C, activation temperature (Act. Temp). In this study, the experimental test matrix consisted of 15 trials with different values of parameters, and the value of the dependent response was the mean of two replications. The iodine number of OPT-derived AC was the response to be optimized. Statistical analysis of the model was performed to evaluate the analysis of variance.
Iodine Number of AC
Iodine number corresponds to the milligrams of iodine that can be adsorbed by 1 g of the adsorbent. This test was performed to evaluate the adsorption property of the OPT-derived AC. Iodine number of AC has been considered as a quantitative indicator of the porosity of AC, which can be used to approximate its surface area. The iodine number test was performed according to the standard procedure.18
Physical Characterization
Field emission scanning electron microscopy images were obtained using a JEOL JSM-6400F microscope at 20 kV. The BET surface area was measured via the N2 adsorption–desorption method using a Quadrasorb surface analyzer at 77 K (−196 °C). The OPT-based AC sample was degassed at 250 °C for 3 h before BET analysis, whereas the raw OPT sample was degassed at 90 °C for 3 h followed by 24 h degassing at 105 °C before the BET analysis. The surface area (SBET) was calculated using the BET method, and the pore size distribution was determined using the BJH method.
Chemical Characterization
FTIR analysis was performed using a Fourier transform infrared spectrometer (Shimadzu, FTIR 8400-S) as a qualitative analysis to identify the surface functional groups of OPT-based AC before and after the adsorption process. The surface charge behavior of OPT-based AC in water was determined by obtaining the point of zero charge (pHPZC) of AC using the pH-drift method as described in detail elsewhere.65
Batch Adsorption Experiments
Batch adsorption experiments were performed in a Memmert shaking water bath at a constant temperature of 30 °C. Approximately, 0.2 g of AC was added to 100 mL of aqueous solution in a 250 mL conical flask containing a particular initial concentration of tannin at different pH values between 2 and 6. The solution pH was altered with the addition of 0.1 M HCl or 0.1 M NaOH. At the end of the desired contact time, the conical flask was taken out of the shaker, and the suspension was immediately filtered with a Whatman 42 filter paper. The liquid was analyzed for residual color concentration at the maximum wavelength of 270 nm for tannin using a UV–vis spectrophotometer. All experiments were carried out in duplicate, and the average values were recorded. The relative deviations were generally within 5%. Adsorbed tannin and lignin at equilibrium condition per unit adsorbent (qe) was calculated using eq 11.
| 11 |
where qe is the amount of adsorbate adsorbed at equilibrium (mg g–1), C0 and Ce are the initial and equilibrium concentrations of the adsorbate in the solution (mg L–1), respectively, m is the mass of the adsorbent used (g), and V is the volume of the aqueous solution collected (L).
Acknowledgments
This work was enabled by the funding support from Swinburne Sarawak Research Grant awarded to Jiuan Jing Chew (2-5536). The authors would like to thank Ker Jun Lau for performing several parts of the experimental and characterization works featured here as part of her Final Year Research Project. The authors would like to acknowledge funding and research facilities support from the Research Centre for Physics, Indonesian Institute of Sciences (LIPI), Gd. 440-442 Kawasan Puspiptek Serpong, South Tangerang, 15314 Banten, Indonesia.
Supporting Information Available
The Supporting Information is available free of charge at https://pubs.acs.org/doi/10.1021/acsomega.0c03811.
Relationship between the BET surface area and the iodine number; mechanism of tannin adsorption; adsorption kinetics of tannin fitted by the IPD model; RSM analysis; parameter optimization and experimental verification; and physicochemical and structure information of tannin (PDF)
The authors declare no competing financial interest.
Supplementary Material
References
- Iskandar M. J.; Baharum A.; Anuar F. H.; Othaman R. Palm oil industry in South East Asia and the effluent treatment technology—A review. Environ. Technol. Innov. 2018, 9, 169–185. 10.1016/j.eti.2017.11.003. [DOI] [Google Scholar]
- Ahmad A. L.; Bhatia S.; Ibrahim N.; Sumathi S. Adsorption of residual oil from palm oil mill effluent using rubber powder. Braz. J. Chem. Eng. 2005, 22, 371–379. 10.1590/s0104-66322005000300006. [DOI] [Google Scholar]
- Zainal N. H.; Jalani N. F.; Mamat R.; Aziz A. A. A review on the development of palm oil mill effluent (POME) final discharge polishing treatments. J. Oil Palm Res. 2017, 29, 528–540. 10.21894/jopr.2017.00012. [DOI] [Google Scholar]
- Zainal N. H.; Jalani N. F.; Mamat R.; Aziz A. A. A review on the development of Palm Oil Mill Effluent (POME) final discharge polishing treatments. J. Oil Palm Res. 2017, 29, 528–540. 10.21894/jopr.2017.00012. [DOI] [Google Scholar]
- Mohan S. V.; Karthikeyan J. Removal of lignin and tannin colour from aqueous solution by adsorption onto activated charcoal. Environ. Pollut. 1997, 97, 183–187. 10.1016/s0269-7491(97)00025-0. [DOI] [PubMed] [Google Scholar]
- Mestre A. S.; Pires J.; Nogueira J. M. F.; Carvalho A. P. Activated carbons for the adsorption of ibuprofen. Carbon 2007, 45, 1979–1988. 10.1016/j.carbon.2007.06.005. [DOI] [Google Scholar]
- Samiran N. A.; Jaafar M. N. M.; Chong C. T.; Jo-Han N. A review of palm oil biomass as a feedstock for syngas fuel technology. J. Teknol. 2015, 72, 13–18. 10.11113/jt.v72.3932. [DOI] [Google Scholar]
- Abdul Khalil H. P. S.; Siti Alwani M.; Ridzuan R.; Kamarudin H.; Khairul A. Chemical composition, morphological characteristics, and cell wall structure of Malaysian oil palm fibers. Polym.-Plast. Technol. Eng. 2008, 47, 273–280. 10.1080/03602550701866840. [DOI] [Google Scholar]
- Nasser R.; Salem M.; Hiziroglu S.; Al-Mefarrej H.; Mohareb A.; Alam M.; Aref I. Chemical analysis of different parts of date palm (Phoenix dactylifera L.) using ultimate, proximate and thermo-gravimetric techniques for energy production. Energies 2016, 9, 374. 10.3390/en9050374. [DOI] [Google Scholar]
- Mohamed N. R.Adsorption technique for the removal of organic pollutants from water and wastewater. Organic Pollutants-Monitoring, Risk and Treatment; InTech, 2013. [Google Scholar]
- Mehta D.; Mazumdar S.; Singh S. K. Magnetic adsorbents for the treatment of water/wastewater—a review. J. Water Process. Eng. 2015, 7, 244–265. 10.1016/j.jwpe.2015.07.001. [DOI] [Google Scholar]
- Baccar R.; Bouzid J.; Feki M.; Montiel A. Preparation of activated carbon from Tunisian olive-waste cakes and its application for adsorption of heavy metal ions. J. Hazard. Mater. 2009, 162, 1522–1529. 10.1016/j.jhazmat.2008.06.041. [DOI] [PubMed] [Google Scholar]
- Rodríguez-Reinoso F.; Molina-Sabio M. Activated carbons from lignocellulosic materials by chemical and/or physical activation: an overview. Carbon 1992, 30, 1111–1118. 10.1016/0008-6223(92)90143-k. [DOI] [Google Scholar]
- Soleimani M.; Kaghazchi T. Agricultural waste conversion to activated carbon by chemical activation with phosphoric acid. Chem. Eng. Technol. 2007, 30, 649–654. 10.1002/ceat.200600325. [DOI] [Google Scholar]
- Pourhashemi A.Engineering Materials: Applied Research and Evaluation Methods; Apple Academic Press, 2014. [Google Scholar]
- Mohammed R. R. Decolorisation of biologically treated palm oil mill effluent (POME) using adsorption technique. Int. Refereed J. Eng. Sci. 2013, 2, 1–11. [Google Scholar]
- Mohammed R. R.; Chong M. F. Treatment and decolorization of biologically treated Palm Oil Mill Effluent (POME) using banana peel as novel biosorbent. J. Environ. Manage. 2014, 132, 237–249. 10.1016/j.jenvman.2013.11.031. [DOI] [PubMed] [Google Scholar]
- D4607-94, ASTM Standard test method for determination of iodine number of activated carbon. Standard Test Method for Determination of Iodine Number of Activated Carbon; ASTM International: West Conshohocken, PA, 2006. [Google Scholar]
- Mianowski A.; Owczarek M.; Marecka A. Surface area of activated carbon determined by the iodine adsorption number. Energy Sources, Part A 2007, 29, 839–850. 10.1080/00908310500430901. [DOI] [Google Scholar]
- Ahmadpour A.; Do D. D. The preparation of activated carbon from macadamia nutshell by chemical activation. Carbon 1997, 35, 1723–1732. 10.1016/s0008-6223(97)00127-9. [DOI] [Google Scholar]
- Caturla F.; Molina-Sabio M.; Rodríguez-Reinoso F. Preparation of activated carbon by chemical activation with ZnCl2. Carbon 1991, 29, 999–1007. 10.1016/0008-6223(91)90179-m. [DOI] [Google Scholar]
- Xu J.; Chen L.; Qu H.; Jiao Y.; Xie J.; Xing G. Preparation and characterization of activated carbon from reedy grass leaves by chemical activation with H3PO4. Appl. Surf. Sci. 2014, 320, 674–680. 10.1016/j.apsusc.2014.08.178. [DOI] [Google Scholar]
- Jagtoyen M.; Derbyshire F. Activated carbons from yellow poplar and white oak by H3PO4 activation. Carbon 1998, 36, 1085–1097. 10.1016/s0008-6223(98)00082-7. [DOI] [Google Scholar]
- Teng H.; Yeh T.-S.; Hsu L.-Y. Preparation of activated carbon from bituminous coal with phosphoric acid activation. Carbon 1998, 36, 1387–1395. 10.1016/s0008-6223(98)00127-4. [DOI] [Google Scholar]
- Nahil M. A.; Williams P. T. Pore characteristics of activated carbons from the phosphoric acid chemical activation of cotton stalks. Biomass Bioenergy 2012, 37, 142–149. 10.1016/j.biombioe.2011.12.019. [DOI] [Google Scholar]
- Timur S.; Ikizoglu E.; Yanik J. Preparation of activated carbons from Oreganum stalks by chemical activation. Energy Fuels 2006, 20, 2636–2641. 10.1021/ef060219k. [DOI] [Google Scholar]
- Montgomery D. C.Design and analysis of experiments; John Wiley & Sons, 2017. [Google Scholar]
- Rafatullah M.; Ahmad T.; Ghazali A.; Sulaiman O.; Danish M.; Hashim R. Oil palm biomass as a precursor of activated carbons: a review. Crit. Rev. Environ. Sci. Technol. 2013, 43, 1117–1161. 10.1080/10934529.2011.627039. [DOI] [Google Scholar]
- Kruk M.; Jaroniec M. Gas adsorption characterization of ordered organic–inorganic nanocomposite materials. Chem. Mater. 2001, 13, 3169–3183. 10.1021/cm0101069. [DOI] [Google Scholar]
- Thommes M.; Kaneko K.; Neimark A. V.; Olivier J. P.; Rodriguez-Reinoso F.; Rouquerol J.; Sing K. S. W. Physisorption of gases, with special reference to the evaluation of surface area and pore size distribution (IUPAC Technical Report). Pure Appl. Chem. 2015, 87, 1051–1069. 10.1515/pac-2014-1117. [DOI] [Google Scholar]
- Prahas D.; Kartika Y.; Indraswati N.; Ismadji S. The use of activated carbon prepared from jackfruit (Artocarpus heterophyllus) peel waste for methylene blue removal. J. Environ. Prot. Sci. 2008, 2, 1–10. [Google Scholar]
- Sing K. S. W. Reporting physisorption data for GAS/SOLID systems with special reference to the determination of surface area and porosity. Pure Appl. Chem. 1985, 57, 603–619. 10.1351/pac198557040603. [DOI] [Google Scholar]
- Hu Z.; Srinivasan M. P. Preparation of high-surface-area activated carbons from coconut shell. Microporous Mesoporous Mater. 1999, 27, 11–18. 10.1016/s1387-1811(98)00183-8. [DOI] [Google Scholar]
- Hussein M. Z.; Zainal Z.; Ibrahim R.; Kheong K. K.; Muhammad B. The preparation of activated carbons from chips of oil palm trunk catalysed by ZnCl2/CO2: surface area and porosity studies. J. Chem. Technol. Biotechnol. 1995, 64, 35–40. 10.1002/jctb.280640107. [DOI] [Google Scholar]
- Ahmad A.; Loh M.; Aziz J. Preparation and characterization of activated carbon from oil palm wood and its evaluation on methylene blue adsorption. Dyes Pigm. 2007, 75, 263–272. 10.1016/j.dyepig.2006.05.034. [DOI] [Google Scholar]
- Hussein M. Z. B.; Rahman M. B. B. A.; Yahaya A. H.; Hin T.-Y. Y.; Ahmad N. Oil palm trunk as a raw material for activated carbon production. J. Porous Mater. 2001, 8, 327–334. 10.1023/a:1013173216800. [DOI] [Google Scholar]
- Guo J.; Lua A. C. Textural and chemical properties of adsorbent prepared from palm shell by phosphoric acid activation. Mater. Chem. Phys. 2003, 80, 114–119. 10.1016/s0254-0584(02)00383-8. [DOI] [Google Scholar]
- Farinella N. V.; Matos G. D.; Arruda M. A. Z. Grape bagasse as a potential biosorbent of metals in effluent treatments. Bioresour. Technol. 2007, 98, 1940–1946. 10.1016/j.biortech.2006.07.043. [DOI] [PubMed] [Google Scholar]
- Pasquali C. E. L.; Herrera H. Pyrolysis of lignin and IR analysis of residues. Thermochim. Acta 1997, 293, 39–46. 10.1016/s0040-6031(97)00059-2. [DOI] [Google Scholar]
- Li F. T.; Yang H.; Zhao Y.; Xu R. Novel modified pectin for heavy metal adsorption. Chin. Chem. Lett. 2007, 18, 325–328. 10.1016/j.cclet.2007.01.034. [DOI] [Google Scholar]
- Solum M. S.; Pugmire R. J.; Jagtoyen M.; Derbyshire F. Evolution of carbon structure in chemically activated wood. Carbon 1995, 33, 1247–1254. 10.1016/0008-6223(95)00067-n. [DOI] [Google Scholar]
- Coates J.Interpretation of Infrared Spectra, A Practical Approach. Encyclopedia of Analytical Chemistry, 2006. [Google Scholar]
- Tripathi P.; Srivastava V. C.; Kumar A. Optimization of an azo dye batch adsorption parameters using Box–Behnken design. Desalination 2009, 249, 1273–1279. 10.1016/j.desal.2009.03.010. [DOI] [Google Scholar]
- Gnanasambandam R.; Proctor A. Determination of pectin degree of esterification by diffuse reflectance Fourier transform infrared spectroscopy. Food Chem. 2000, 68, 327–332. 10.1016/s0308-8146(99)00191-0. [DOI] [PubMed] [Google Scholar]
- Kubilay Ş.; Gürkan R.; Savran A.; Şahan T. Removal of Cu (II), Zn (II) and Co (II) ions from aqueous solutions by adsorption onto natural bentonite. Adsorption 2007, 13, 41–51. 10.1007/s10450-007-9003-y. [DOI] [Google Scholar]
- Boparai H. K.; Joseph M.; O’Carroll D. M. Kinetics and thermodynamics of cadmium ion removal by adsorption onto nano zerovalent iron particles. J. Hazard. Mater. 2011, 186, 458–465. 10.1016/j.jhazmat.2010.11.029. [DOI] [PubMed] [Google Scholar]
- Adamson A. W.; Gast A. P.. Physical chemistry of surfaces; Interscience publishers: New York, 1967; Vol. 150. [Google Scholar]
- Vijayaraghavan K.; Padmesh T.; Palanivelu K.; Velan M. Biosorption of nickel (II) ions onto Sargassum wightii: application of two-parameter and three-parameter isotherm models. J. Hazard. Mater. 2006, 133, 304–308. 10.1016/j.jhazmat.2005.10.016. [DOI] [PubMed] [Google Scholar]
- Mckay G.; Blair H. S.; Gardner J. R. Adsorption of dyes on chitin. I. Equilibrium studies. J. Appl. Polym. Sci. 1982, 27, 3043–3057. 10.1002/app.1982.070270827. [DOI] [Google Scholar]
- An J.-H.; Dultz S. Adsorption of tannic acid on chitosan-montmorillonite as a function of pH and surface charge properties. Appl. Clay Sci. 2007, 36, 256–264. 10.1016/j.clay.2006.11.001. [DOI] [Google Scholar]
- Lin J.; Zhan Y.; Zhu Z.; Xing Y. Adsorption of tannic acid from aqueous solution onto surfactant-modified zeolite. J. Hazard. Mater. 2011, 193, 102–111. 10.1016/j.jhazmat.2011.07.035. [DOI] [PubMed] [Google Scholar]
- Anirudhan T. S.; Suchithra P. S. Adsorptive characteristics of tannin removal from aqueous solutions and coir industry effluents using calcined and uncalcined hydrotalcites. Ind. Eng. Chem. Res. 2007, 46, 4606–4613. 10.1021/ie061519s. [DOI] [Google Scholar]
- Sarıcı-Özdemir Ç.; Önal Y. Equilibrium, kinetic and thermodynamic adsorptions of the environmental pollutant tannic acid onto activated carbon. Desalination 2010, 251, 146–152. 10.1016/j.desal.2009.09.133. [DOI] [Google Scholar]
- Ho Y. S.; McKay G. The sorption of lead (II) ions on peat. Water Res. 1999, 33, 578–584. 10.1016/s0043-1354(98)00207-3. [DOI] [Google Scholar]
- Ho Y. S.; McKay G. Pseudo-second order model for sorption processes. Process Biochem. 1999, 34, 451–465. 10.1016/s0032-9592(98)00112-5. [DOI] [Google Scholar]
- Weber W. J.; Morris J. C. Kinetics of adsorption on carbon from solution. J. Sanit. Eng. Div., Am. Soc. Civ. Eng. 1963, 89, 31–60. [Google Scholar]
- Crini G.; Peindy H.; Gimbert F.; Robert C. Removal of CI Basic Green 4 (Malachite Green) from aqueous solutions by adsorption using cyclodextrin-based adsorbent: Kinetic and equilibrium studies. Sep. Purif. Technol. 2007, 53, 97–110. 10.1016/j.seppur.2006.06.018. [DOI] [Google Scholar]
- Jabbari V.; Veleta J. M.; Zarei-Chaleshtori M.; Gardea-Torresdey J.; Villagrán D. Green synthesis of magnetic MOF@GO and MOF@CNT hybrid nanocomposites with high adsorption capacity towards organic pollutants. Chem. Eng. J. 2016, 304, 774–783. 10.1016/j.cej.2016.06.034. [DOI] [Google Scholar]
- Simonin J.-P. On the comparison of pseudo-first order and pseudo-second order rate laws in the modeling of adsorption kinetics. Chem. Eng. J. 2016, 300, 254–263. 10.1016/j.cej.2016.04.079. [DOI] [Google Scholar]
- Moussout H.; Ahlafi H.; Aazza M.; Maghat H. Critical of linear and nonlinear equations of pseudo-first order and pseudo-second order kinetic models. Karbala Int. J. Mod. Sci. 2018, 4, 244–254. 10.1016/j.kijoms.2018.04.001. [DOI] [Google Scholar]
- Bulut E.; Özacar M.; Şengil İ. A. Adsorption of malachite green onto bentonite: equilibrium and kinetic studies and process design. Microporous Mesoporous Mater. 2008, 115, 234–246. 10.1016/j.micromeso.2008.01.039. [DOI] [Google Scholar]
- Ho Y. Review of second-order models for adsorption systems. J. Hazard. Mater. 2006, 136, 681–689. 10.1016/j.jhazmat.2005.12.043. [DOI] [PubMed] [Google Scholar]
- Lagergren S. K. About the theory of so-called adsorption of soluble substances. Sven. Vetenskapsakad. Handingarl 1898, 24, 1–39. [Google Scholar]
- Lim W. C.; Srinivasakannan C.; Balasubramanian N. Activation of palm shells by phosphoric acid impregnation for high yielding activated carbon. J. Anal. Appl. Pyrolysis 2010, 88, 181–186. 10.1016/j.jaap.2010.04.004. [DOI] [Google Scholar]
- Rivera-Utrilla J.; Bautista-Toledo I.; Ferro-García M. A.; Moreno-Castilla C. Activated carbon surface modifications by adsorption of bacteria and their effect on aqueous lead adsorption. J. Chem. Technol. Biotechnol. 2001, 76, 1209–1215. 10.1002/jctb.506. [DOI] [Google Scholar]
Associated Data
This section collects any data citations, data availability statements, or supplementary materials included in this article.