

Abstract
The interocean transfer of thermocline water between the Indian and the Atlantic Oceans known as ‘Agulhas leakage’ is of global significance as it influences the Atlantic Meridional Overturning Circulation (AMOC) on different time scales. Variability in the Agulhas Current regime is key in shaping hydroclimate on the adjacent coastal areas of the African continent today as well as during past climates. However, the lack of long, continuous records from the proximal Agulhas Current region dating beyond the last glacial cycle prevents elucidation of its role in regional and wider global climate changes. This is the first continuous record of hydrographic variability (SST; δ18Osw) from the Agulhas Current core region spanning the past 270,000 years. The data set is analytical sound and provides a solid age model. As such, it can be used by paleoclimate scientists, archaeologists, and climate modelers to evaluate, for example, linkages between the Agulhas Current system and AMOC dynamics, as well as connections between ocean heat transport and Southern African climate change in the past and its impact on human evolution.
Subject terms: Palaeoclimate, Palaeoceanography
| Measurement(s) | temperature of sea surface • salinity |
| Technology Type(s) | gas chromatography of ketone fractions • gas chromatography • Magnesium-to-calcium ratio measurements of planktonic foraminifera • stable isotope analysis • glycerol dialkyl glycerol tetraether (GDGT) analysis • computational modeling technique |
| Factor Type(s) | temporal measurement |
| Sample Characteristic - Environment | hydroclimate • ocean |
| Sample Characteristic - Location | Agulhas Current |
Machine-accessible metadata file describing the reported data: 10.6084/m9.figshare.13019678
Background & Summary
The mass and salt transport through the Indian-Atlantic Ocean Gateway, via the Agulhas leakage, can be considered as a potential controlling factor in the Southern Hemisphere impacting on the North Atlantic salt budget1,2. Today Agulhas leakage of ~5–15 Sverdrup (Sv) is one of the dominant sources of the upper branch of the Atlantic Meridional Overturning Circulation (AMOC), connecting the warm route around the southern tip of Africa with the North Atlantic3,4. The advection of salt is communicated north within 2–4 decades5–7 suggesting a rather fast impact of Agulhas leakage on the AMOC.
The interest of the palaeoclimate community in Agulhas leakage arose from the finding that peak Agulhas leakage occurred during glacial terminations8 and plausibly aided the AMOC to shift to its full-strength interglacial mode9,10. This hypothesis builds on a variety of records from within the Agulhas leakage pathway, which inferred fluctuations in the strength of Agulhas leakage over the late Pleistocene epoch based on a variety of faunal and geochemical proxy reconstructions8,11–18. These findings are further reinforced by a numerical model study19 indicating that the strength of the Agulhas leakage varied by ~10 Sv between glacial and interglacial periods.
Fewer studies have concentrated on the Agulhas Current itself. The relationship between the current and the Agulhas leakage is not well understood. Various models have been put forward determining the modern connection between the two. Early studies proposed that the magnitude of Agulhas leakage is thought to depend on the strength and variability of the upstream Agulhas Current and the location of the retroflection1. A decoupling of Agulhas Current variability from Agulhas leakage was proposed by Loveday, et al.20 whereas van Sebille, et al.21 concluded a weaker Agulhas Current would lead to more Agulhas leakage. On longer timescales a study by Franzese, et al.22 suggests, based on strontium isotopes in detrital sediments from core sites along the Agulhas Current system, that reduced glacial leakage must be explained by a weaker current. On orbital- to millennial timescales, Simon, et al.23 concluded, that changes in temperature and salinity in the Agulhas leakage is at least partly the result of variability in the composition in the current itself and can be a poor indicator of the strength of the leakage.
In addition to the importance for global climate dynamics of Agulhas leakage, its variability also significantly impacts the hydroclimate around the southern tip of Africa. Rainfall intensity today in coastal southeast Africa is positively correlated to Sea Surface Temperature (SST) variability in the southwest Indian Ocean and the Agulhas Current regime24. Today the Agulhas Current shapes coastal climate25, particularly under ridging high-pressure conditions, when low-level onshore flow of moisture from the Agulhas Current region reaches the narrow coastal belt of the Eastern Cape and KwaZulu-Natal provinces where rain falls. How important is the role of the Agulhas Current heat transport in determining hydroclimate conditions in south-eastern Africa across regions and timescales? Increasing the spatio-temporal scales of records representing past variability in the Agulhas Current main flow path is of high importance to the community to attempt to answer these questions. Despite few existing datasets from locations either positioned to monitor changes of the Agulhas Current, where it originates MD96-204826; or slightly outside its main trajectory MD96-207727; a record from the proximal Agulhas Currents main core flow path spanning mutable glacial cycles is still as of yet missing.
Here we present a new continuous 270-kyr data set consisting of Agulhas Current near-surface temperature and inferred salinity based on surface-dwelling foraminiferal Mg/Ca and δ18O records from site CD154 10-06 P (31°10.36’S, 32°08.91’E, 3076 m water depth, Fig. 1). Moreover, we make a multi-proxy compilation of temperature proxies (Mg/Ca; TEX86 and UK’37 based estimates) over the last deglaciation additionally available. This dataset can serve future users to, for example, compare the Agulhas Current SST patterns with South African terrestrial hydroclimate records over the last two glacial cycles to evaluate if the ocean heat transport was shaping coastal land-climate on various timescales. Moreover, the data set can be used to reconstruct the contribution of Agulhas Current water transports to the T-S variability in the Indian-Atlantic Ocean gateway and Agulhas leakage over the past 270 kyr. Additionally, the multi-proxy SST compilation over the last deglaciation can serve in future regional data compilations established around South Africa as well as in global temperature compilations.
Fig. 1.

Location map of Site CD154 10-06 P (this study) and CD154 17-17 K23 with main surface currents (arrows) in the southwest Indian Ocean and atmospheric circulation over southern Africa during austral summer (December, January, February) with the approximate position of the Congo Air Boundary (CAB) (dashed lines; adapted from Reason et al., 200677). AC = Agulhas Current, AL = Agulhas Leakage; SEC = South Equatorial Current, SEMC = South East Madagascar Current, NEMC = North East Madagascar Current, EACC = East Africa Coastal Current, ARC = Agulhas Return Current. Purple shading = Zambezi River Catchment, green shading = Limpopo River Catchment, gray double-headed arrows = main pathways of moisture supply to the African continent from the northwest Atlantic (through Congo) and the northwest and the south-west Indian Ocean. Map Adapted from Hall, et al.78.
Methods
Age model
Marine sediment core CD154 10-06 P recovered 969 cm of marine mud mainly composed of foraminiferal ooze (Fig. 2). The core was sampled at 1 cm intervals, the wet sediment was weighed, disaggregated on a rotating wheel for approximately 24 hours, washed over a 63 μm sieve using fine water spray and dried in the oven at 40 °C.
Fig. 2.
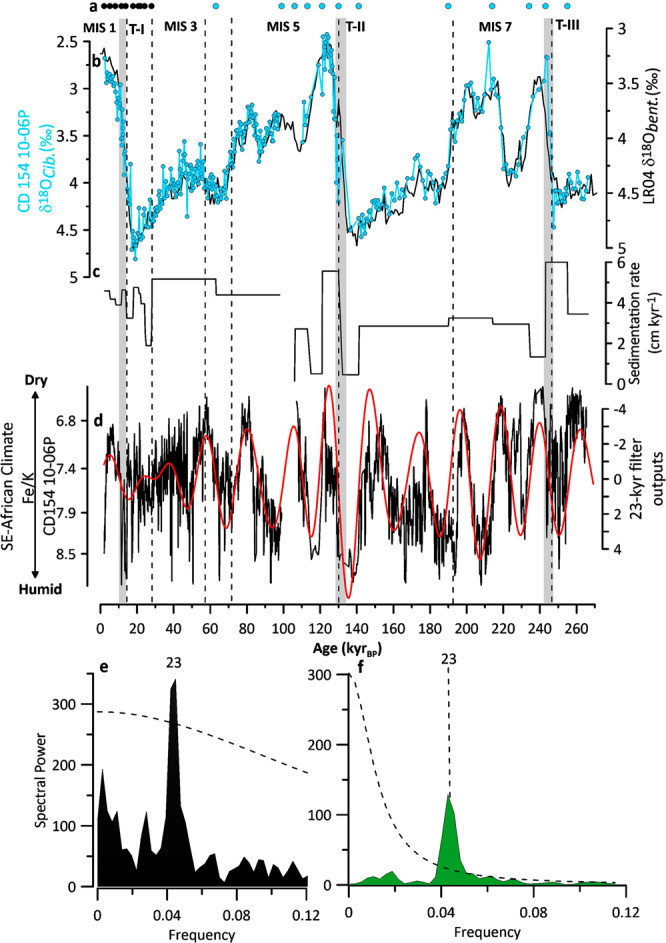
Initial Age model for core CD154 10-06 P. (a) Age control points for CD154-10-06P, including radiocarbon dates (black) tuning of the foraminiferal δ18O record to LR04 (black) (b) Benthic foraminiferal (Cibicidoides spp.) δ18O record from CD154-10-06P (blue), reflecting global ice volume variability and local deep-water conditions, in comparison with global benthic stack LR04 (black). Marine isotope stages (MIS) are indicated, Underlying grey bars indicate glacial-interglacial Terminations (T) (c) Sedimentation rate in cm kyr-1 (d) Fe/K of CD 154 10-06 P (black, 5 point running mean) with 23-kyr Gaussian filter on top (red) (e) Power spectra calculated with the REDFIT-sofware for Fe/K record of core CD154 10-06 P (black) and (f) Chinese speleothems δ18O record (green), red noise boundaries were estimated as upper 99% chi-squared limits of a fitted AR1 process. Bandwidth is 0.0186. Precession band (23-kyr) is highlighted.
A turbidite was detected during sampling of core CD154 10-06 P through visual inspection and an evident rapid increase in the coarse fraction weight % as well as a sharp drop in the L* record. As such, the identified turbidite interval (50 cm) was removed from the depth scale and the material was not used for the palaeoceanographic records. The age model construction was performed on the new depth adapted scale (for reference please see details in Simon28).
The age model for the upper two core sections (upper 100 cm in the core) was developed using ten 14C accelerator mass spectrometer (AMS) dates measured from samples containing approximately 1000 tests of the planktonic foraminiferal species Globigerinoides ruber (250–315 μm) and has been previously presented in Simon, et al.29. The age model for the remaining lower core sections was published in detail in Simon, et al.30. Here we update the radiocarbon ages using the Marine13 calibration curve31 with the global mean reservoir correction of (R) 405 years32.
Radiocarbon measurements were made at the Natural Environment Research Council (NERC) Radiocarbon Laboratory (Table 1). The core chronology was constructed using the Bayesian model Bchron33,34 from which we derive 95% (2σ) uncertainty on the calibrated ages (Table 1) as well as a 95% probability envelope for each estimated time point (Fig. 3). In the range of the 14C dates (1.98–27.38 ka), average sedimentation rates of ~4.0 cm ka−1 (1.9–4.8 cm ka−1, min and max sedimentation rates, accordingly) and a sample integration of ~300 years for every 1 cm sample is implied. Beyond that, average sedimentation rates are ~4.27 cm ka−1 (0.45–6.0 cm ka−1, min and max sedimentation rates, accordingly) and an average sample integration of ~1.3 kyr for every 4 cm sample and of ~2.3 kyr for every 8 cm sample is inferred.
Table 1.
14C dates for sediment core CD154-10-06P.
| Depth (cm) CD154 10-06 P | Species | 14C age BP (yr) | Error +/− 1σ (radiocarbon yrs BP) | 2σ credible age interval Lower limit (ka BP) | 2σ credible age interval Mid-point (ka BP) | 2σ credible age interval Upper limit (ka BP) | Laboratory Code |
|---|---|---|---|---|---|---|---|
| 0–1 cm | G.ruber | 2359 | 35 | 1.895 | 1.979 | 2.078 | SUERC-45072 |
| 14–15 cm | G.ruber | 4774 | 35 | 4.910 | 5.027 | 5.195 | SUERC-45075 |
| 26–27 cm | G.ruber | 7681 | 40 | 8.037 | 8.141 | 8.247 | SUERC-45076 |
| 40–41 cm | G.ruber | 10409 | 49 | 11.296 | 11.494 | 11.740 | SUERC-45077 |
| 51–52 cm | G.ruber | 12403 | 63 | 13.748 | 13.881 | 14.020 | SUERC-45078 |
| 64–65 cm | G.ruber | 15082 | 89 | 17.649 | 17.865 | 18.049 | SUERC-45079 |
| 78–79 cm | G.ruber | 17863 | 132 | 20.735 | 21.087 | 21.453 | SUERC-45080 |
| 83–84 cm | G.ruber | 18786 | 148 | 21.907 | 22.241 | 22.484 | SUERC-45081 |
| 92–93 cm | G.ruber | 20682 | 191 | 23.965 | 24.380 | 24.960 | SUERC-45082 |
| 99–100 cm | G.ruber | 23498 | 273 | 26.758 | 27.375 | 27.716 | SUERC-45085 |
Fig. 3.

The Bayesian age model obtained by Bchron (black) for the top 100 cm of CD154 10-06 P incorporating a reservoir uncertainty of 405 years (ΔR = 0). Each date is represented by the probability distribution of the intersection between the radiocarbon ages at those depths and the Marine13 calibration curve. The grey shaded area indicates the credible interval (CI) of the 95% probability based on the calibrated dates using the Bayesian statistical package Bchron34.
Beyond the limits of the radiocarbon method, the visual correlation of the benthic δ18O record to the global benthic stack LR0435, was used to establish the initial age model (Fig. 2) (Table 2). To further fine-tune the age model, we visually matched common transitions within the Fe/K ratio of core CD154 10–06 P and the δ18O splice from Chinese speleothems36–38, as presented in Barker, et al.39 on the precession band (Fig. 2d–f) (Table 2). Ages between each age control point were estimated by linear interpolation. However, it was not possible to establish a continuous age model on the turbidite adapted depth scale (Fig. 2) of the core as the event caused sediment erosion in that interval, which is evident through the absence of half a precession cycle in the Fe/K record during MIS 5 c/d (Fig. 2) (Simon, et al.30). To adapt for the time gap (~7 kyr), two additional tuning points were used (Fig. 2).
Table 2.
Age control points for the age model of sediment record CD154-10-06P (*turbidite adaptation).
| Radiocarbon dates | Tuning of benthic δ18O of CD154-10-06P to LR0435 | Additional tuning of Fe/K of CD154-10-06P to Chinese speleothem δ18O splice | |||
|---|---|---|---|---|---|
| Depth (cm) | Age (kyr) | Depth (cm) | Age (kyr) | Depth (cm) | Age (kyr) |
| 0.5 | 1.98 | 281 | 63 | 459 | 113 |
| 14.5 | 5.03 | 439* | 99 | 567 | 153 |
| 27.5 | 8.14 | 440* | 106 | 602 | 166 |
| 40.5 | 11.49 | 463 | 121 | 631 | 178 |
| 51.5 | 13.88 | 513 | 130 | 702 | 199.5 |
| 64.5 | 17.86 | 518 | 141 | 755 | 223.5 |
| 78.5 | 21.09 | 658 | 190 | 911 | 268 |
| 83.5 | 22.41 | 736 | 214 | ||
| 92.5 | 24.38 | 795 | 234 | ||
| 99.5 | 27.38 | ||||
Planktonic foraminiferal δ18O
Paired stable oxygen isotope (δ18O) and Mg/Ca measurements were performed on planktonic foraminiferal species G. ruber. Around 60–70 individuals were picked from the 250–315 μm size fraction in core CD154-10-06P for combined analysis. About ¼ of the material was used for stable isotope analysis and ¾ for Mg/Ca measurements after the crushing of shells.
Stable isotopes were measured at Cardiff University, School of Earth and Environmental Sciences using a ThermoFinnigan MAT 253 mass spectrometer linked online to a Carbo Kiel-II carbonate preparation device (long-term external precision is 0.06‰ for δ18O and 0.02‰ for δ13C). The stable isotope measurements were expressed relative to the Vienna Pee Dee Belemnite scale (VPDB) through calibration with the NBS-19 carbonate standard.
Planktonic foraminifera stable isotopes were analysed every 1 cm in the upper part of the record (Holocene-LGM) and the data set is published in Simon, et al.29. Further down core samples from 76.5 cm to 152.5 cm yield a 4-cm resolution. From 152.5 cm until the end of the core (918.5 cm) every 8th cm was analysed.
Mg/Ca Measurements in core CD154-10-06P
Mg/Ca ratios were run every 1 cm in the upper part of the record (Holocene-LGM) and the data set is published in Simon, et al.29. Further down core from 76.5 cm to 152.5 cm core depth, every 4th cm was analysed. From there on until the end of the core (918.5 cm) every 8th cm was measured.
Magnesium-to-calcium ratio (Mg/Ca) measurements in the planktonic foraminifera G. ruber have been used to reconstruct changes in the surface water temperature of the Agulhas Current (Fig. 4). G. ruber is a warm water species, highly abundant in the tropical-subtropical waters of the Indian Ocean, and makes up to 40–60% of the planktonic foraminiferal assemblage of the Agulhas Current today23. A study of calcification depths of planktonic foraminifera in the tropical Indian Ocean showed that G. ruber calcifies within the mixed layer, between 20 and 50 m40.
Fig. 4.
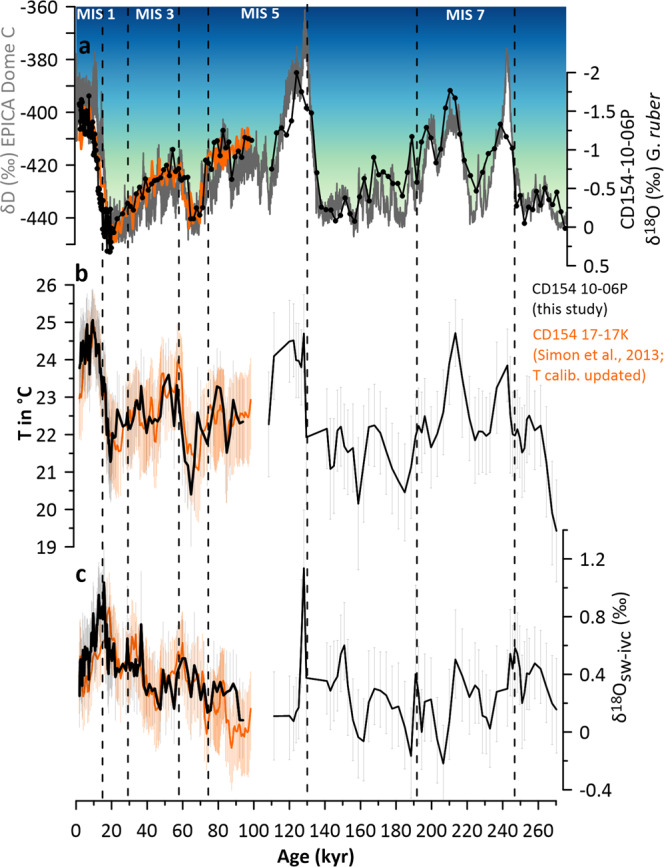
The palaeocenanographic records of core CD154 10-06 P in the main flow path of the Agulhas Current system. (a) Comparison of the planktic δ18O record (black) of core CD154 10-06 P (black) and upstream site CD154 17-17 K (orange) with the Antarctic European Project for Ice Coring in Antarctica (EPICA) ice-core δD79 Antarctica (EPICA) temperature variability as inferred from δD ice record δ18O record (b) Mg/Ca-based SSTs record of CD154 10-06 P (black) in comparison with upstream site CD154 17-17 K (orange) using PSU Solver output of Mg/Ca-SST-SSS calibration equation based on a compilation of cultured data42 with corresponding 2σ confidence intervals (c) PSU Solver δ18Osw-ivc record indicating inferred relative salinity changes (black) in comparison with upstream site CD154 17-17 K (orange) with corresponding 2σ confidence intervals. Thick black and orange lines are the mean values of the PSU Solver output. Black dashed lines indicate Marine Isotope Stage boundaries.
Samples for Mg/Ca analysis were prepared and cleaned following the protocol outlined by Barker, et al.41. The samples were analyzed using a Thermo Element XR High inductively coupled plasma-mass spectrometry with a long-term precision of element ratios, determined by replicate analyses of standard solutions containing Mg/Ca = 1.15 mmol mol-1 and Mg/Ca = 6.9 mmol mol-1 of ±1.25% relative standard deviation (RSD) and ±0.52% RSD, respectively. The Mg/Ca ratios of G. ruber were converted to calcification temperature using a new Mg/Ca-SST-SSS calibration equation (Mg/Ca = exp (0.084*T + 0.051*S - 2.54)) based on a compilation of cultured data42.
Seawater Oxygen Isotope Reconstruction (δ18Osw)
We used the computational toolkit Paleo-Seawater Uncertainty Solver (PSU Solver) to derive δ18Osw estimates43. The Mg/Ca-derived G. ruber calcification temperatures were used to determine the oxygen isotopic composition of seawater (δ18Osw) by extracting the temperature component from the δ18O of the calcite using the paleotemperature equation of Bemis, et al.44 (T = 14.9-4.8 (δ18O-δ18Osw)), with a VPDB to Standard Mean Ocean Water δ18O correction of 0.27‰45. The δ18Osw was corrected for changes in global ice volume to produce ice-volume-corrected local δ18Osw-ivc estimates using Spratt and Lisiecki46 for global ice volume estimates.
Organic Proxies
Sample preparation
Forty sediment samples were freeze-dried and homogenized with a mortar and pestle. The homogenized material was then extracted using an accelerated solvent extractor with dichloromethane (DCM):methanol 9:1 (v/v) and a pressure of 1000 psi in 3 extraction cycles. The total lipid extract was separated over an Al2O3 column into an apolar, ketone and polar fraction using hexane:DCM 9:1, hexane:DCM 1:1 and DCM:methanol 1:1 (v/v), respectively. The ketone fractions were analysed for the alkenone unsaturation index (UK’37) using a gas chromatograph (GC). The polar fractions were redissolved in hexane/isopropanol (99:1) to a concentration of 2 mg/ml and filtered over a 0.45 PTFE filter and analyzed for the Glycerol dialkyl glycerol tetraether (GDGT) lipid-based TEX86 using high-performance liquid chromatography mass spectrometry (HPLC/MS).
UK’37 analysis
Ketone fractions were analysed by GC using an Agilent 6890 gas chromatograph with a FID and an Agilent CP Sil-5 fused silica capillary column (50 m × 0.32 mm, film thickness = 0.12 μm) with helium as the carrier gas. The GC-oven was programmed to subsequently increase the temperature from 70 to 130 °C with 20 °C min−1 steps, and then with 4 °C min−1 steps to 320 °C, at which it was held isothermal for 10 min. The analytical error associated with this method is ±0.2 °C (standard error), UK’37 values were calculated according to Prahl and Wakeham47. Subsequently, SST was calculated using the core top calibration (SST = UK’37 - 0.044/0.033) established by Müller, et al.48. The error associated with this calibration is ±1.5 °C on the SST estimates.
GDGT analysis
Analyses for GDGTs were performed as described by Schouten et al.49. In summary, an Agilent 1100 series HPLC/MS equipped with an auto-injector and Agilent Chemstation chromatography manager software was used. The separation was achieved on an Alltech Prevail Cyano column (2.1 mm × 150 mm, 3 μm), maintained at 30 °C. GDGTs were eluted with 99% hexane and 1% propanol for 5 min, followed by a linear gradient to 1.8% propanol in 45 min. Flow rate was 0.2 mL min−1 by back-flushing hexane/propanol (90:10, v/v) at 0.2 mL min−1 for 10 min. Detection was achieved using atmospheric pressure positive ion chemical ionization mass spectrometry (APCI-MS) of the eluent. Conditions for the Agilent 1100 APCI-MS 5 were as follows: nebulizer pressure of 60 psi, vaporizer temperature of 400 °C, drying gas (N2) flow of 6 L min−1 and temperature 200 °C, capillary voltage of −3 kV and a corona of 5 μA (~3.2 kV). GDGTs were detected by Single Ion Monitoring (SIM) of their [M + H]+ ions (dwell time = 234 ms)49, and quantified by integration of the peak areas. TEX86 was calculated as described by Schouten, et al.50. The TEXH86 SST calibration model by Kim et al.51 (SSTH = 68.4*LOG (TEXH86) + 38.6) was used to transfer TEX86 values to absolute SST. This calibration model is recommended for temperature reconstruction above 15 °C51 and therefore appears to be the most suitable model for reconstructing subtropical temperatures, as found in the Agulhas Current area. The analytical error associated with this method is ±0.3 °C (standard error)52. The error associated with the calibration is ±2.5 °C on the SST estimates51.
Data Records
The here presented data set of marine sediment core CD154 10-06 P was archived using the Linked Paleo Data (LiPD) format53. The LiPD framework enables quick querying and extraction, and software in R and Python can help to analyse and visualize paleoclimate data in LiPD format.
Our collection includes data represented in previous publications, but are updated herein, and new data (Table 3). The following table provides an overview:
Table 3.
Overview of existing datasets and here newly presented proxy records.
| Marine sediment core | Proxy/Age model | Timeframe | Publication |
|---|---|---|---|
| CD154-10-06P | δ18O, δ18Osw, Mg/Ca | 1.9-20.3 kyr BP | Simon, et al.29 |
| CD154-10-06P | TEX86, UK’37; Mg/Ca-based SST calib. updated | 1.9–20.3 kyr BP | this study |
| CD154-10-06P | δ18O, δ18Osw, Mg/Ca | 20.3–270 kyr BP | this study |
| CD154-10-06P | Age model | 1.9–20.3; 1.9–270 kyr BP | Simon, et al.29,30 |
| CD154 17-17 K | δ18O, δ18Osw, Mg/Ca | 1.8–98 kyr BP | Simon, et al.23 |
| CD154 17-17 K | Age model | 1.8–98 kyr BP | Ziegler, et al.80 |
| CD154 17-17 K | Mg/Ca-based SST calib. updated; δ18Osw updated | 1.8–98 kyr BP | this study |
The presented file in the LiPD data format: Agulhas Current_CD154_10-06P.Simon.2020.lpd or in the excel template (Agulhas Current_CD154_10-06P.Simon.2020.xlsx) that can be converted into a LiPD file using the Python LiPD utilities contains a metadata tab that presents the essential marine sediment core information and those of the investigators. Further, the file encloses a tab named paleomeasurement table, which presents all proxy analysis of the data set conducted such as δ18O, Mg/Ca ratios, derived δ18Osw-ivc, calibrated temperatures following a classic approach using a species-specific calibration of Anand, et al.54, a pH corrected one following Gray and Evans55 and the Mg/Ca-temperature-salinity equation after Tierney, et al.42. Moreover, we present previously unpublished biomarker derived data (Tex86 and UK’37) over the last deglaciation of the same sediment samples.
Radiocarbon dates from the upper part of the core along with calibrated dates, as well as their Bayesian age credible intervals (95%) and downcore age model tie points are provided in the tab: chron measurement tab file.
Notably, the fact that the 14C raw data are provided makes the present data set easy to update using a future 14C calibration curve. This is also the case for the provided proxy-raw data that can be used to be calibrated and/or corrected in different manners if desired by the user compliant with the recommendations of the Paleoclimate Community reporTing Standard (PaCTS) 1.056
Moreover, we show a published, but updated, dataset upstream in the Agulhas Current (marine sediment core CD154 17-17 K, Figs. 1, 4),23 in comparison. The strong correspondence between these two Agulhas Current records testifies that over the last glacial cycle the generated data is reproducible concerning SST and δ18Osw-ivc inferred salinity variability, hence, regionally consistent.
All the data sets presented in this study are made available on the SEANOE57 database and PANGAEA58.
Technical Validation
Age model
The age model making use of the alignment of the Fe/K ratio of core CD 154 10-06 P to the δ18O splice from Chinese speleothems36–38 has been validated by comparing the radiocarbon-dated upper portion of the marine core with the U-Th dated speleothem signal (Fig. 2 in Simon, et al.30). This validation was the initial step that led to the use of speleothem isotopic records to complement the lower part of the record (Fig. 2). Transferring the speleo-chronology of core CD 154 10-06 P to the record of benthic δ18O enables an evaluation of the discrepancies between a 230Th-derived chronology and the LR04 isotopic stack which is widely used as tuning target for marine records. The comparison shows that, despite the different tuning approach, a high level of synchronicity between the benthic δ18O record of core CD154 10-06 P and the LR04 record is achieved (Pearson T = 0.919; CL 95% (0.86; 0.95)). The average absolute age difference between the initial and the resulting fine-tuned age model is only ~400 years (1σ = 1.47 kyr) verifying our age model approach.
Quality control and error estimates for Mg/Ca measurements and δ18Osw for core CD154 10-06 P
To validate the analytical robustness of the data set, a screening step consisting to compare Mg/Ca ratios with Fe/Mg, Al/Mg, and Mn/Mg ratios has been undertaken to monitor possible contamination by clays and metal-oxide coatings along the down core results41,59,60. Moreover, protocol blanks were routinely run between samples as well. Fe/Mg and Al/ Mg can be used to monitor the potential influence of silicate contamination in foraminiferal Mg/Ca whereas Mn/Mg can determine potential contamination through Mn-Fe oxide coatings41. Values above 0.1 mol mol−1 for those elemental ratios suggest contamination may be significant. Elevated Fe/Mg ratios (>0.1 mol mol−1) are occurring in the core interval 20–27 cm of core CD154 10-06 P but do not seem to co-vary with higher Mg/Ca ratios (Fig. 5.). For that reason, no samples in this core interval have been rejected. One sample (35.5 cm) with particularly low Mg/Ca ratios was rejected as its value falls out of the two-sigma standard deviation range of the entire dataset. In the depth interval 76.5–918.5 cm which is the focus of this study, 3 more samples have been identified and were removed. Those samples were at 148.5 cm displaying higher than average Fe/Mg and Al/Mg ratios; 256.5 cm displaying slightly elevated Al/Mg (0.2 mol mol−1) and 694.5 cm that has high Fe/Mg values. Some other intervals display elevated contaminate ratios (>0.1) but do not seem to co-vary with higher Mg/Ca ratios (Fig. 5a).
Fig. 5.

Quality control for Mg/Ca measurements (a) G. ruber Mg/Ca ratios (mmol mol−1) (black circle) (b) Fe/Mg (mol mol−1) (brown), Al/Mg (mol mol−1) (green) and Mn/Mg (mol mol−1) (blue) ratios; (c) Fe/Mg (mol mol−1) (brown) versus Mg/Ca ratios (mmol mol−1) and their coefficient of determination R2(d) Al/Mg (mol mol−1) (green) versus Mg/Ca ratios (mmol mol−1) and their coefficient of determination R2 (e) Mn/Mg (mol mol−1) (blue) versus Mg/Ca ratios (mmol mol−1) and their coefficient of determination R2; red circled samples have been removed from the data set.
In order to validate our analytical approach, error estimates are based on the average standard deviation of 0.365 mmol/mol (2σ) accounting for artifacts associated with replication, cleaning procedure, analytical deviations and natural variability of the G. ruber populations, which was derived from duplicate measurements of 34 Mg/Ca samples of core CD154 17-17 K23. Trace element analyses on material from core CD154 10-06 P were performed in the same manner, on the same species G. ruber and analytical facilities as for core CD154 17-17 K. To examine how the influence of salinity on Mg/Ca affect the paleoclimatic reconstructions, we chose a Mg/Ca-temperature-salinity equation42. The surface of the modern-day southern Agulhas Current experiences annual temperature variations averaging around 21 °C during winter months and 26 °C during summer months with a mean annual temperature (MAT) of 23 °C (NASA Worldview, 2018, https://worldview.earthdata.nasa.gov). Comparing our derived core top values from the PSU Solver output for SST (23.7 °C; 2σ: 22.70–24.73 °C) with instrumental observations, we find the best match, within error, with MAT with a slight bias towards summer months temperatures.
Overall, to better constrain the various sources of uncertainty that arise from calculating temperature and δ18Osw-ivc for our data set (Fig. 4) we use the PSU Solver MATLAB® code that performs bootstrap Monte Carlo simulations to constrain the respective confidence intervals using an iterative approach with user-defined errors, calibrations, and sea-level curves43.
Additionally, we demonstrate in Fig. 6 how the choice of different SST calibration curves, as well as proxy choice from the same core material, can influence the final derived SST estimate in a time series spanning from the LGM to the Holocene. Mg/Ca ratios of G. ruber converted to calcification temperature using the sediment trap calibration of Anand, et al.54 (previously published29) are shown in comparison with applying a Mg/Ca-temperature-salinity equation42 to the same data set. The offsets between both calibrations suggest a significant influence of salinity on Mg/Ca, which alters the structure, and amplitude of change in the resulting reconstruction.
Fig. 6.
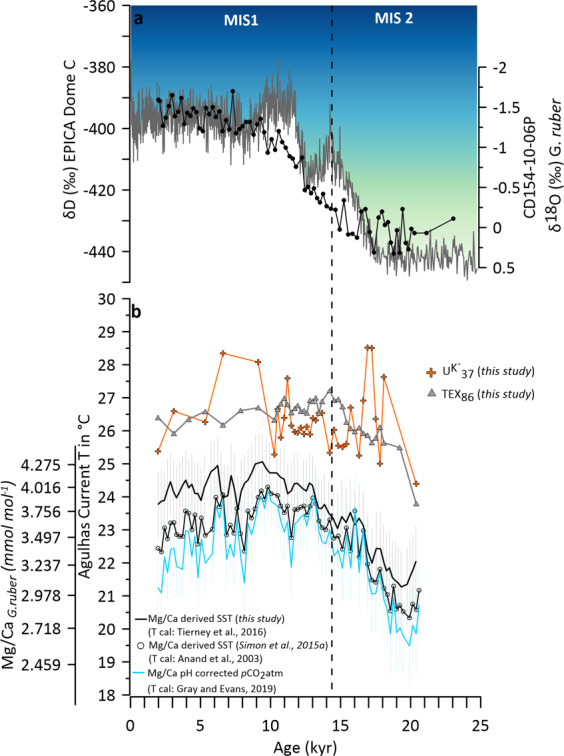
(a) Planktic δ18O record (black) with the Antarctic European Project for Ice Coring in Antarctica (EPICA) ice-core δD79 Antarctica (EPICA) temperature variability as inferred from δD ice record δ18O record (b) Tex86-derived SST record CD 154 10-06 P (grey triangles) reflecting ocean temperature changes in the Agulhas Current, UK’37-derived SST record (orange crosses) from CD 154 10-06 P; G. ruber Mg/Ca ratios (mmol mol−1) and derived SST record using54, (black circle), derived SST record calculated from Mg/Ca and pH derived from atmospheric pCO2 following the species‐specific equation given Gray and Evans55; (blue). The error envelopes show the combined 2σ; uncertainty from calibration uncertainty and a salinity uncertainty of ±1 PSU (2σ), derived SST record using Mg/Ca-temperature-salinity equation from Tierney, et al.42 in black, error envelopes show the combined 2σ range.
Mg/Ca decreases as pH (and [CO32−]) increases, with a sensitivity of ∼5–10% per 0.1 pH unit61,62. To validate our data, we used the protocol to correct Mg/Ca for pH down‐core using atmospheric CO2 in a new software package “MgCaRB by Gray and Evans55, (Fig. 6). The results suggest an only minor influence of pH on our Mg/Ca data set, as the results are almost identical (with a slight cold bias) to the uncorrected results using a species-specific temperature calibration (Fig. 6b). Overall, it should be noted that all outputs for the different Mg/Ca-calibrations agree with each other within error.
However, post-depositional dissolution impacts should also be considered in the future use of the Mg/Ca data. Based on the estimates from Regenberg, et al.63 water depths below 2 km in the Agulhas Current System are already effected by partial dissolution effects. At the core site CD154 17-17 K, the Δ[CO3−2] is 0 μmol kg−1 and hence below a critical threshold for dissolution of 21.3 ± 6.6 μmol kg−1 as suggested by the authors. Taken together, we hence recommend that future users apply calibration equations that include a correction for the dissolution effect on Mg/Ca in foraminiferal calcite such as presented in Dekens, et al.64 and Regenberg, et al.65 in addition to the standard calibrations for SST referred to above.
Additionally, UK’37 and TEX86 derived temperature estimates from the same sediment samples are displayed over the last deglaciation (Fig. 6). It can be noted that absolute SST biomarker-based estimates are higher and the pattern over the deglaciation differs from the inorganic based values. The alkenone record yield slightly higher temperatures with larger‐amplitude variations than the archaeal lipid record and both are 2–3 °C higher than the Mg/Ca-based SSTs. The reason for these discordant results among the different paleothermometers might be manifold.
The Uk′37 ratio can be influenced by the ecology of the taxa that produce alkenones66. Additionally, alkenones associated with fine‐grained sediment are susceptible to lateral advection in regions of strong currents67. The occasionally above the modern seasonal range occurring Uk′37 -based temperatures (>28 °C) in this record might point towards surface drift of material in the Agulhas Current that might originate in the Mozambique Channel where temperature recorded are warmer than at the core site68.
We use the global Müller, et al.48 calibration for Uk′37. Because our site is located in the subtropics, we advise the user to also explore additional estimates produced by e.g. the Bayesian BAYSPLINE approach Tierney and Tingley69, which addresses the attenuation of the Uk′37 response to temperature as the Uk′37 ratio approaches one, that is, in locations with SSTs > 24 °C.
There are multiple calibrations for TEX86, both global and regional. Empirically, TEX86 correlates best to SST or temperatures between 0 and 100 m51,70, yet Thaumarchaeota typically reside deeper within the water column. Hence, TEX86 may always record subsurface temperatures, and the observed empirical statistical correlation to SST is merely a reflection of the fact that temperatures at ~100 m are highly and significantly correlated with SSTs, at least spatially71.
Ho and Laepple72 proposed that TEX86 reflects purely subsurface ocean conditions and recalibration to deeper depths rather than the surface is required.
Here, we use the global calibrations of Kim, et al.51 and Kim, et al.70 and we advise the user to also explore additional estimates produced by e.g. the Bayesian BAYSPAR calibration by Tierney and Tingley73 and Ho and Laepple72.
Seawater oxygen isotope reconstruction (δ18Osw)
To validate the δ18Osw reconstructions, a full error propagation performing bootstrap Monte Carlo simulations was conducted accounting for the uncertainty in these reconstructions, which includes age, analytical, calibration, and sampling errors in a framework where the effects of salinity on Mg/Ca, and the effect of ice volume on δ18Osw was also incorporated (Fig. 4). The conversion from δ18Osw to salinity is generally accompanied by large uncertainties74. Therefore, all data is shown here as ice volume corrected δ18Osw (δ18Osw-ivc) values only.
PSU Solver requires the user to specify a set of input conditions which include (1) the number of total Monte Carlo simulations to be performed, (2) a choice of sea‐level curve (or the option to not correct for ice volume), and (3) the desired set of climate‐geochemistry relationships. Below the transfer functions and error inputs used for the datasets in this study (CD154 10-06 P/ CD154 17-17 K) are listed:
Number of Monte Carlo Simulations mc = 1000:
δ18Osw-salinity relationship for the regional southern tropical Indian Ocean (24°S-44°S) of Tiwari, et al.75: δ18O–SSS slope of 0.44 ± 0.03; r2 = 0.69; n = 115; significant at p = 0.99
δ18Oc paleotemperature equation of Bemis, et al.44: T = 14.9-4.8(δ18O-δ18Osw)
Mg/Ca-temperature-salinity equation of Tierney, et al.42: Mg/Ca = exp (0.084*T + 0.051*S - 2.54)
sea level estimates: Spratt & Lisiecki et al. (2016): 0–798 kyr curve
analytical uncertainty: δ18Ocalcite and Mg/Ca analysis of G. ruber, respectively: 0.06 permil, 0.365 mmol/mol
age uncertainty: distributions for radiocarbon ages based on a Bayesian methodology (see Fig. 3 and Table 1 for reference), average age model uncertainty downcore: 1 kyr
Transfer functions and error inputs used in the CD154 17-17 K data set (Fig. 4, orange) were identical, despite that the record of Grant, et al.76 was used for sea level estimates and an average age model uncertainty of 2.5 kyr was applied downcore.
Acknowledgements
We acknowledge funding from the European Commission 7th Framework Marie Curie People programme FP7/2007–2013 through funding of the Initial Training Network “GATEWAYS” (www.gateways itn.eu) under grant 238512 which funded the initial establishment of this data set. This work was partly supported by the Research Council of Norway, through its Centres of Excellence funding scheme, SFF Centre for Early Sapiens Behaviour (SapienCE), project number 262618. We thank Rainer Zahn, the captain, officers, and crew of RRS Charles Darwin cruise number 154, for which I.H. also gratefully acknowledges funding support from the Natural Environment Research Council. Furthermore, we acknowledge funding from the DAAD (German Academic Exchange Service) which supported the RISE (Research Internships in Science and Engineering) internship placement of Elisa Spreitzer who assisted together with Sebastian Steinig in carrying out laboratory and analytical work on core material CD154 10-06 P. Alexandra Nederbragt, Lindsey Owen, and Anabel Morte-Ródenas provided technical support with the isotope and trace element analysis at Cardiff University.
Author contributions
M.H.S. sampled the core, processed the samples, and carried out measurements, data analysis, study conceptualizing, and implementation. I.R.H, S.B. and M.Z. supervised M.H.S. during her Ph.D. I.R.H. participated in the retrieval of the sediment core material and initiated the project. MVM and SS hosted MHS during her research stay at NIOZ, supervised, and assisted with the biomarker work. M.H.S. lead the writing of the manuscript. All authors contributed to the interpretation of the data and writing the manuscript.
Competing interests
The authors declare no competing interests.
Footnotes
Publisher’s note Springer Nature remains neutral with regard to jurisdictional claims in published maps and institutional affiliations.
References
- 1.Lutjeharms JRE. Three decades of research on the greater Agulhas Current. Ocean Sci. Discuss. 2006;3:939–995. doi: 10.5194/osd-3-939-2006. [DOI] [Google Scholar]
- 2.Beal LM, De Ruijter WPM, Biastoch A, Zahn R. On the role of the Agulhas system in ocean circulation and climate. Nature. 2011;472:429–436. doi: 10.1038/nature09983. [DOI] [PubMed] [Google Scholar]
- 3.Gordon AL. Interocean Exchange of Thermocline Water. Journal of Geophysical Research. 1986;91:5037–5046. doi: 10.1029/JC091iC04p05037. [DOI] [Google Scholar]
- 4.Rühs S, Schwarzkopf FU, Speich S, Biastoch A. Cold vs. warm water route – sources for the upper limb of the Atlantic Meridional Overturning Circulation revisited in a high-resolution ocean model. Ocean Sci. 2019;15:489–512. doi: 10.5194/os-15-489-2019. [DOI] [Google Scholar]
- 5.Rühs S, Durgadoo JV, Behrens E, Biastoch A. Advective timescales and pathways of Agulhas leakage. Geophysical Research Letters. 2013;40:3997–4000. doi: 10.1002/grl.50782. [DOI] [Google Scholar]
- 6.Weijer W, De Ruijter WPM, Sterl A, Drijfhout SS. Response of the Atlantic overturning circulation to South Atlantic sources of buoyancy. Global and Planetary Change. 2002;34:293–311. doi: 10.1016/S0921-8181(02)00121-2. [DOI] [Google Scholar]
- 7.van Sebille E, Beal LM, Johns WE. Advective Time Scales of Agulhas Leakage to the North Atlantic in Surface Drifter Observations and the 3D OFES Model. Journal of Physical Oceanography. 2011;41:1026–1034. doi: 10.1175/2011JPO4602.1. [DOI] [Google Scholar]
- 8.Peeters FJC, et al. Vigorous exchange between the Indian and Atlantic oceans at the end of the past five glacial periods. Nature. 2004;430:661–665. doi: 10.1038/nature02785. [DOI] [PubMed] [Google Scholar]
- 9.Knorr G, Lohmann G. Southern Ocean origin for the resumption of Atlantic thermohaline circulation during deglaciation. Nature. 2003;424:532–536. doi: 10.1038/nature01855. [DOI] [PubMed] [Google Scholar]
- 10.Knorr G, Lohmann G. Rapid transitions in the Atlantic thermohaline circulation triggered by global warming and meltwater during the last deglaciation. Geochemistry, Geophysics, Geosystems. 2007;8:Q12006. doi: 10.1029/2007GC001604. [DOI] [Google Scholar]
- 11.Franzese AM, Hemming SR, Goldstein SL, Anderson RF. Reduced Agulhas Leakage during the Last Glacial Maximum inferred from an integrated provenance and flux study. Earth and Planetary Science Letters. 2006;250:72–88. doi: 10.1016/j.epsl.2006.07.002. [DOI] [Google Scholar]
- 12.Dyez, K. A., Zahn, R. & Hall, I. R. Multi-centennial Agulhas leakage variability and links to North Atlantic climate during the past 80,000 years. Paleoceanography, n/a-n/a, 10.1002/2014PA002698 (2014).
- 13.Marino G, et al. Agulhas salt-leakage oscillations during abrupt climate changes of the Late Pleistocene. Paleoceanography. 2013;28:599–606. doi: 10.1002/palo.20038. [DOI] [Google Scholar]
- 14.Martínez-Méndez G, et al. Contrasting multiproxy reconstructions of surface ocean hydrography in the Agulhas Corridor and implications for the Agulhas Leakage during the last 345,000 years. Paleoceanography. 2010;25:PA4227. doi: 10.1029/2009pa001879. [DOI] [Google Scholar]
- 15.Scussolini, P., Marino, G., Brummer, G.-J. A. & Peeters, F. J. C. Saline Indian Ocean waters invaded the South Atlantic thermocline during glacial termination II. Geology, 10.1130/g36238.1 (2015).
- 16.Scussolini P, Peeters FJC. A record of the last 460 thousand years of upper ocean stratification from the central Walvis Ridge, South Atlantic. Paleoceanography. 2013;28:426–439. doi: 10.1002/palo.20041. [DOI] [Google Scholar]
- 17.Kasper S, et al. Salinity changes in the Agulhas leakage area recorded by stable hydrogen isotopes of C37 alkenones during Termination I and II. Clim. Past. 2014;10:251–260. doi: 10.5194/cp-10-251-2014. [DOI] [Google Scholar]
- 18.Caley T, Giraudeau J, Malaizé B, Rossignol L, Pierre C. Agulhas leakage as a key process in the modes of Quaternary climate changes. Proceedings of the National Academy of Sciences. 2012;109:6835–6839. doi: 10.1073/pnas.1115545109. [DOI] [PMC free article] [PubMed] [Google Scholar]
- 19.Caley T, et al. Quantitative estimate of the paleo-Agulhas leakage. Geophysical Research Letters. 2014;41:2014GL059278. doi: 10.1002/2014GL059278. [DOI] [Google Scholar]
- 20.Loveday BR, Durgadoo JV, Reason CJC, Biastoch A, Penven P. Decoupling of the Agulhas Leakage from the Agulhas Current. Journal of Physical Oceanography. 2014;44:1776–1797. doi: 10.1175/jpo-d-13-093.1. [DOI] [Google Scholar]
- 21.van Sebille E, Biastoch A, van Leeuwen PJ, de Ruijter WPM. A weaker Agulhas Current leads to more Agulhas leakage. Geophysical Research Letters. 2009;36:L03601. doi: 10.1029/2008GL036614. [DOI] [Google Scholar]
- 22.Franzese AM, Hemming SR, Goldstein SL. Use of strontium isotopes in detrital sediments to constrain the glacial position of the Agulhas Retroflection. Paleoceanography. 2009;24:PA2217. doi: 10.1029/2008PA001706. [DOI] [Google Scholar]
- 23.Simon MH, et al. Millennial-scale Agulhas Current variability and its implications for salt-leakage through the Indian–Atlantic Ocean Gateway. Earth and Planetary Science Letters. 2013;383:101–112. doi: 10.1016/j.epsl.2013.09.035. [DOI] [Google Scholar]
- 24.Reason, C. J. C. Evidence for the Influence of the Agulhas Current on Regional Atmospheric Circulation Patterns. Journal of Climate14, 2769-2778, 10.1175/1520-0442(2001)014 < 2769:EFTIOT > 2.0.CO;2 (2001).
- 25.Jury, M. R., Valentine, H. R. & Lutjeharms, J. R. E. Influence of the Agulhas Current on Summer Rainfall along the Southeast Coast of South Africa. Journal of Applied Meteorology32, 1282–1287, 10.1175/1520-0450(1993)032 < 1282:IOTACO > 2.0.CO;2 (1993).
- 26.Caley T, et al. High-latitude obliquity forcing as a dominant forcing in the Agulhas current system. Clim. Past. 2011;7:1285–1296. doi: 10.5194/cpd-7-2193-2011. [DOI] [Google Scholar]
- 27.Bard E, Rickaby REM. Migration of the subtropical front as a modulator of glacial climate. Nature. 2009;460:380–383. doi: 10.1038/nature08189. [DOI] [PubMed] [Google Scholar]
- 28.Simon, M. H. Ocean and land climate dynamics off southeast Africa during the late Pleistocene: A multi-proxy approachb PhD thesis, Cardiff University, (2014).
- 29.Simon, M. H. et al. Salt exchange in the Indian-Atlantic Ocean Gateway since the LGM: A compensating effect between Agulhas Current changes and salinity variations? Paleoceanography, 2015PA002842, 10.1002/2015PA002842 (2015).
- 30.Simon MH, et al. Eastern South African hydroclimate over the past 270,000 years. Scientific Reports. 2015;5:18153. doi: 10.1038/srep18153. [DOI] [PMC free article] [PubMed] [Google Scholar]
- 31.Reimer PJ, et al. IntCal13 and Marine13 Radiocarbon Age Calibration Curves 0–50,000 Years cal BP. 2013;2013:19. [Google Scholar]
- 32.Bard E. Correction of accelerator mass spectrometry 14C ages measured in planktonic foraminifera: Paleoceanographic implications. Paleoceanography. 1988;3:635–645. doi: 10.1029/PA003i006p00635. [DOI] [Google Scholar]
- 33.Parnell AC, Buck CE, Doan TK. A review of statistical chronology models for high-resolution, proxy-based Holocene palaeoenvironmental reconstruction. Quaternary Science Reviews. 2011;30:2948–2960. doi: 10.1016/j.quascirev.2011.07.024. [DOI] [Google Scholar]
- 34.Parnell AC, Haslett J, Allen JRM, Buck CE, Huntley B. A flexible approach to assessing synchroneity of past events using Bayesian reconstructions of sedimentation history. Quaternary Science Reviews. 2008;27:1872–1885. doi: 10.1016/j.quascirev.2008.07.009. [DOI] [Google Scholar]
- 35.Lisiecki LE, Raymo ME. A Pliocene-Pleistocene stack of 57 globally distributed benthic d18O records. Paleoceanography. 2005;20:PA1003. doi: 10.1029/2004pa001071. [DOI] [Google Scholar]
- 36.Cheng H, et al. Ice Age Terminations. Science. 2009;326:248–252. doi: 10.1126/science.1177840. [DOI] [PubMed] [Google Scholar]
- 37.Wang Y, et al. Millennial- and orbital-scale changes in the East Asian monsoon over the past 224,000 years. Nature. 2008;451:1090–1093. doi: 10.1038/nature06692. [DOI] [PubMed] [Google Scholar]
- 38.Wang YJ, et al. A High-Resolution Absolute-Dated Late Pleistocene Monsoon Record from Hulu Cave, China. Science. 2001;294:2345–2348. doi: 10.1126/science.1064618. [DOI] [PubMed] [Google Scholar]
- 39.Barker S, et al. 800,000 Years of Abrupt Climate Variability. Science. 2011;334:347–351. doi: 10.1126/science.1203580. [DOI] [PubMed] [Google Scholar]
- 40.Mohtadi M, et al. Low-latitude control on seasonal and interannual changes in planktonic foraminiferal flux and shell geochemistry off south Java: A sediment trap study. Paleoceanography. 2009;24:PA1201. doi: 10.1029/2008pa001636. [DOI] [Google Scholar]
- 41.Barker S, Greaves M, Elderfield H. A study of cleaning procedures used for foraminiferal Mg/Ca paleothermometry. Geochem. Geophys. Geosyst. 2003;4:8407. doi: 10.1029/2003gc000559. [DOI] [Google Scholar]
- 42.Tierney JE, Pausata FSR, deMenocal P. Deglacial Indian monsoon failure and North Atlantic stadials linked by Indian Ocean surface cooling. Nature Geoscience. 2016;9:46–50. doi: 10.1038/ngeo2603. [DOI] [Google Scholar]
- 43.Thirumalai K, Quinn TM, Marino G. Constraining past seawater δ18O and temperature records developed from foraminiferal geochemistry. Paleoceanography. 2016;31:1409–1422. doi: 10.1002/2016pa002970. [DOI] [Google Scholar]
- 44.Bemis BE, Spero HJ, Bijma J, Lea DW. Reevaluation of the oxygen isotopic composition of planktonic foraminifera: Experimental results and revised paleotemperature equations. Paleoceanography. 1998;13:150–160. doi: 10.1029/98PA00070. [DOI] [Google Scholar]
- 45.Hut G. Consultants’ Group Meeting on Stable Isotope Reference Samples for Geochemical and Hydrological Investigations. Rep. to Dir. Gen., Vienna, 16–18 September 1985, Int. At. Energy Agency, Vienna (1987) 1987;42:42. [Google Scholar]
- 46.Spratt RM, Lisiecki LE. A Late Pleistocene sea level stack. Clim. Past. 2016;12:1079–1092. doi: 10.5194/cp-12-1079-2016. [DOI] [Google Scholar]
- 47.Prahl FG, Wakeham SG. Calibration of unsaturation patterns in long-chain ketone compositions for palaeotemperature assessment. Nature. 1987;330:367–369. doi: 10.1038/330367a0. [DOI] [Google Scholar]
- 48.Müller PJ, Kirst G, Ruhland G, von Storch I, Rosell-Melé A. Calibration of the alkenone paleotemperature index U37K′ based on core-tops from the eastern South Atlantic and the global ocean (60°N–60°S) Geochimica et Cosmochimica Acta. 1998;62:1757–1772. doi: 10.1016/S0016-7037(98)00097-0. [DOI] [Google Scholar]
- 49.Schouten S, Huguet C, Hopmans EC, Kienhuis MV, Damsté JS. Analytical methodology for TEX86 paleothermometry by high-performance liquid chromatography/atmospheric pressure chemical ionization-mass spectrometry. Analytical chemistry. 2007;79:2940–2944. doi: 10.1021/ac062339v. [DOI] [PubMed] [Google Scholar]
- 50.Schouten S, Hopmans EC, Schefuß E, Sinninghe Damsté JS. Distributional variations in marine crenarchaeotal membrane lipids: a new tool for reconstructing ancient sea water temperatures? Earth and Planetary Science Letters. 2002;204:265–274. doi: 10.1016/S0012-821X(02)00979-2. [DOI] [Google Scholar]
- 51.Kim J-H, et al. New indices and calibrations derived from the distribution of crenarchaeal isoprenoid tetraether lipids: Implications for past sea surface temperature reconstructions. Geochimica et Cosmochimica Acta. 2010;74:4639–4654. doi: 10.1016/j.gca.2010.05.027. [DOI] [Google Scholar]
- 52.Schouten S, et al. The effect of temperature, salinity and growth rate on the stable hydrogen isotopic composition of long chain alkenones produced by Emiliania huxleyi and Gephyrocapsa oceanica. Biogeosciences. 2006;3:113–119. doi: 10.5194/bg-3-113-2006. [DOI] [Google Scholar]
- 53.McKay NP, Emile-Geay J. Technical note: The Linked Paleo Data framework – a common tongue for paleoclimatology. Clim. Past. 2016;12:1093–1100. doi: 10.5194/cp-12-1093-2016. [DOI] [Google Scholar]
- 54.Anand P, Elderfield H, Conte MH. Calibration of Mg/Ca thermometry in planktonic foraminifera from a sediment trap time series. Paleoceanography. 2003;18:1050. doi: 10.1029/2002pa000846. [DOI] [Google Scholar]
- 55.Gray WR, Evans D. Nonthermal Influences on Mg/Ca in Planktonic Foraminifera: A Review of Culture Studies and Application to the Last Glacial Maximum. Paleoceanography and Paleoclimatology. 2019;34:306–315. doi: 10.1029/2018pa003517. [DOI] [Google Scholar]
- 56.Khider D, et al. PaCTS 1.0: A Crowdsourced Reporting Standard for Paleoclimate Data. Paleoceanography and Paleoclimatology. 2019;34:1570–1596. doi: 10.1029/2019pa003632. [DOI] [Google Scholar]
- 57.Simon MH, 2020. A late Pleistocene dataset of Agulhas Current variability. SEANOE. [DOI] [PMC free article] [PubMed]
- 58.Simon MH, 2020. A late Pleistocene dataset of Agulhas Current variability. PANGAEA. [DOI] [PMC free article] [PubMed]
- 59.Boyle EA. Manganese carbonate overgrowths on foraminifera tests. Geochimica et Cosmochimica Acta. 1983;47:1815–1819. doi: 10.1016/0016-7037(83)90029-7. [DOI] [Google Scholar]
- 60.Pena LD, Calvo E, Cacho I, Eggins S, Pelejero C. Identification and removal of Mn-Mg-rich contaminant phases on foraminiferal tests: Implications for Mg/Ca past temperature reconstructions. Geochem. Geophys. Geosyst. 2005;6:Q09P02. doi: 10.1029/2005gc000930. [DOI] [Google Scholar]
- 61.Gray WR, et al. The effects of temperature, salinity, and the carbonate system on Mg/Ca in Globigerinoides ruber (white): A global sediment trap calibration. Earth and Planetary Science Letters. 2018;482:607–620. doi: 10.1016/j.epsl.2017.11.026. [DOI] [Google Scholar]
- 62.Evans D, Brierley C, Raymo ME, Erez J, Müller W. Planktic foraminifera shell chemistry response to seawater chemistry: Pliocene–Pleistocene seawater Mg/Ca, temperature and sea level change. Earth and Planetary Science Letters. 2016;438:139–148. doi: 10.1016/j.epsl.2016.01.013. [DOI] [Google Scholar]
- 63.Regenberg M, Regenberg A, Garbe-Schönberg D, Lea DW. Global dissolution effects on planktonic foraminiferal Mg/Ca ratios controlled by the calcite-saturation state of bottom waters. Paleoceanography. 2014;29:127–142. doi: 10.1002/2013PA002492. [DOI] [Google Scholar]
- 64.Dekens PS, Lea DW, Pak DK, Spero HJ. Core top calibration of Mg/Ca in tropical foraminifera: Refining paleotemperature estimation. Geochemistry, Geophysics, Geosystems. 2002;3:1–29. doi: 10.1029/2001gc000200. [DOI] [Google Scholar]
- 65.Regenberg M, et al. Assessing the effect of dissolution on planktonic foraminiferal Mg/Ca ratios: Evidence from Caribbean core tops. Geochemistry, Geophysics, Geosystems. 2006;7:Q07P15. doi: 10.1029/2005gc001019. [DOI] [Google Scholar]
- 66.Rosell-Melé A, Prahl FG. Seasonality of UK′37 temperature estimates as inferred from sediment trap data. Quaternary Science Reviews. 2013;72:128–136. doi: 10.1016/j.quascirev.2013.04.017. [DOI] [Google Scholar]
- 67.Mollenhauer G, et al. Asynchronous alkenone and foraminifera records from the Benguela Upwelling System. Geochimica et Cosmochimica Acta. 2003;67:2157–2171. doi: 10.1016/S0016-7037(03)00168-6. [DOI] [Google Scholar]
- 68.van Sebille E, et al. Ocean currents generate large footprints in marine palaeoclimate proxies. Nature Communications. 2015;6:6521. doi: 10.1038/ncomms7521. [DOI] [PubMed] [Google Scholar]
- 69.Tierney JE, Tingley MP. BAYSPLINE: A New Calibration for the Alkenone Paleothermometer. Paleoceanography and Paleoclimatology. 2018;33:281–301. doi: 10.1002/2017pa003201. [DOI] [Google Scholar]
- 70.Kim J-H, Schouten S, Hopmans EC, Donner B, Damsté JSS. Global sediment core-top calibration of the TEX86 paleothermometer in the ocean. Geochimica et Cosmochimica Acta. 2008;72:1154. doi: 10.1016/j.gca.2007.12.010. [DOI] [Google Scholar]
- 71.Tierney, J. E. In Treatise on Geochemistry (Second Edition) (eds Heinrich D. Holland & Karl K. Turekian) 379-393 (Elsevier, 2014).
- 72.Ho SL, Laepple T. Flat meridional temperature gradient in the early Eocene in the subsurface rather than surface ocean. Nature Geoscience. 2016;9:606–610. doi: 10.1038/ngeo2763. [DOI] [Google Scholar]
- 73.Tierney JE, Tingley MP. A Bayesian, spatially-varying calibration model for the TEX86 proxy. Geochimica et Cosmochimica Acta. 2014;127:83–106. doi: 10.1016/j.gca.2013.11.026. [DOI] [Google Scholar]
- 74.Rohling EJ. Paleosalinity: confidence limits and future applications. Marine Geology. 2000;163:1–11. doi: 10.1016/S0025-3227(99)00097-3. [DOI] [Google Scholar]
- 75.Tiwari M, et al. Oxygen isotope–salinity relationships of discrete oceanic regions from India to Antarctica vis-à-vis surface hydrological processes. Journal of Marine Systems. 2013;113–114:88–93. doi: 10.1016/j.jmarsys.2013.01.001. [DOI] [Google Scholar]
- 76.Grant KM, et al. Rapid coupling between ice volume and polar temperature over the past 150,000 years. Nature. 2012;491:744–747. doi: 10.1038/nature11593. [DOI] [PubMed] [Google Scholar]
- 77.Reason, C. J. C., Landman, W. & Tennant, W. Seasonal to decadal prediction of southern African climate and its links with variability of the Atlantic Ocean. Bulletin of the American Meteorological Society, 87(7), 941–955, 10.1175/BAMS-87-7-941 2006.
- 78.Hall, I. et al. Expedition 361 summary. Proceedings of the International Ocean Discovery Program361, 10.14379/iodp.proc.361.101.2017 (2017).
- 79.EPICA Eight glacial cycles from an Antarctic ice core. Nature. 2004;429:623–628. doi: 10.1038/nature02599. [DOI] [PubMed] [Google Scholar]
- 80.Ziegler M, et al. Development of Middle Stone Age innovation linked to rapid climate change. Nat Commun. 2013;4:1905. doi: 10.1038/ncomms2897. [DOI] [PMC free article] [PubMed] [Google Scholar]
Associated Data
This section collects any data citations, data availability statements, or supplementary materials included in this article.
Data Citations
- Simon MH, 2020. A late Pleistocene dataset of Agulhas Current variability. SEANOE. [DOI] [PMC free article] [PubMed]
- Simon MH, 2020. A late Pleistocene dataset of Agulhas Current variability. PANGAEA. [DOI] [PMC free article] [PubMed]