

Abstract
The purpose of the present study was to investigate the association of glutathione S‐transferase P1 (GSTP1) expression with resistance to neoadjuvant paclitaxel followed by 5‐fluorouracil/epirubicin/cyclophosphamide (P‐FEC) in human breast cancers. The relationship of GSTP1 expression and GSTP1 promoter hypermethylation with intrinsic subtypes was also investigated. In this study, primary breast cancer patients (n = 123, stage II–III) treated with neoadjuvant P‐FEC were analyzed. Tumor samples were obtained by vacuum‐assisted core biopsy before P‐FEC. GSTP1 expression was determined using immunohistochemistry, GSTP1 promoter methylation index (MI) using bisulfite methylation assay and intrinsic subtypes using DNA microarray. The pathological complete response (pCR) rate was significantly higher in GSTP1‐negative tumors (80.0%) than GSTP1‐positive tumors (30.6%) (P = 0.009) among estrogen receptor (ER)‐negative tumors but not among ER‐positive tumors (P = 0.267). Multivariate analysis showed that GSTP1 was the only predictive factor for pCR (P = 0.013) among ER‐negative tumors. Luminal A, luminal B and HER2‐enriched tumors showed a significantly lower GSTP1 positivity than basal‐like tumors (P = 0.002, P < 0.001 and P = 0.009, respectively), while luminal A, luminal B and HER2‐enriched tumors showed a higher GSTP1 MI than basal‐like tumors (P = 0.076, P < 0.001 and P < 0.001, respectively). In conclusion, these results suggest the possibility that GSTP1 expression can predict pathological response to P‐FEC in ER‐negative tumors but not in ER‐positive tumors. Additionally, GSTP1 promoter hypermethylation might be implicated more importantly in the pathogenesis of luminal A, luminal B and HER2‐enriched tumors than basal‐like tumors. (Cancer Sci 2012; 103: 913–920)
Neoadjuvant chemotherapy (NAC) for primary breast cancer patients is known to enhance the operability of patients with advanced tumors previously considered inoperable, as well as making breast‐conserving surgery more feasible for patients for whom such surgery was previously not feasible due to large tumor size. In addition, it is well established that patients who show a pathological complete response (pCR) to NAC can have a better prognosis than those who do not,1, 2, 3 so the response to NAC can provide valuable information regarding patient prognosis. These advantages of NAC have led to its widespread use including recently for a growing number of breast cancer patients. However, pCR rates for NAC of only 20–30% of patients are still rather low.4 Because adverse effects of various degrees of severity are seen in virtually all patients, it seems to be very important to develop predictive factors for the response to NAC to avoid the unnecessary use of NAC for patients who are unlikely to derive benefits from such therapy.
Among predictive factors, estrogen receptor (ER), progesterone receptor (PR), HER2, histological grade (HG) and Ki‐67 have been most extensively studied and significant associations of ER negativity, PR negativity, HER2 amplification, high histological grade or high Ki‐67 labeling index (LI) with high pCR rates have been reported.5, 6 In addition, intrinsic subtypes of breast tumors classified originally by molecular profiling and later with a simpler method (immunohistochemistry using various markers) have recently been shown to be associated with pCR.7, 8 Moreover, identification of a few multi‐gene classifiers for prediction of pCR based on DNA microarray analysis has been reported.9, 10 However, the accuracy of these predictive factors and multi‐gene classifiers is still not satisfactory so that more accurate and clinically useful predictive factors need to be developed.
Glutathione S‐transferase P1 (GSTP1), which belongs to phase two metabolic enzymes, is instrumental in the detoxification of toxic substances and anticancer drugs by conjugating them with glutathione.11 Moreover, GSTP1 reportedly inhibits the chemotherapy‐induced apoptosis by its direct interaction with the C‐terminal of JNK.12, 13 GSTP1 expression in tumor cells can thus be expected to be associated with resistance to chemotherapy. In fact, several in vitro studies using various human cancer cell lines have indicated that GSTP1 expression is associated with resistance to chemotherapy.14, 15 As for human breast cancers, GSTP1 expression was found to be associated with resistance to 5‐fluorouracil (5‐FU), doxorubicin and mitomycin C,16 as well as to paclitaxel and docetaxel.17 However, conflicting results have also been reported,18, 19 so that the relationship between GSTP1 expression and response to chemotherapy remains to be ascertained. Furthermore, even though the standard neoadjuvant chemotherapeutic regimen currently consists of a sequential taxane and anthracycline‐based regimen,5 the predictive value of GSTP1 expression for this standard regimen is yet to be studied.
In the present study, we investigated the association of GSTP1 expression with response to neoadjuvant sequential paclitaxel and anthracycline‐based chemotherapy. In addition, we also investigated the association of GSTP1 promoter hypermethylation with GSTP1 protein expression according to intrinsic subtypes since the former is reportedly associated with GSTP1 protein expression20 and intrinsic subtypes.21
Materials and methods
Patients and tumor samples
Primary breast cancer patients (n = 123, T1‐4b N0‐1 M0) who were consecutively recruited for the present study had been treated with NAC consisting of paclitaxel (80 mg/m2) weekly for 12 cycles followed by 5‐FU (500 mg/m2), epirubicin (75 mg/m2) and cyclophosphamide (500 mg/m2) every 3 weeks for four cycles (paclitaxel followed by 5‐fluorouracil/epirubicin/cyclophosphamide [P‐FEC]) at Osaka University Hospital between 2004 and 2010. The NAC was indicated for stage IIA–IIIB breast cancer patients. Prior to NAC, every patient underwent vacuum‐assisted core biopsy of tumors (Mammotome 8G; Ethicon Endosurgery, Johnson & Johnson, Cincinnati, OH, USA) under ultrasonographic guidance. The tumor samples obtained were then subjected to histological examination and DNA and RNA extraction. Tumor samples for histological examination were fixed in 10% buffered formaldehyde and those for extraction of DNA and RNA were snap frozen in liquid nitrogen and kept at −80°C until use. Inclusion of tumor cells in the biopsy samples for extraction of DNA and RNA was estimated using histological confirmation of tumor cells in the adjacent biopsy samples. The present study was approved by the Ethics Review Committee at Osaka University Hospital (Osaka, Japan) and informed consent was obtained from each patient before the core biopsy of tumors.
Evaluation of response to chemotherapy
Clinical response to P‐FEC was evaluated using magnetic resonance imaging (MRI), which was performed three times: before NAC, after paclitaxel and after P‐FEC. Tumor size was determined as tumor length × width (cm2). The reduction rate was calculated with the following formula: Reduction rate after chemotherapy (paclitaxel or P‐FEC) (%) = 100 × (tumor size before chemotherapy−tumor size after chemotherapy)/tumor size before chemotherapy. After NAC, all patients underwent breast‐conserving surgery or mastectomy. Pathological response to NAC was evaluated using histological examination of the surgical specimens, which were sliced at 5 mm intervals. Pathological complete response was defined as no evidence of residual invasive cancer in both breast and axilla.
Immunohistological assay
Glutathione S‐transferase P1 expression in the biopsy samples was examined using immunohistochemistry with rabbit anti‐GST‐Pi polyclonal antibody (Medical & Biological Laboratories Co., Ltd, Nagoya, Japan) at a dilution of 1:1000 according to the method previously described for ER, PR and Ki‐67 with a slight modification, in that antigen retrieval was accomplished by incubating at 98°C in citrate buffer (pH 6.0) for 40 min.22, 23 Percentage of Ki‐67‐positive tumor cells (Ki‐67 labeling index [Ki‐67 LI]) was determined using WinROOF (Mitani, Tokyo, Japan) for counting the nuclear‐stained tumor cells,24 and percentage of GSTP1‐positive tumor cells (GSTP1 labeling index [GSTP1 LI]) was determined by manually counting the cytoplasmic‐stained tumor cells. GSTP1 was classified as positive when 10% or more of tumor cells were stained, because this cut‐off value was often used in previous reports17, 25 and considered to be suitable for representing the biology of GSTP1‐positive tumors. Cut‐off values for ER, PR and Ki‐67 were 10%, 10% and 20%, respectively. HER2 amplification was determined by means of fluorescence in situ hybridization (FISH) as previously described.26 For FISH scoring, a tumor was considered to be HER2 amplified when the FISH ratio was ≥2.0. The histological grade (HG) was determined according to the Scarff–Bloom–Richardson grading system.27
GSTP1 promoter methylation
DNA extraction26 and DNA bisulfite conversion28 were done according to the manufacturer's protocol as previously described. The methylation status of the GSTP1 DNA promoter region was evaluated by using a real‐time methylation‐specific polymerase chain reaction (MSP) according to the previously described method.28 The primers and probe sets used for methylated GSTP1 and for unmethylated GSTP1 are shown in Supporting Information Table S1 and conditions for MSP are shown in Table S2. The standard curve was constructed for each run to calculate by using standard oligonucleotides as templates, the copy number of methylated and unmethylated DNA. The sequence of standard oligonucleotides for methylated and unmethylated assays of the GSTP1 promoter region is shown in Table S3. Epitect Control DNA Set (Qiagen, Valencia, CA, USA) was used as both positive and negative controls for methylated alleles. Each sample was assayed in triplicate. When at least one triplicate assay was below the detection limit, the sample was defined as negative. The methylation index (MI) was calculated as follows: MI (%) = 100 × methylated GSTP1 copy numbers/(methylated + unmethylated GSTP1 copy numbers).
Intrinsic subtypes determined by DNA microarray
RNA was extracted by means of Trizol (Invitrogen, Carlsbad, CA, USA) from tumor biopsy samples. Gene expression analysis using a DNA microarray (Human Genome U133 Plus 2.0 Array; Affymetrics, Santa Clara, CA, USA) was done according to the method previously described9 and classification of intrinsic subtypes (luminal A, luminal B, HER2‐enriched, basal‐like and normal breast‐like) was done according to a PAM50 method reported by Parker et al.29 The microarray data is available online at the Gene Expression Omnibus website30 with accession number GSE32646.
Statistical analysis
The SPSS software package version 11.0.1 (SPSS Inc., Chicago, IL, USA) was used for statistical analyses. Association between the various parameters was assessed using Chi‐squared test or Fisher's exact test. Univariate and multivariate analysis (logistic regression model) were done to assess the association of the various parameters with pCR. Differences in GSTP1 MI and tumor reduction rates were evaluated using Mann–Whitney's U‐test for two groups or the Kruskal–Wallis test for more than two groups. Paired t‐test and McNemar's test were used for comparison of MI and positivity of GSTP1 in matched‐pair tumor samples before and after NAC, respectively. All statistical analyses were two‐sided and P values < 0.050 were considered to be statistically significant.
Results
Relationship of GSTP1 expression or GSTP1 promoter hypermethylation with clinicopathological parameters
GSTP1 protein expression was examined immunohistochemically in 123 breast tumors. Representative results of immunohistochemical staining are shown in Figure 1A,B. First, we investigated the association of GSTP1 expression among total breast tumors with clinicopathological characteristics and found that GSTP1‐positive tumors were significantly more likely to be ER negative (P < 0.001) and PR negative (P = 0.002, Table 1). The ER‐negative tumors showed a significantly higher GSTP1 LI than ER‐positive tumors (P < 0.001, Fig. S1). In addition, GSTP1 positivity significantly varied according to histological grade (HG) (P = 0.022), that is, HG2 tumors showed a lower positivity (32/81, 39.5%) than HG1 tumors (9/19, 47.4%) and HG3 tumors (16/22, 72.7%) (Table 1).
Figure 1.
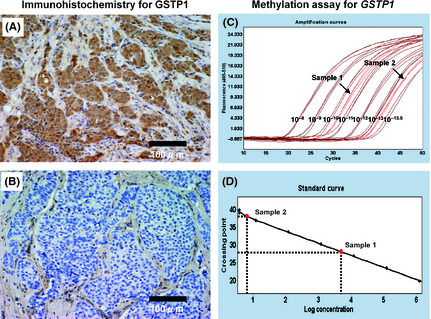
Immunohistochemical staining and methylation assay for glutathione S‐transferase P1 (GSTP1). Representative immunohistochemical results for GSTP1 are shown in (A) positive staining and (B) negative staining. Representative results of a real‐time PCR assay for GSTP1 promoter hypermethylation are shown in (C) amplification curves for two samples and seven standards (diluted at 10−8, 10−9, 10−10, 10−11, 10−12, 10−13 and 10−13.5) and in (D) the standard curve for calculation of the copy number.
Table 1.
Association of glutathione S‐transferase P1 (GSTP1) expression with clinicopathological characteristics of breast tumors
| GSTP1 expression | Total | GSTP1 immunohistochemistry | ||
|---|---|---|---|---|
| Positive | Negative | P value | ||
| Menopausal status | ||||
| Pre | 57 | 27 | 30 | 0.965 |
| Post | 66 | 31 | 35 | |
| Tumor size | ||||
| T1 | 7 | 5 | 2 | 0.242 |
| T2 | 93 | 42 | 51 | |
| T3 | 18 | 7 | 11 | |
| T4 | 5 | 4 | 1 | |
| Nodal status | ||||
| Positive | 88 | 44 | 44 | 0.316 |
| Negative | 35 | 14 | 21 | |
| Histological grade | ||||
| 1 | 19 | 9 | 10 | 0.022 |
| 2 | 81 | 32 | 49 | |
| 3 | 22 | 16 | 6 | |
| Unknown | 1 | 1 | 0 | |
| ER | ||||
| Positive | 77 | 22 | 55 | <0.001 |
| Negative | 46 | 36 | 10 | |
| PR | ||||
| Positive | 47 | 14 | 33 | 0.002 |
| Negative | 76 | 44 | 32 | |
| HER2 | ||||
| Positive | 35 | 19 | 16 | 0.318 |
| Negative | 88 | 39 | 49 | |
| Ki‐67 | ||||
| Positive | 70 | 35 | 35 | 0.386 |
| Negative | 50 | 21 | 29 | |
| Unknown | 3 | 2 | 1 | |
ER, estrogen receptor; PR, progesterone receptor.
Next, the relationships of GSTP1 MI with various parameters were examined in 109 of the 123 breast tumors. Representative results of a real‐time PCR assay for GSTP1 promoter hypermethylation are shown in Figure 1C,D. GSTP1‐positive tumors (n = 50) showed a significantly lower GSTP1 MI than GSTP1‐negative tumors (n = 59) (P < 0.001, Fig. 2A), while ER‐positive tumors (n = 67) showed a significantly higher GSTP1 MI than ER‐negative tumors (n = 42) (P = 0.020, Fig. 2B). There was no significant difference in GSTP1 MI between PR‐positive (n = 40) and PR‐negative (n = 69) tumors (P = 0.279, Fig. 2C). HG2 tumors (n = 71) showed a significantly higher GSTP1 MI than HG1 tumors (n = 18) (P = 0.030) and HG3 tumors (n = 19) (P = 0.008, Fig. 2D). The subset analysis according to ER status showed that in ER‐positive tumors GSTP1 MI was significantly higher in HG2 tumors (n = 46) than HG1 tumors (n = 17) (P = 0.002, Fig. 2E), and that in ER‐negative tumors there was no significant difference in GSTP1 MI between HG2 (n = 25) and HG3 tumors (n = 16) (P = 0.738, Fig. 2F). In ER‐positive tumors, HG2 tumors (10/53, 18.9%) showed a tendency (P = 0.057) toward lower GSTP1 positivity than HG1 tumors (8/18, 44.4%) (Table S4). Relationships between GSTP1 MI and other clinicopathological characteristics are shown in Figures S2–S4.
Figure 2.
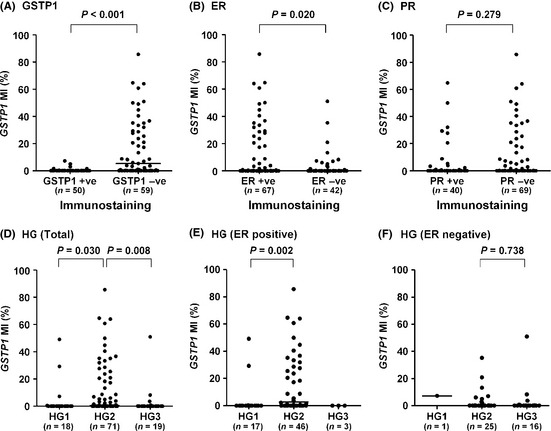
Glutathione S‐transferase P1 (GSTP1) methylation index according to GSTP1, estrogen receptor (ER), progesterone receptor (PR) and histological grade. Comparison of GSTP1 methylation index (MI) between (A) GSTP1‐positive and GSTP1‐negative tumors, (B) ER‐positive and ER‐negative tumors, (C) PR‐positive and PR‐negative tumors, (D) histological grade 2 (HG2) and HG1 or HG3 tumors in total tumors, (E) HG1 and HG2 tumors in ER‐positive tumors and (F) HG2 and HG3 tumors in ER‐negative tumors. −ve, negative; +ve, positive; bars, median.
GSTP1 expression and response to paclitaxel or P‐FEC
Clinical response to paclitaxel or P‐FEC was evaluated in terms of reduction rates in tumor size as determined using MRI. Because GSTP1 expression is significantly associated with ER status, which is a major determinant for response to chemotherapy, ER‐positive (n = 77) and ER‐negative (n = 46) tumors were subjected to further analysis, separately. As for the response to paclitaxel, GSTP1 positivity was significantly associated with a poor response in ER‐positive tumors (P < 0.001, Fig. 3A) and showed a tendency towards a poor response in ER‐negative tumors (P = 0.071, Fig. 3B). As for the response to P‐FEC, GSTP1 positivity was significantly associated with a poor response in both ER‐positive tumors (P = 0.037, Fig. 3A) and ER‐negative tumors (P = 0.045, Fig. 3B).
Figure 3.
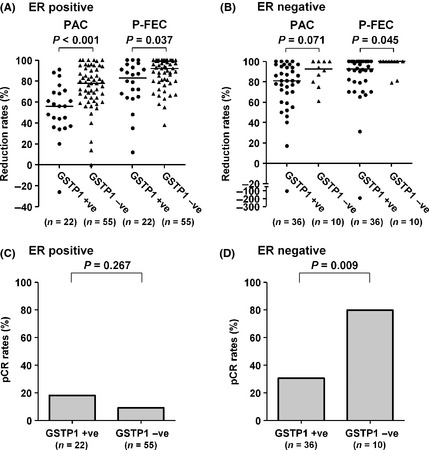
Clinical and pathological response to paclitaxel or P‐FEC. Comparison of clinical response to paclitaxel or P‐FEC between glutathione S‐transferase P1 (GSTP1)‐positive and GSTP1‐negative tumors in (A) estrogen receptor (ER)‐positive tumors and (B) ER‐negative tumors. Pathological response to paclitaxel or P‐FEC was also compared between GSTP1‐positive and GSTP1‐negative tumors in (C) ER‐positive tumors and (D) ER‐negative tumors. PAC, paclitaxel; P‐FEC, paclitaxel followed by combined 5‐ fluorouracil/epirubicin/cyclophosphamide; pCR, pathological complete response; −ve, negative; +ve, positive; bars, median.
Pathological response to P‐FEC was evaluated using histological examination of the surgical specimens after P‐FEC. The ER‐negative tumors showed a significant difference in pCR rate between GSTP1‐positive (11/36, 30.6%) and GSTP1‐negative (8/10, 80.0%) tumors (P = 0.009, Fig. 3D), but ER‐positive tumors did not (P = 0.267, Fig. 3C). Association of the various parameters with pCR according to ER status is shown in Table 2. No other parameters were found to be significant except for GSTP1 expression in ER‐negative tumors (P = 0.009). Besides, we performed multivariate analysis of the various parameters to show the independency of GSTP1 from the other parameters in the prediction of pCR and found that GSTP1 was the only predictive factor for pCR (P = 0.013) in ER‐negative tumors (Table S5).
Table 2.
Univariate analysis of the association of clinicopathological parameters and glutathione S‐transferase P1 (GSTP1) expression with pathological complete response (pCR)
| ER‐positive tumors (n = 77) | ER‐negative tumors (n = 46) | |||||
|---|---|---|---|---|---|---|
| pCR | Non‐pCR | P value† | pCR | Non‐pCR | P value† | |
| Menopausal status | ||||||
| Pre | 3 | 37 | 0.299 | 5 | 12 | 0.210 |
| Post | 6 | 31 | (2.39, 0.55–10.31) | 14 | 15 | (2.24, 0.63–8.00) |
| Tumor size‡ | ||||||
| T1 | 1 | 4 | 0.191 | 1 | 1 | 0.682 |
| T2 | 8 | 48 | (5.97, 0.33–108.70) | 16 | 21 | (1.93, 0.33–11.24) |
| T3 | 0 | 13 | 2 | 3 | ||
| T4 | 0 | 3 | 0 | 2 | ||
| Nodal status | ||||||
| Positive | 6 | 43 | 1.000 | 18 | 21 | 0.213 |
| Negative | 3 | 25 | (1.16, 0.27–5.06) | 1 | 6 | (5.14, 0.57–46.82) |
| Histological grade§ | ||||||
| 1 | 2 | 16 | 0.477 | 0 | 1 | 0.989 |
| 2 | 6 | 47 | (1.97, 0.20–19.86) | 12 | 16 | (0.99, 0.29–3.35) |
| 3 | 1 | 4 | 7 | 10 | ||
| Unknown | 0 | 1 | 0 | 0 | ||
| PR | ||||||
| Positive | 5 | 42 | 0.730 | – | – | – |
| Negative | 4 | 26 | (1.29, 0.32–5.26) | |||
| HER2 | ||||||
| Positive | 3 | 13 | 0.383 | 9 | 10 | 0.483 |
| Negative | 6 | 55 | (2.12, 0.47–9.60) | 10 | 17 | (1.53, 0.46–5.04) |
| Ki‐67 | ||||||
| Positive | 5 | 28 | 0.495 | 17 | 20 | 0.435 |
| Negative | 4 | 38 | (1.70, 0.42–6.90) | 2 | 6 | (2.55, 0.45–14.33) |
| Unknown | 0 | 2 | 0 | 1 | ||
| GSTP1 expression | ||||||
| Positive | 4 | 18 | 0.267 | 11 | 25 | 0.009 |
| Negative | 5 | 50 | (0.45, 0.11–1.86) | 8 | 2 | (9.09, 1.65–50.00) |
ER, estrogen receptor; PR, progesterone receptor. †Odds ratio, 95% confidence interval. ‡T1 + T2 versus T3 + T4. §HG1 + HG2 versus HG3.
GSTP1 expression and GSTP1 MI according to intrinsic subtype
Of the 123 tumors, 115 could be analyzed using DNA microarray and classified into the five intrinsic subtypes, that is, luminal A (n = 32), luminal B (n = 22), HER2‐enriched (n = 23), basal‐like (n = 21) and normal breast‐like (n = 17). Since the normal breast‐like subtype was thought to be mainly an artifact of having a high percentage of normal ‘contamination’ in the tumor specimen,29 this subtype was eliminated from further analysis. With respect to GSTP1 MI (Fig. 4A), luminal A, luminal B and HER2‐enriched tumors showed a higher GSTP1 MI than basal‐like tumors (P = 0.076, P < 0.001 and P < 0.001, respectively). Moreover, luminal B and HER2‐enriched tumors showed a significantly higher GSTP1 MI than luminal A tumors (P = 0.006 and P = 0.031, respectively). Figure 4B shows GSTP1 positivity according to the intrinsic subtype. Luminal A (13/32, 40.6%), luminal B (3/22, 13.6%) and HER2‐enriched (10/23, 43.5%) tumors showed a significantly lower GSTP1 positivity than the basal‐like tumors (18/21, 85.7%) (P = 0.002, P < 0.001 and P = 0.009, respectively). In addition, luminal B tumors showed a significantly lower GSTP1 positivity than luminal A (P = 0.039) and HER2‐enriched tumors (P = 0.027).
Figure 4.
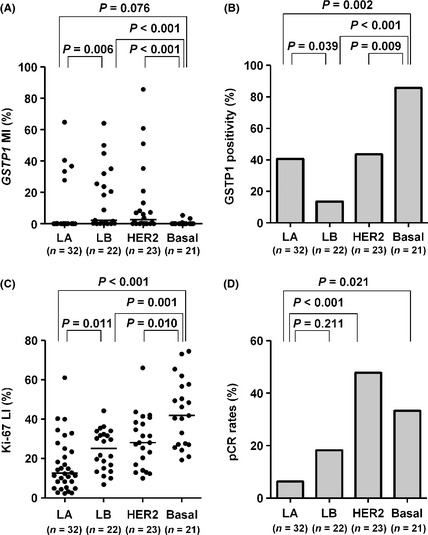
Glutathione S‐transferase P1 (GSTP1) methylation index (MI), GSTP1 positivity, Ki‐67 labeling index (LI) and pCR rates according to intrinsic subtypes. (A) GSTP1 MI, (B) GSTP1 positivity, (C) Ki‐67 LI and (D) pCR rates are shown by intrinsic subtypes as determined using DNA microarray. bars, median; Basal, basal‐like; HER2, HER2‐enriched; LA, luminal A; LB, luminal B; pCR, pathological complete response.
Figure 4C shows the distribution of Ki‐67 LI according to intrinsic subtypes. Luminal B tumors showed a significantly higher Ki‐67 LI than luminal A tumors (P = 0.011), while it was the highest in basal‐like tumors, and significantly higher than luminal A (P < 0.001), luminal B (P = 0.001) or HER2‐enriched tumors (P = 0.010). Figure 4D shows the pCR rates according to intrinsic subtypes. Luminal A tumors showed the lowest pCR rate (2/32, 6.3%) and it was lower than that of luminal B (4/22, 18.2%) (P = 0.211), HER2‐enriched (11/23, 47.8%) (P < 0.001) and basal‐like tumors (7/21, 33.3%) (P = 0.021). The relationship of intrinsic subtypes with ER, PR, HER2 or Ki‐67 status is shown in Table S6.
GSTP1 MI and GSTP1 expression in residual tumors after NAC
GSTP1 MI and GSTP1 expression in the residual tumors (n = 38) after NAC were compared with those before NAC. There was no significant change in GSTP1 MI (P = 0.497) or GSTP1 expression (P = 0.125) between them (Fig. S5).
Discussion
The main purpose of the present study was to investigate whether GSTP1 expression was associated with resistance to P‐FEC in human breast cancers since GSTP1 is thought to be implicated in chemoresistance through the detoxification of chemotherapeutic agents and inhibition of chemotherapy‐induced apoptosis. First, we investigated the relationship of GSTP1 expression with various clinicopathological parameters and found that GSTP1 expression was significantly associated with ER negativity and PR negativity, findings that are consistent with those previously reported.18, 31 In addition, GSTP1‐positive tumors tended to be low histological grade (HG1) in ER‐positive tumors but not in ER‐negative tumors. Because GSTP1 promoter hypermethylation has been shown to play an important role in silencing GSTP1, we investigated the relationship between this hypermethylation and GSTP1 expression. We were able to show that GSTP1‐positive tumors were significantly less likely than GSTP1‐negative tumors to possess GSTP1 promoter hypermethylation, while ER‐negative and PR‐negative tumors were less likely than their opposites to possess GSTP1 promoter hypermethylation, confirming its important role in silencing GSTP1. Interestingly, GSTP1 MI was significantly higher in HG2 tumors than HG1 tumors in ER‐positive tumors, while there was no association between GSTP1 MI and HG in ER‐negative tumors. These results seem to suggest that GSTP1 hypermethylation plays an important role in the pathogenesis of ER‐positive tumors with relatively high histological grade (HG2). This is consistent with the hypothesis that loss of GSTP1 expression caused by promoter hypermethylation results in the diminished detoxification of DNA‐damaging estrogen metabolites such as E2‐2,3‐Q and E2‐3,4‐Q32, 33 and in the development of breast tumors with relatively high histological grade.
Next, we investigated the relationship between GSTP1 expression and clinical response (reduction rate) to paclitaxel or P‐FEC. We were able to show that GSTP1 expression was associated with a poor response to paclitaxel as well as to P‐FEC in both ER‐positive and ER‐negative tumors, indicating that GSTP1 plays a significant role in the suppression of antitumor activity of P‐FEC irrespective of ER status. In contrast, univariate and multivariate analysis of the pathological response to P‐FEC showed that only GSTP1 expression was significantly associated with a lower pCR rate in ER‐negative tumors but not in ER‐positive tumors. It has been well established that the pCR rate of ER‐positive tumors in response to NAC is lower than that of ER‐negative tumors,5 and the pCR rate was in fact significantly lower in ER‐positive tumors (11.7%) than ER‐negative tumors (41.3%) in the present study also (P < 0.001). Thus, a low pCR rate might mask the impact of GSTP1 on the resistance to P‐FEC in ER‐positive tumors. It is also possible that ER‐positive tumors possess other important resistant mechanisms than GSTP1, which together determine the overall pathological response.
We also investigated the relationship between GSTP1 expression or GSTP1 promoter hypermethylation and intrinsic subtypes. We found that luminal A, luminal B and HER2‐enriched tumors were more likely to harbor GSTP1 promoter hypermethylation than basal‐like tumors, which suggests that GSTP1 promoter hypermethylation might be implicated more importantly in the pathogenesis of luminal A, luminal B and HER2‐enriched tumors than basal‐like tumors. It is suggested that luminal A, luminal B and HER2‐enriched tumors originate from luminal progenitor cells.34, 35 Thus, it is speculated that loss of GSTP1 expression results in DNA damage caused by estrogen metabolites,32, 33 and that luminal progenitor cells, which are thought to be ER positive, are more frequently affected since ER‐positive cells are considered to have a higher concentration of estrogens.
Another interesting finding of the present study being consistent with a previous report21 was that GSTP1 promoter hypermethylation was rarely observed in basal‐like tumors, while most of the basal‐like tumors expressed GSTP1. Recently, Honeth et al.36 reported that basal‐like tumors had a breast cancer stem cell‐like phenotype. These results seem to suggest that breast cancer stem cells feature high GSTP1 expression. Indeed, Croker and Allan37 very recently reported that GSTP1 was strongly expressed in breast cancer stem cells (ALDH1+/CD44+). Because basal‐like tumors show a higher Ki‐67 LI than HER2‐enriched tumors and a high Ki‐67 LI is well known to be associated with a good response to chemotherapy,6 basal‐like tumors could be expected to show a higher pCR rate than HER2‐enriched tumors, but in fact we found that the reverse was true. It seems that this lower pCR rate of basal‐like tumors can be partially explained by their higher GSTP1 expression.
In conclusion, we found that GSTP1 expression was associated with a lower clinical response to P‐FEC irrespective of ER status and with a lower pCR rate of ER‐negative but not ER‐positive tumors. GSTP1 seems to have the potential to be used for clinical identification of, especially, ER‐negative breast tumors, which are unlikely to derive benefits from chemotherapy (P‐FEC). In addition, our results might suggest that GSTP1 promoter hypermethylation is implicated more importantly in the pathogenesis of luminal A, luminal B and HER2‐enriched tumors than basal‐like tumors. Our observations presented here are preliminary and need to be confirmed by a future study covering a larger number of patients. Thus, the clinical significance of GSTP1 in the prediction of response to chemotherapy still remains to be established in future.
Disclosure Statement
S. N. received research funding from Pfizer and Bristol‐Myers Squibb, and Honoraria from Pfizer; S. J. K. received honoraria from Pfizer and Bristol‐Myers Squibb; T. N. received Honoraria from Pfizer; the other authors have no conflict of interest.
Supporting information
Fig. S1. GSTP1 LI according to ER status.
Fig. S2. Distribution of GSTP1 MI according to clinicopathological characteristics of total patients.
Fig. S3. Distribution of GSTP1 MI according to clinicopathological characteristics of patients with ER‐positive tumors.
Fig. S4. Distribution of GSTP1 MI according to clinicopathological characteristics of patients with ER‐negative tumors.
Fig. S5. Comparison of GSTP1 MI and GSTP1 expression in tumors before and after NAC.
Table S1. Sequences of primers and probe sets for methylated GSTP1 and for unmethylated GSTP1.
Table S2. Conditions for methylation‐specific PCR.
Table S3. Sequences of standard oligonucleotides for methylated and unmethylated assays of GSTP1 promoter region.
Table S4. Relationship between GSTP1 expression and histological grade according to ER status.
Table S5. Multivariate analysis of various parameters in the prediction of pCR in ER‐negative tumors.
Table S6. Relationship between intrinsic subtypes and ER, PR, HER2 or Ki‐67.
Acknowledgments
The authors are grateful to Hiroshi Ohashi, M.D. of the Department of Pathology at Osaka University Hospital for his contribution to pathological diagnosis. This work was funded, in part, by Promotion of Cancer Research (Japan) for the 3rd Term Comprehensive 10‐Year Strategy for Cancer Control.
References
- 1. Kuerer HM, Newman LA, Smith TL et al Clinical course of breast cancer patients with complete pathologic primary tumor and axillary lymph node response to doxorubicin‐based neoadjuvant chemotherapy. J Clin Oncol 1999; 17: 460–9. [DOI] [PubMed] [Google Scholar]
- 2. Bear HD, Anderson S, Smith RE et al Sequential preoperative or postoperative docetaxel added to preoperative doxorubicin plus cyclophosphamide for operable breast cancer: National Surgical Adjuvant Breast and Bowel Project Protocol B‐27. J Clin Oncol 2006; 24: 2019–27. [DOI] [PubMed] [Google Scholar]
- 3. Liedtke C, Mazouni C, Hess KR et al Response to neoadjuvant therapy and long‐term survival in patients with triple‐negative breast cancer. J Clin Oncol 2008; 26: 1275–81. [DOI] [PubMed] [Google Scholar]
- 4. Sachelarie I, Grossbard ML, Chadha M, Feldman S, Ghesani M, Blum RH. Primary systemic therapy of breast cancer. Oncologist 2006; 11: 574–89. [DOI] [PubMed] [Google Scholar]
- 5. Kaufmann M, von Minckwitz G, Bear HD et al Recommendations from an international expert panel on the use of neoadjuvant (primary) systemic treatment of operable breast cancer: new perspectives 2006. Ann Oncol 2007; 18: 1927–34. [DOI] [PubMed] [Google Scholar]
- 6. Colleoni M, Viale G, Goldhirsch A. Lessons on responsiveness to adjuvant systemic therapies learned from the neoadjuvant setting. Breast 2009; 18(Suppl. 3): S137–40. [DOI] [PubMed] [Google Scholar]
- 7. Prat A, Perou CM. Deconstructing the molecular portraits of breast cancer. Mol Oncol 2011; 5: 5–23. [DOI] [PMC free article] [PubMed] [Google Scholar]
- 8. Goldstein NS, Decker D, Severson D et al Molecular classification system identifies invasive breast carcinoma patients who are most likely and those who are least likely to achieve a complete pathologic response after neoadjuvant chemotherapy. Cancer 2007; 110: 1687–96. [DOI] [PubMed] [Google Scholar]
- 9. Naoi Y, Kishi K, Tanei T et al Prediction of pathologic complete response to sequential paclitaxel and 5‐fluorouracil/epirubicin/cyclophosphamide therapy using a 70‐gene classifier for breast cancers. Cancer 2011; 117: 3682–90. [DOI] [PubMed] [Google Scholar]
- 10. Ayers M, Symmans WF, Stec J et al Gene expression profiles predict complete pathologic response to neoadjuvant paclitaxel and fluorouracil, doxorubicin, and cyclophosphamide chemotherapy in breast cancer. J Clin Oncol 2004; 22: 2284–93. [DOI] [PubMed] [Google Scholar]
- 11. Coles BF, Kadlubar FF. Detoxification of electrophilic compounds by glutathione S‐transferase catalysis: determinants of individual response to chemical carcinogens and chemotherapeutic drugs? BioFactors 2003; 17: 115–30. [DOI] [PubMed] [Google Scholar]
- 12. Laborde E. Glutathione transferases as mediators of signaling pathways involved in cell proliferation and cell death. Cell Death Differ 2010; 17: 1373–80. [DOI] [PubMed] [Google Scholar]
- 13. Adler V, Yin Z, Fuchs SY et al Regulation of JNK signaling by GSTp. EMBO J 1999; 18: 1321–34. [DOI] [PMC free article] [PubMed] [Google Scholar]
- 14. Satta T, Isobe K, Yamauchi M, Nakashima I, Takagi H. Expression of MDR1 and glutathione S transferase‐pi genes and chemosensitivities in human gastrointestinal cancer. Cancer 1992; 69: 941–6. [DOI] [PubMed] [Google Scholar]
- 15. Whelan RD, Waring CJ, Wolf CR, Hayes JD, Hosking LK, Hill BT. Over‐expression of P‐glycoprotein and glutathione S‐transferase pi in MCF‐7 cells selected for vincristine resistance in vitro . Int J Cancer 1992; 52: 241–6. [DOI] [PubMed] [Google Scholar]
- 16. Su F, Hu X, Jia W, Gong C, Song E, Hamar P. Glutathion S transferase pi indicates chemotherapy resistance in breast cancer. J Surg Res 2003; 113: 102–8. [DOI] [PubMed] [Google Scholar]
- 17. Arai T, Miyoshi Y, Kim SJ et al Association of GSTP1 expression with resistance to docetaxel and paclitaxel in human breast cancers. Eur J Surg Oncol 2008; 34: 734–8. [DOI] [PubMed] [Google Scholar]
- 18. Peters WH, Roelofs HM, van Putten WL, Jansen JB, Klijn JG, Foekens JA. Response to adjuvant chemotherapy in primary breast cancer: no correlation with expression of glutathione S‐transferases. Br J Cancer 1993; 68: 86–92. [DOI] [PMC free article] [PubMed] [Google Scholar]
- 19. Schmidt M, Bachhuber A, Victor A et al p53 expression and resistance against paclitaxel in patients with metastatic breast cancer. J Cancer Res Clin Oncol 2003; 129: 295–302. [DOI] [PubMed] [Google Scholar]
- 20. Esteller M, Corn PG, Urena JM, Gabrielson E, Baylin SB, Herman JG. Inactivation of glutathione S‐transferase P1 gene by promoter hypermethylation in human neoplasia. Cancer Res 1998; 58: 4515–8. [PubMed] [Google Scholar]
- 21. Holm K, Hegardt C, Staaf J et al Molecular subtypes of breast cancer are associated with characteristic DNA methylation patterns. Breast Cancer Res 2010; 12: R36. [DOI] [PMC free article] [PubMed] [Google Scholar]
- 22. Tanei T, Morimoto K, Shimazu K et al Association of breast cancer stem cells identified by aldehyde dehydrogenase 1 expression with resistance to sequential Paclitaxel and epirubicin‐based chemotherapy for breast cancers. Clin Cancer Res 2009; 15: 4234–41. [DOI] [PubMed] [Google Scholar]
- 23. Shimomura A, Miyoshi Y, Taguchi T, Tamaki Y, Noguchi S. Association of loss of BRCA1 expression with centrosome aberration in human breast cancer. J Cancer Res Clin Oncol 2009; 135: 421–30. [DOI] [PubMed] [Google Scholar]
- 24. Morimoto K, Kim SJ, Tanei T et al Stem cell marker aldehyde dehydrogenase 1‐positive breast cancers are characterized by negative estrogen receptor, positive human epidermal growth factor receptor type 2, and high Ki67 expression. Cancer Sci 2009; 100: 1062–8. [DOI] [PMC free article] [PubMed] [Google Scholar]
- 25. Huang J, Tan PH, Thiyagarajan J, Bay BH. Prognostic significance of glutathione S‐transferase‐pi in invasive breast cancer. Mod Pathol 2003; 16: 558–65. [DOI] [PubMed] [Google Scholar]
- 26. Oshima K, Naoi Y, Kishi K et al Gene expression signature of TP53 but not its mutation status predicts response to sequential paclitaxel and 5‐FU/epirubicin/cyclophosphamide in human breast cancer. Cancer Lett 2011; 307: 149–57. [DOI] [PubMed] [Google Scholar]
- 27. Bloom HJ, Richardson WW. Histological grading and prognosis in breast cancer; a study of 1409 cases of which 359 have been followed for 15 years. Br J Cancer 1957; 11: 359–77. [DOI] [PMC free article] [PubMed] [Google Scholar]
- 28. Iwamoto T, Yamamoto N, Taguchi T, Tamaki Y, Noguchi S. BRCA1 promoter methylation in peripheral blood cells is associated with increased risk of breast cancer with BRCA1 promoter methylation. Breast Cancer Res Treat 2011; 129: 69–77. [DOI] [PubMed] [Google Scholar]
- 29. Parker JS, Mullins M, Cheang MC et al Supervised risk predictor of breast cancer based on intrinsic subtypes. J Clin Oncol 2009; 27: 1160–7. [DOI] [PMC free article] [PubMed] [Google Scholar]
- 30. Barrett T, Edgar R. Gene expression omnibus: microarray data storage, submission, retrieval, and analysis. Methods Enzymol 2006; 411: 352–69. [DOI] [PMC free article] [PubMed] [Google Scholar]
- 31. Gilbert L, Elwood LJ, Merino M et al A pilot study of pi‐class glutathione S‐transferase expression in breast cancer: correlation with estrogen receptor expression and prognosis in node‐negative breast cancer. J Clin Oncol 1993; 11: 49–58. [DOI] [PubMed] [Google Scholar]
- 32. Hachey DL, Dawling S, Roodi N, Parl FF. Sequential action of phase I and II enzymes cytochrome p450 1B1 and glutathione S‐transferase P1 in mammary estrogen metabolism. Cancer Res 2003; 63: 8492–9. [PubMed] [Google Scholar]
- 33. Dawling S, Hachey DL, Roodi N, Parl FF. In vitro model of mammary estrogen metabolism: structural and kinetic differences between catechol estrogens 2‐ and 4‐hydroxyestradiol. Chem Res Toxicol 2004; 17: 1258–64. [DOI] [PubMed] [Google Scholar]
- 34. Pratt MA, Tibbo E, Robertson SJ et al The canonical NF‐kappaB pathway is required for formation of luminal mammary neoplasias and is activated in the mammary progenitor population. Oncogene 2009; 28: 2710–22. [DOI] [PubMed] [Google Scholar]
- 35. Stingl J, Caldas C. Molecular heterogeneity of breast carcinomas and the cancer stem cell hypothesis. Nat Rev Cancer 2007; 7: 791–9. [DOI] [PubMed] [Google Scholar]
- 36. Honeth G, Bendahl PO, Ringner M et al The CD44 + /CD24‐ phenotype is enriched in basal‐like breast tumors. Breast Cancer Res 2008; 10: R53. [DOI] [PMC free article] [PubMed] [Google Scholar]
- 37. Croker AK, Allan AL. Inhibition of aldehyde dehydrogenase (ALDH) activity reduces chemotherapy and radiation resistance of stem‐like ALDH(hi)CD44 (+) human breast cancer cells. Breast Cancer Res Treat 2011; doi: 10.1007/s10549‐011‐1692‐y [Epub ahead of print]. [DOI] [PubMed] [Google Scholar]
Associated Data
This section collects any data citations, data availability statements, or supplementary materials included in this article.
Supplementary Materials
Fig. S1. GSTP1 LI according to ER status.
Fig. S2. Distribution of GSTP1 MI according to clinicopathological characteristics of total patients.
Fig. S3. Distribution of GSTP1 MI according to clinicopathological characteristics of patients with ER‐positive tumors.
Fig. S4. Distribution of GSTP1 MI according to clinicopathological characteristics of patients with ER‐negative tumors.
Fig. S5. Comparison of GSTP1 MI and GSTP1 expression in tumors before and after NAC.
Table S1. Sequences of primers and probe sets for methylated GSTP1 and for unmethylated GSTP1.
Table S2. Conditions for methylation‐specific PCR.
Table S3. Sequences of standard oligonucleotides for methylated and unmethylated assays of GSTP1 promoter region.
Table S4. Relationship between GSTP1 expression and histological grade according to ER status.
Table S5. Multivariate analysis of various parameters in the prediction of pCR in ER‐negative tumors.
Table S6. Relationship between intrinsic subtypes and ER, PR, HER2 or Ki‐67.