

Abstract
Chronic lymphocytic leukemia (CLL) is the most common leukemia in the western world. Alterations in microRNAs (miRNAs) expression have been proposed to play a role in CLL pathogenesis. Dicer and Drosha are the main regulators of miRNA biogenesis, and deregulation of their expression has been indicated as a possible cause of miRNA alterations observed in various cancers. To investigate the role of Dicer and Drosha in CLL, we assessed the expression of Dicer and Drosha and their correlation with other prognostic factors, including Binet stages, immunoglobulin heavy chain variable gene (IGHV) mutation status, TP53 mutation status, ZAP‐70 protein and CD38 expression level in 165 CLL patients by using real‐time polymerase chain reaction methods. Patients with unmutated IGHV genes had significantly lower expression of Dicer than patients with IGHV mutations. The lower expression level of Dicer was also significantly associated with higher level of CD38 and ZAP‐70, and more aggressive Binet stage. We also analyzed Dicer expression in different cytogenetic subgroups. Lower Dicer level was found in patients with unfavorable cytogenetic aberrations (deletion in 17p13 or 11q22.3) in contrast to higher level in good risk cytogenetics (deletion in 13q14 as the sole abnormality). Furthermore, the lower expression of Dicer in CLL shows a strong association with shorter overall survival (OS) (P = 0.0046) as well as with reduced treatment free survival (TFS) (P = 0.0006). By contrast, no differences in the expression of Drosha among these groups of patients were observed. Our data suggest that Dicer expression may play an important role in the progression and prognosis of CLL. (Cancer Sci 2012; 103: 875–881)
Chronic lymphocytic leukemia (CLL) is the most common form of adult leukemia in the Western world. It was estimated that about 15 000 people would be diagnosed with CLL every year in the USA, most of them being older adults. Deregulation of various molecules and signaling pathways have been implicated in the pathogenesis of CLL; however, its exact pathogenesis has not been completely elucidated. Discovery of microRNAs (miRNAs) has brought a new insight into the pathogenesis of many diseases including CLL. MiRNAs are small non‐coding RNAs that regulate gene expression at the post‐transcriptional level and are involved in critical biological processes. We and other researchers have shown various abnormal expressions of multiple miRNAs in CLL.1, 2, 3 However, the reasons of miRNAs expression alterations observed in CLL have not been elucidated. One possible explanation suggested is deterioration of miRNA biogenesis machinery involving Dicer and Drosha, the master regulators of the RNA interference machinery.
It has been reported that reduced expression of Dicer and Drosha is associated with greater invasiveness and poor survival in ovarian cancer.4 Likewise, a low level of these enzymes has been found in high risk neuroblastoma with poor outcome.5 Decreased Dicer mRNA has also been associated with decreased survival in patients with non‐small‐cell lung cancer, hepatocellular carcinoma and breast carcinoma.6, 7, 8 By contrast, the literature referring to the expression of Dicer and Drosha in some other tumor types is inconsistent. Upregulation of Drosha was reported to be associated with increased cell proliferation and poor prognosis in esophageal cancer.9 Similarly, in cervical cancer, copy number‐driven overexpression of Drosha and changes in miRNA profile seem to be important for cervical cancer progression.10 In prostate cancer, a high level of Dicer expression was associated with metastatic disease.11 This may suggest tissue‐ and tumor‐specific alterations in miRNA biogenesis genes. As far as hematological malignancies are concerned, Dicer expression has only been investigated in acute myeloid leukemia (AML) and multiple myeloma (MM).12, 13 These findings prompted us to investigate whether altered levels of Dicer and Drosha mRNA, components of the RNA‐interference machinery, are associated with clinical outcome in CLL.
Materials and Methods
Patients
The study included 165 previously untreated CLL patients or patients who had not been treated during the prior 6 months, eight monoclonal B‐cell lymphocytosis (MBL) cases, and additionally 10 age‐matched healthy donors as normal controls. All patients provided informed consent and the study was approved by the local ethics committee of the First Affiliated Hospital of Nanjing Medical University (approval no. 2011‐SRFA‐071). The diagnosis and response were based on the criteria recommended by the revised NCI criteria.14 All CLL patients had at least 5 × 10⁹/L B lymphocyte with monoclonal surface immunoglobulin (dim), CD20 (dim), CD5, CD19 and CD23 expressions. CD19‐positive B cell isolation was performed in MBL and control samples. The purity was above 90% in the MBL and healthy donors. The staging of CLL was performed according to the Binet staging system.15 A range of other prognostic markers was analyzed for the majority of patients: immunoglobulin heavy‐chain variable region (IGHV) mutation status, TP53 mutational status, CD38 and ZAP‐70 expression, and cytogenetics by FISH. Overall survival (OS) was measured from date of CLL diagnosis to date of last follow‐up or death. Treatment‐free survival (TFS) was measured from date of CLL diagnosis to date of first‐line treatment.
Detection of molecular cytogenetic aberrations by FISH and analysis of TP53 mutational status
Fluorescence in situ hybridization analysis was performed on the sample for conventional cytogenetic studies from 149 of 165 CLL patients. In order to detect prognostically relevant abnormalities of chromosomal regions, the following fluorescent labeled probes were used in interphase cytogenetic analyses: LSI MYB (6q23), LSI ATM (11q22.3), LSD13S319 (13q14), LSI IGHC/IGHV (14q32), LSI p53 (17p13) and CEP12 (centromere 12) (all probes purchased from Vysis, Downers Grove, IL, USA). FISH was performed as previously described.16 In addition, the status of p53 mutations (exons 2–11) was also detected by direct sequencing as described previously.17 The cut‐off levels for positive values (mean of normal control ± 3SD), determined from samples of eight cytogenetically normal persons, was 7.5% for del(6q23), and 7.7%, 10.3%, 8.9%, 5.2% and 3.0% for del(11q22), del(13q14), 14q32 translocation, del(17p13) and trisomy 12, respectively.
Analysis of IGHV somatic mutational status and detection of CD38 and ZAP‐70 by flow cytometry
Immunoglobulin heavy chain variable gene mutational status was determined by PCR‐based DNA sequencing from RNA extracted from peripheral blood or bone marrow samples, with a cut‐off value of more than 2% germline divergence defined as “mutated”. Flow cytometric analysis of CD38 and ZAP‐70 was performed on fresh peripheral blood or bone marrow samples stained with CD5‐FITC, CD19‐ECD, CD38‐PE (clone HB‐7; BD Biosciences, San Jose, CA, USA) and ZAP‐70‐PE (clone 1F7.2; Caltag, Burlingame, CA, USA). Isotype controls were run with each sample to distinguish positive cells from negative cells. The cut‐off point for CD38‐positive in CLL cells was >30% and ZAP‐70‐positive was >20%, respectively.18
qRT‐PCR analysis for Dicer and Drosha mRNAs expression
Using the Trizol reagent, total RNA was extracted from bone marrow or peripheral blood mononuclear cells. To decrease the risk of nonspecific DNA amplification, total RNA was treated with DNase‐I (Qiagen, Hilden, Germany) and first‐strand cDNA was synthesized using the SuperScript III RT kit (Invitrogen, Carlsbad, CA, USA). To ensure comparability between the qPCR assays, standard curves were obtained by qRT‐PCR amplification of serial dilutions of cDNA templates, conditions were optimized for each primer pair in order to ensure that the amplification was in the exponential range. Quantitative real‐time PCR was performed using a SYBR kit (Applied Biosystems, Foster City, CA, USA) on an Stratagene Mx3000P instrument using the following primers: Dicer forward, 5′‐GTACGACTACCACAAGTACTTC‐3′; Dicer reverse, 5′‐ATAGTACACCTGCCAG ACTGT‐3′; Drosha forward, 5′‐GTGCTGTCCATGCACCAGATT’; Drosha reverse, 5′‐TGCATAACTCAACTGTGCAGG‐3′; β‐actin forward, 5′‐AGCGAGCATCCCC CAAAGTT‐3′; β‐actin reverse, 5′‐GGGCACGAAGGCTC ATCATT‐3′. In a total volume of 20 μL of reaction mixture, 0.5 μg of complementary DNA templates were mixed with 10 μL of SYBR GREEN PCR Master Mix (Applied Biosystems) and each pair of primers at a final concentration of 100 nM. Reactions were run with the following thermal cycling parameters: 95°C for 5 min followed by 35 cycles of 95°C for 5 s (denaturation) and 60°C for 30 s, melting curve program (60–95°C) with a heating rate of 0.1°C/s. Each sample was assayed in triplicate. We also investigated the mRNA expression levels of GAPDH as a second internal control in 60 samples (data not shown). We found a highly significant correlation between GAPDH and β‐actin mRNA expression r = 0.839, P < 0.0001) in the samples studied validating the use of β‐actin as an internal control for mRNA expression analysis.
Statistical analysis
The relative amount of Dicer and Drosha were calculated by the equation 2−ΔCt. Variables examined were Binet stages, IGHV and TP53 mutational status, CD38 expression level, ZAP‐70 protein, and molecular cytogenetic aberrations. The Mann–Whitney U‐test was used to identify statistically significant differences between groups. The variables with statistical significance related to overall survival and time to first therapy were calculated by the Kaplan–Meier method (log‐rank). Multivariate analysis of survival and time to first therapy was performed using the Cox regression method. All statistical analyses were performed using the SPSS program for Windows (version 15.0). An effect was considered statistically significant at P < 0.05.
Results
Characterization of the CLL cohort
The characteristics of 165 Chinese patients with CLL are summarized in Table 1. Fifty‐nine patients were female and 106 were male (male:female ratio, 1.9), and the median age was 65 years (range, 34–86 years). According to the Binet clinical staging system, 89 patients (53.9%) were classified as Binet stage A, 31 (18.8%) Binet stage B, and 45 (27.3%) as Binet stage C. With a median follow‐up of 46 months (range, 2–180 months) from CLL diagnosis in this series, 11 patients died (CLL‐related deaths) during the observation period.
Table 1.
Clinical and biological characteristics of 165 patients with chronic lymphocytic leukemia
| Characteristic | Value |
|---|---|
| Sex | |
| Male | 106 (64.2%) |
| Female | 59 (35.8%) |
| Age | |
| ≥60 years | 97 (58.8%) |
| <60 years | 68 (41.2%) |
| Binet stage | |
| A | 89 (53.9%) |
| B | 31 (18.8%) |
| C | 45 (27.3%) |
| IGHV (n = 158) | |
| Unmutated (≤2% deviation from a germline) | 52 (32.9%) |
| Mutated (>2% deviation from a germline) | 106 (67.1%) |
| ZAP‐70 (n = 162) | |
| >20% | 43 (26.5%) |
| ≤20% | 119 (73.5%) |
| CD38 (n = 162) | |
| >30% | 53 (32.7%) |
| ≤30% | 109 (67.3%) |
| Cytogenetics (n = 149) | |
| Unfavorable aberration (deletion in 17p13 and/or 11q22) | 24 (16.1%) |
| Favorable aberration (deletion in 13q14 as the sole4 abnormality) | 27 (18.1%) |
| Normal karyotype | 37 (24.8%) |
| Treatment | |
| Fludarabine‐based | 75 (45.5%) |
IGHV, immunoglobulin heavy chain variable gene.
Correlations between Dicer and Drosha expression and clinical parameters
Our data verified that the CLL patients were characterized by downexpression of Dicer compared with healthy controls (Fig. 1, mean ± SD, 0.015 ± 0.011 vs 0.020 ± 0.012; P = 0.0055) and MBL cases (Fig. 1, mean ± SD, 0.015 ± 0.011 vs 0.019 ± 0.009; P = 0.0126). Dicer expression level in CD19+ B cells from healthy donors was very similar to MBL (mean ± SD, 0.020 ± 0.012 vs 0.019 ± 0.009). We then analyzed correlations between Dicer and Drosha expression and patients’ clinical characteristics including gender, age, lymphadenopathy, B symptoms, lymphocyte count, Binet stage, lactate dehydrogenase (LDH) and β2‐MG. As shown in Table 2, the Dicer expression was significantly lower at Binet B and C compared with Binet A (mean ± SD, 0.015 ± 0.010 vs 0.018 ± 0.015; P = 0.001). No major differences regarding clinical feature of Dicer expression were found in the cases except for a high versus low β2‐MG expression (mean of 0.013 vs 0.018, respectively) (P = 0.0243). However, no differences in the expression of Drosha among these groups of patients were observed.
Figure 1.

Dicer is differentially expressed between chronic lymphocytic leukemia (CLL) patients, monoclonal B‐cell lymphocytosis (MBL) cases and healthy donors.
Table 2.
Correlation between Dicer expression and clinical features of chronic lymphocytic leukemia (CLL) patients
| Factors | Dicer expression | |
|---|---|---|
| Mean | Mean ± SD | P‐value |
| Gender (n = 165) | ||
| Male | 0.018 ± 0.017 | 0.511 |
| Female | 0.017 ± 0.018 | |
| Age (n = 165) | ||
| <60 years | 0.017 ± 0.011 | 0.637 |
| ≥60 years | 0.018 ± 0.014 | |
| Lymphadenopathy (n = 158) | ||
| Yes | 0.018 ± 0.007 | 0.336 |
| No | 0.016 ± 0.013 | |
| B symptoms (n = 142) | ||
| Yes | 0.016 ± 0.011 | 0.773 |
| No | 0.018 ± 0.013 | |
| Binet stage (n = 165) | ||
| A | 0.018 ± 0.015 | 0.001 |
| B+C | 0.015 ± 0.010 | |
| Lymphocyte count (n = 165) | ||
| <50 × 109/L | 0.017 ± 0.012 | 0.385 |
| ≥50 × 109/L | 0.015 ± 0.009 | |
| LDH (n = 148) | ||
| >250 U/L | 0.016 ± 0.010 | 0.484 |
| ≤250 U/L | 0.018 ± 0.012 | |
| β2‐MG (n = 137) | ||
| >3 mg/L | 0.013 ± 0.009 | 0.0243 |
| ≤3 mg/L | 0.018 ± 0.015 | |
| IGHV (n = 158) | ||
| Unmutated | 0.012 ± 0.006 | <0.0001 |
| Mutated | 0.019 ± 0.013 | |
| ZAP‐70 (n = 162) | ||
| >20% | 0.013 ± 0.010 | 0.008 |
| ≤20% | 0.018 ± 0.013 | |
| CD38 (n = 162) | ||
| >30% | 0.015 ± 0.015 | 0.030 |
| ≤30% | 0.018 ± 0.012 | |
| Cytogenetics (n = 149) | ||
| Deletion in 17p13 or 11q22 | ||
| Negative | 0.018 ± 0.014 | 0.011 |
| Positive | 0.012 ± 0.012 | |
| Sole del (13q14) | ||
| Negative | 0.014 ± 0.010 | 0.001 |
| Positive | 0.023 ± 0.018 | |
IGHV, immunoglobulin heavy chain variable gene; SD, standard deviation.
Correlations between Dicer and Drosha expressions and prognostic factors
Considering that the mutational status of IGHV is the strongest indicator of prognosis in CLL, correlations of Dicer and Drosha expression with the presence or absence of IGHV mutations was calculated. The analysis of IGHV somatic mutational status was performed on samples from 158 of 165 patients. Fifty‐two patients (32.9%) displayed unmutated IGHV genes, whereas 106 (67.1%) had mutated IGHV profile. As for Dicer, we detected a significantly lower Dicer mRNA expression in patients with unmutated IGHV versus mutated IGHV patients (Fig. 2A, mean ± SD, 0.012 ± 0.006 vs 0.019 ± 0.013, P < 0.0001).
Figure 2.
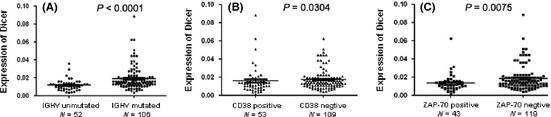
Correlations between Dicer expressions and prognostic factors. P‐values were assessed according to the Mann–Whitney independent t‐test. (A) Decreased expression of Dicer significantly correlated with unmutated immunoglobulin heavy chain variable gene (IGHV) gene mutational status. (B) Dicer expression in CD38‐positive group versus in CD38‐negative group. (C) Dicer expression in ZAP‐70‐positive group versus in ZAP‐70‐negative group.
Furthermore, we used flow cytometry to measure the level of ZAP‐70 and CD38 in CLL cells from 162 patients. Fifty‐six patients (34.6%) were defined as CD38‐positive and 106 patients (65.4%) as CD38‐negative. The noticeable difference of Dicer expression was found between CD38‐positive and CD38‐negative patients, the expression of Dicer was lower in the CD38‐positive group than in CD38‐negative group (Fig. 2B, mean ± SD, 0.015 ± 0.015 vs 0.018 ± 0.012, P = 0.0304). In addition, ZAP‐70 was abundantly expressed in 50 patients (30.9%), while 112 patients (69.1%) were ZAP‐70‐negative. In ZAP‐70‐positive patients, the expression of Dicer was remarkably lower than that in ZAP‐70‐negative ones (Fig. 2C, mean ± SD, 0.013 ± 0.010 vs 0.018 ± 0.013, P = 0.0075).
Among 149 patients, cytogenetic abnormalities were seen in 112 patients (75.2%). Del(13q14) was the most frequent abnormality, found in 63 patients (56.2%), followed by 14q32 translocation in 32 patients (21.5%), trisomy 12 in 28 patients (18.8%), del(17p13) in 19 patients (12.8%), del(11q22) in 12 patients (8.1%), and del(6q23) in 11 patients (7.4%), respectively. Del(13q14) as the sole aberration was seen in 27 patients (18.1%), which was associated with a favorable prognosis and a higher expression of Dicer genes compared with patients of other cytogenetic aberrations (Fig. 3A, mean ± SD, 0.023 ± 0.018 vs 0.014 ± 0.010, P = 0.0009).
Figure 3.

Correlations between Dicer expressions and cytogenetic abnormalities. (A) Dicer expression was extremely upregulated in the patients with del(13q14) as the sole cytogenetic aberration. (B) Decreased expression of Dicer in patients with “p53 attenuated” compared with patients with “p53 wild‐type”.
It was shown that monoallelic TP53 inactivation is associated with poor prognosis, and survival was equally poor for patients with del(17p13), del(11q22.3), or TP53 mutation. Then we defined a “p53 attenuated” group including patients with del(17p13), del(11q22.3) or TP53 mutations, and attempted to explore if there is any correlation between Dicer expression and p53 status. By combining the results of FISH and TP53 mutations analyses in cases for which both data were available, our data showed high expression of Dicer from samples within the wild‐type p53 cohort while those CLL cells from patients bearing “p53 attenuated” showed low Dicer expression (Fig. 3B, mean ± SD, 0.018 ± 0.014 vs 0.012 ± 0.012, P = 0.011).
Since Dicer is mapped to chromosome 14q32.13, one interesting question is whether low expression of Dicer is associated with translocation of chromosome 14q32. To exclude the effect of other cytogenetic abnormality such as del(11q22.3)/del(17p13), we compared Dicer expression in nine patients having 14q32 translocation as the sole genetic abnormality with 37 patients of normal karyotype. No differences were detected between the two cohorts.
We further analyzed associations between expression levels of Dicer and Drosha, and strong correlation was observed (R = 0.346, P < 0.0001). No relevant differences were found in Drosha expression between these entities.
Dicer expression predicts OS and TFS in CLL
Using mean relative expression level as a cutting value, we further analyzed the association between OS and TFS of CLL patients with Dicer expression. The cutoff determination was based on receiver operator characteristic curve analysis optimizing concordance with the IGHV mutational status with samples having a 2−ΔCt value < 0.012 considered for low expression of Dicer (AUC = 0.7241, P < 0.0001; Fig. 4). At the time of enrollment, 136 patients were previously untreated CLL, but during follow‐up, 46 patients received fludarabine‐based treatment because of disease progression according to IWCLL criteria.14 Patients of lower Dicer levels had a significantly reduced TFS (median, 24 months) compared with a median TFS of 110 months in patients of higher Dicer levels (P = 0.0006; Fig. 5A). With a median follow‐up of 46 months (range, 2–180 months) in this series, 11 patients (8.3%) died (CLL‐related deaths). Thus, as shown in Figure 5B, downexpression of Dicer was significantly associated with reduced OS (132 months vs not reached, P = 0.0046).
Figure 4.
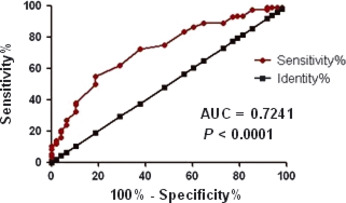
The cutoff of Dicer expression are determined using receiver operator characteristic curve curve analysis maximizing the concordance with the immunoglobulin heavy chain variable gene (IGHV) status.
Figure 5.
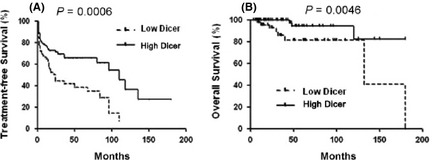
Kaplan–Meier estimates of treatment free survival (TFS) and overall survival (OS) for chronic lymphocytic leukemia (CLL) patients are shown according to the expression levels of Dicer. P‐values were obtained using the log‐rank test.
Using univariate Cox regression analysis, Binet stage, β2‐MG, p53 status, IGHV mutational status and Dicer expression were found to be significant variables in predicting OS (Table 3). CD38 and ZAP‐70 did not produce significant results and were excluded in subsequent analyses. In multivariate Cox regression analysis, only Binet stage and p53 status retained their independent prognostic importance (Table 3). In addition, univariate analysis showed that the variables associated with a short time to first therapy were: Binet stage, β2‐MG, IGHV mutational status, CD38 and Dicer expression. In the multivariate analysis, the variables selected as independently related to time to first therapy were the Binet stage (P = 0.013) and a high CD38 level (P = 0.030) (Table 3). Notably, patients with low Dicer expression showed a borderline significant increase in HR for TFS (HR = 1.65; 95% CI, 0.96–2.43; P = 0.073).
Table 3.
Overall survival and treatment free survival results in 165 chronic lymphocytic leukemia (CLL) patients
| Variable | Univariate analysis | Multivariate analysis | |||
|---|---|---|---|---|---|
| HR (95% CI) | P‐value | HR (95% CI) | P‐value | ||
| OS | |||||
| Binet stage | B + C vs A | 4.65 (2.38–7.65) | 0.001 | 2.23 (1.14–4.34) | 0.029 |
| β2‐MG | >4 mg/L vs <4 mg/L | 2.81 (1.06–4.98) | 0.027 | 1.98 (0.76–1.28) | 0.281 |
| p53 status | p53 attenuated vs p53 wildtype | 6.38 (2.17–26.33) | <0.001 | 3.88 (1.78–6.54) | 0.018 |
| IGHV status | Unmutated vs Mutated | 7.32 (2.66–18.44) | 0.002 | 1.55 (0.86–2.12) | 0.198 |
| CD38 | >30% vs ≤ 30% | 1.28 (0.84–3.77) | 0.146 | N/A | N/A |
| ZAP70 | >20% vs ≤ 20% | 1.32 (0.76–2.32) | 0.486 | N/A | N/A |
| Dicer expression | Low vs high | 6.22 (1.75–21.94) | 0.005 | 1.30 (0.73–2.24) | 0.420 |
| TFS | |||||
| Binet stage | B + C vs A | 3.89 (2.67–8.14) | 0.001 | 3.77 (1.07–4.13) | 0.013 |
| β2‐MG | >4 vs ≤4 mg/L | 2.25 (0.96–5.30) | 0.038 | 1.23 (0.56–2.07) | 0.38 |
| p53 status | p53 attenuated vs p53 wildtype | 1.89 (1.11–4.23) | 0.137 | N/A | N/A |
| IGHV status | Unmutated vs mutated | 2.03 (0.78–6.14) | 0.008 | 1.78 (0.88–2.65) | 0.067 |
| CD38 | >30% vs ≤ 30% | 1.81 (0.80–3.38) | 0.012 | 1.92 (0.74–3.14) | 0.030 |
| ZAP70 | >20% vs ≤ 20% | 1.13 | 0.334 | N/A | N/A |
| Dicer expression | Low vs high | 2.32 (1.44–3.76) | 0.001 | 1.65 (0.96–2.43) | 0.073 |
CD38 and ZAP70 have not been included in multivariate analysis of overall survival (OS). p53 status and ZAP70 have not been included in multivariate analyses of treatment free survival (TFS). These are indicated as N/A (not available). P‐values less than 0.05 were considered significant and are in bold. CI, confidence interval; HR, hazard ratio; IGHV, immunoglobulin heavy chain variable gene.
Discussion
Drosha and Dicer are two major components of miRNA biogenesis machinery. In the nucleus, long endogenous double‐stranded RNA segments (pri‐miRNA) are cut into short hairpin‐shaped double‐stranded RNA precursors (pre‐miRNA) by the RNAase III enzyme Drosha. After being transported to cytoplasm by exportin 5, pre‐miRNA is further processed by another RNase III endonuclease, Dicer, to generate the ∼22‐nt mature miRNA. The production of mature endogenous interfering RNA involves a cascade of events that are inextricably linked to the functions of Dicer and Drosha. For example, Lee et al.19 demonstrated that in cells with silenced Dicer or Drosha expression, precursor and mature miRNA sequences were reduced. Bernstein et al.20 reported that loss of Dicer in mice disrupts embryonic stem‐cell differentiation and is lethal during early development. Low levels of Dicer mRNA also affect normal cellular development and immune responses in preclinical models.21, 22
In this study, we determined the expression of Dicer and Drosha in primary CLL samples. Our finding of downregulation of Dicer in CLL is consistent with several recent reports showing that the expression of Dicer is markedly reduced in a variety of human tumors, including breast cancer, ovarian cancer, prostate cancer, neuroblastoma, etc. Dicer expression level in CD19+ B cells from healthy donors was very similar to MBL. These findings are concordant with those described in MM, which showed upregulation of Dicer in monoclonal gammopathies and reduced expression in the symptomatic myeloma,12 as well as in neuroblastoma, with low Dicer mRNA levels in advanced disease.5 Our current observations showed that Dicer was significantly downregulated in cohort of IGHV unmutational status, CD38‐positive, and ZAP‐70‐positive CLL. Importantly, we found a strong correlation of Dicer expression and poor OS as well as TFS.
Considering that the p53 status is the strongest indicator of prognosis in CLL, correlations of Dicer expression with the presence or absence of p53 abnormal were calculated. By combining the results of FISH and TP53 mutations analyses in cases for which both data were available, lower Dicer level was found in patients with “p53 attenuated” (including patients with del[17p13], del[11q22.3] or TP53 mutations) in contrast to higher level in good risk cytogenetics (deletion in 13q as the sole abnormality), fitting with the hierarchical model of genomic aberrations. Thus, expression of Dicer seemed to be another significant prognostic factor for CLL.
However, the literature referring to the expression of Dicer and Drosha in other tumor types is inconsistent. Increased expression of Dicer mRNA and protein was found in prostate and esophageal carcinomas as well as in precursor lesions of lung adenocarcinoma. So far, the cause for these controversial results between cancers of different origin and for the increased aggressiveness of lower Dicer‐expressing tumor cells in CLL is not clear. As reported, Dicer appears to play a tumor suppressor role. This is evident from the following studies: (i) Deletion of Dicer enhanced tumor development in a K‐Ras‐induced mouse model of lung cancer.23 (ii) Knockdown of Dicer or Drosha can promote neuroblastoma cell proliferation and transformation.5 (iii) Hepatocytes specific knockout of Dicer in mice promotes hepatocellular carcinoma after 1 year.24 In addition, aggressive tumors are also thought to have decreased total miRNA levels, contributing to their poor differentiation, suggesting a decreased rather than an increased expression of Dicer in aggressive cancers.23
Until now, the mechanism that regulates expression of Dicer and Drosha remains unclear. One possible hypothesis might be connected with the Dicer gene location at the subtelomeric region on the chromosome 14 (14q32.13), which was found to be affected by allelic deletion in various tumors including endometrial cancer, lung cancer, primary neuroblastoma, acute lymphoblastic leukemia (ALL), chronic myelogenous leukemia (CML) and lymphoma.25, 26, 27, 28, 29, 30 It is not clear whether the deletion encompassed the Dicer gene in the abovementioned reports and whether the locus of Dicer at 14q32.13 is aberrant in our samples set. Although the most relevant genetic abnormalities (IGH translocations) were also evaluated in our study, we did not detect significant correlation between the genetic features and Dicer status in our samples. Furthermore, genomic mutations in the gene for Dicer and Drosha might be another reason for altered expression. Dicer and Drosha gene mutations have been found in ovarian cancer and in familial multinodular goiter.4, 31 However, in their study, these mutations were not associated with alterations in levels of mRNA of Dicer or Drosha.
Biocomputational analysis performed by Pampalakis et al.32 indicated DNA methylation as a possible mechanism of Dicer downregulation based on the presence of the strong CpG island spanning the first exon of the gene. Although methylation of Dicer gene was not detected in CLL, this possibility warrants further investigation. On the other hand, Dicer itself is a target of miRNA‐mediated regulation. Our search performed with Diana software and TargetScan revealed that a number of miRNAs previously reported to be deregulated in CLL targeted Dicer mRNA. As an example, miR‐16 inhibits the expression of Dicer, representing a negative feed‐back‐loop on overall miRNA production.33 We and others have evidence that the patients bearing a hemizygous deletion of 13q14 regions had a significant miR‐15a and miR‐16‐1 downregulation.3 Thus, the deficiency of expression of miR‐15a and miR‐16‐1 may contribute to overexpression of Dicer in a cohort of del(13q14) in CLL. Additionally, Boren et al.34 reported a significant upregulation of miR‐103, miR‐107, and let‐7c, which are strongly associated with 3′UTR region of Dicer mRNA. As suggested above, the possibility of genetic abnormalities at Dicer and Drosha loci and the existence of other mechanisms such as post‐translational and epigenetic regulations of Dicer and Drosha in CLL await further investigation.
p53 alterations have been mostly connected to the CLL. Mutations in p53 gene were reported in approximately 10% of CLL patients and were recently proposed as prognostic factors. Recent studies suggested the involvement of p53, p63, and p73 in regulation of miRNA processing components including Dicer and Drosha.35 In our study, significant lower Dicer level was found in CLL patients with “p53 attenuated”, whereas high expression of Dicer from samples within the wild‐type p53 cohort. Since that Dicer promoter contains several p53‐REs,35 we hypothesized that Dicer could be a transcriptional target of p53 and p53's ability to regulate Dicer expression could be part of its intrinsic tumor suppressor mechanism.
In conclusion, we have been able to demonstrate for the first time that Dicer expression levels are reduced in a significant proportion of CLL and are associated with specific clinical and biological characteristics of CLL, most notably low Dicer expression being associated with reduced overall survival and treatment‐free survival. Our study adds new data to the variable expression patterns of Dicer in different tumor types. Due to these partly conflicting results among different tumor types, further studies are warranted to clarify the role of the miRNA machinery in carcinogenesis.
Disclosure Statement
The authors have no conflict of interest.
Acknowledgments
This study was supported by the National Natural Science Foundation of China (81100352, 30871104, 30971295, 30971296, 81000216), Natural Science Foundation of Jiangsu Province (BK2010584), “Qing Lan” project of Jiangsu Province, “Liu Da Ren Cai Gao Feng” of Jiangsu Province, University Doctoral Foundation of the Ministry of Education of China (20093234110010), the Program for Development of Innovative Research Team in the First Affiliated Hospital of NJMU, and Project Funded by the Priority Academic Program Development of Jiangsu Higher Education Institutions.
References
- 1. Calin GA, Croce CM. Chronic lymphocytic leukemia: interplay between noncoding RNAs and protein‐coding genes. Blood 2009; 114: 4761–70. [DOI] [PMC free article] [PubMed] [Google Scholar]
- 2. Marton S, Garcia MR, Robello C et al Small RNAs analysis in CLL reveals a deregulation of miRNA expression and novel miRNA candidates of putative relevance in CLL pathogenesis. Leukemia 2008; 22: 330–8. [DOI] [PubMed] [Google Scholar]
- 3. Zhu DX, Miao KR, Fang C et al Aberrant microRNA expression in Chinese patients with chronic lymphocytic leukemia. Leuk Res 2010; 35: 730–4. [DOI] [PubMed] [Google Scholar]
- 4. Merritt WM, Lin YG, Han LY et al Dicer, Drosha, and outcomes in patients with ovarian cancer. N Engl J Med 2008; 359: 2641–50. [DOI] [PMC free article] [PubMed] [Google Scholar]
- 5. Lin RJ, Lin YC, Chen J et al MicroRNA signature and expression of Dicer and Drosha can predict prognosis and delineate risk groups in neuroblastoma. Cancer Res 2010; 70: 7841–50. [DOI] [PMC free article] [PubMed] [Google Scholar]
- 6. Karube Y, Tanaka H, Osada H et al Reduced expression of Dicer associated with poor prognosis in lung cancer patients. Cancer Sci 2005; 96: 111–5. [DOI] [PMC free article] [PubMed] [Google Scholar]
- 7. Wu JF, Shen W, Liu NZ et al Down‐regulation of Dicer in hepatocellular carcinoma. Med Oncol 2011; 28: 804–9. [DOI] [PubMed] [Google Scholar]
- 8. Dedes KJ, Natrajan R, Lambros MB et al Down‐regulation of the miRNA master regulators Drosha and Dicer is associated with specific subgroups of breast cancer. Eur J Cancer 2011; 47: 138–50. [DOI] [PubMed] [Google Scholar]
- 9. Sugito N, Ishiguro H, Kuwabara Y et al RNASEN regulates cell proliferation and affects survival in esophageal cancer patients. Clin Cancer Res 2006; 12: 7322–8. [DOI] [PubMed] [Google Scholar]
- 10. Muralidhar B, Goldstein LD, Ng G et al Global microRNA profiles in cervical squamous cell carcinoma depend on Drosha expression levels. J Pathol 2007; 212: 368–77. [DOI] [PubMed] [Google Scholar]
- 11. Chiosea S, Jelezcova E, Chandran U et al Up‐regulation of dicer, a component of the MicroRNA machinery, in prostate adenocarcinoma. Am J Pathol 2006; 169: 1812–20. [DOI] [PMC free article] [PubMed] [Google Scholar]
- 12. Sarasquete ME, Gutiérrez NC, Misiewicz‐Krzeminska I et al Up‐regulation of Dicer is more frequent in monoclonal gammopathies of undetermined significance than in multiple myeloma patients and is associated with longer survival in symptomatic myeloma patients. Haematologica 2011; 96: 468–71. [DOI] [PMC free article] [PubMed] [Google Scholar]
- 13. Martin MG, Payton JE, Link DC. Dicer and outcomes in patients with acute myeloid leukemia (AML). Leuk Res 2009; 33: e127. [DOI] [PubMed] [Google Scholar]
- 14. Hallek M, Cheson BD, Catovsky D et al Guidelines for the diagnosis and treatment of chronic lymphocytic leukemia: a report from the International Workshop on Chronic Lymphocytic Leukemia updating the National Cancer Institute‐Working Group 1996 guidelines. Blood 2008; 111: 5446–56. [DOI] [PMC free article] [PubMed] [Google Scholar]
- 15. Binet JL, Auquier A, Dighiero G et al A new prognostic classification of chronic lymphocytic leukemia derived from a multivariate survival analysis. Cancer 1981; 48: 198–206. [DOI] [PubMed] [Google Scholar]
- 16. Xu W, Li JY, Wu YJ et al Prognostic significance of ATM and TP53 deletions in Chinese patients with chronic lymphocytic leukemia. Leuk Res 2008; 32: 1071–7. [DOI] [PubMed] [Google Scholar]
- 17. Dong HJ, Zhou LT, Zhu DX et al The prognostic significance of TP53 mutations in Chinese patients with chronic lymphocytic leukemia is independent of del(17p13). Ann Hematol 2011; 90: 709–17. [DOI] [PubMed] [Google Scholar]
- 18. Xu W, Li JY, Wu YJ et al CD38 as a prognostic factor in Chinese patients with chronic lymphocytic leukaemia. Leuk Res 2009; 33: 237–43. [DOI] [PubMed] [Google Scholar]
- 19. Lee Y, Ahn C, Han J et al The nuclear RNase III Drosha initiates microRNA processing. Nature 2003; 425: 415–9. [DOI] [PubMed] [Google Scholar]
- 20. Bernstein E, Kim SY, Carmell MA et al Dicer is essential for mouse development. Nat Genet 2003; 35: 215–7. [DOI] [PubMed] [Google Scholar]
- 21. Kobayashi T, Lu J, Cobb BS et al Dicer‐dependent pathways regulate chondrocyte proliferation and differentiation. Proc Natl Acad Sci U S A 2008; 105: 1949–54. [DOI] [PMC free article] [PubMed] [Google Scholar]
- 22. Cobb BS, Hertweck A, Smith J et al A role for Dicer in immune regulation. J Exp Med 2006; 203: 2519–27. [DOI] [PMC free article] [PubMed] [Google Scholar]
- 23. Kumar MS, Lu J, Mercer KL, Golub TR, Jacks T. Impaired microRNA processing enhances cellular transformation and tumorigenesis. Nat Genet 2007; 39: 673–7. [DOI] [PubMed] [Google Scholar]
- 24. Sekine S, Ogawa R, Ito R et al Disruption of Dicer1 induces dysregulated fetal gene expression and promote hepatocarcinogenesis. Gastroenterology 2009; 136: 2304–15. [DOI] [PMC free article] [PubMed] [Google Scholar]
- 25. Chiosea S, Jelezcova E, Chandran U et al Overexpression of Dicer in precursor lesions of lung adenocarcinoma. Cancer Res 2007; 67: 2345–50. [DOI] [PubMed] [Google Scholar]
- 26. Fujino T, Risinger JI, Collins NK et al Allelotype of endometrial carcinoma. Cancer Res 1994; 54: 4294–8. [PubMed] [Google Scholar]
- 27. Sercan HO, Sercan ZY, Kizildag S, Undar B, Soydan S, Sakizli M. Consistent loss of heterozygosity at 14q32 in lymphoid blast crisis of chronic myeloid leukemia. Leuk Lymphoma 2000; 39: 385–90. [DOI] [PubMed] [Google Scholar]
- 28. Agueli C, Cammarata G, Salemi D et al 14q32/miRNA clusters loss of heterozygosity in acute lymphoblastic leukemia is associated with up‐regulation of BCL11a. Am J Hematol 2010; 85: 575–8. [DOI] [PubMed] [Google Scholar]
- 29. Suzuki T, Yokota J, Mugishima H et al Frequent loss of heterozygosity on chromosome 14q in neuroblastoma. Cancer Res 1989; 49: 1095–8. [PubMed] [Google Scholar]
- 30. Mengle‐Gaw L, Albertson DG, Sherrington PD, Rabbitts TH. Analysis of a T‐cell tumor‐specific breakpoint cluster at human chromosome 14q32. Proc Natl Acad Sci U S A 1988; 85: 9171–5. [DOI] [PMC free article] [PubMed] [Google Scholar]
- 31. Rio Frio T, Bahubeshi A, Kanellopoulou C et al DICER1 mutations in familial multinodular goiter with and without ovarian Sertoli‐Leydig cell tumors. JAMA 2011; 305: 68–77. [DOI] [PMC free article] [PubMed] [Google Scholar]
- 32. Pampalakis G, Diamandis EP, Katsaros D, Sotiropoulou G. Down‐regulation of dicer expression in ovarian cancer tissues. Clin Biochem 2010; 43: 324–7. [DOI] [PubMed] [Google Scholar]
- 33. Zhang X, Zeng Y. The terminal loop region controls microRNA processing by Drosha and Dicer. Nucleic Acids Res 2010; 38: 7689–97. [DOI] [PMC free article] [PubMed] [Google Scholar]
- 34. Myatt SS, Wang J, Monteiro LJ et al Definition of microRNAs that repress expression of the tumor suppressor gene FOXO1 in endometrial cancer. Cancer Res 2010; 70: 367–77. [DOI] [PMC free article] [PubMed] [Google Scholar]
- 35. Boominathan L. The tumor suppressors p53, p63, and p73 are regulators of microRNA processing complex. PLoS ONE 2010; 5: e10615. [DOI] [PMC free article] [PubMed] [Google Scholar]