

Abstract
Extracellular high mobility group box‐1 (HMGB1) contributes to tumor growth and invasiveness. We evaluated the diagnostic and prognostic ability of serum HMGB1 for pancreatic ductal adenocarcinoma (PDAC). Serum HMGB1 measured by enzyme‐linked immunosorbent assay (ELISA) were compared among normal, chronic pancreatitis, PDAC group in both training (n = 25, each group) and independent validation set (n = 45, each group). To determine the usability of serum HMGB1 as a diagnostic predictor of PDAC, receiver operating characteristic (ROC) curves with sensitivity/specificity and logistic regression were evaluated. To assess the HMGB1‐associated prognosis of PDAC, Kaplan–Meier survival and Cox proportional‐hazards regression were applied. Serum HMGB1 was correlated with presence and advanced‐stage of PDAC. Logistic regression exhibited serum HMGB1 was a remarkable biomarker to predict PDAC as a single or multiple‐markers; sensitivity/specificity of serum HMGB1 were superior to carbohydrate antigen (CA) 19‐9 or carcinoembryonic antigen (CEA) in both training and independent datasets. Kaplan–Meier survival analysis showed PDAC patients with high serum HMGB1 levels (>30 ng/mL; median survival, 192 days) had a worse prognosis than patients with low HMGB1 levels (≤30 ng/mL; 514 days) by log‐rank (P = 0.017). Cox proportional‐hazards model showed the relative hazard ratios in high‐serum HMGB1 group was 3.077 compared with the low‐serum HMGB1 group. In conclusion, serum HMGB1 is a desirable diagnostic and prognostic biomarker for PDAC compared with pre‐existing PDAC biomarkers, CA19‐9 and CEA.
Pancreatic ductal adenocarcinoma (PDAC) is one of the most difficult malignancies to diagnose and treat. While only resectable early‐stage PDAC has a chance of cure, more than 80% of PDAC are diagnosed at the unresectable stage.1 Thus, investigation of easily accessible useful biomarker for screening PDAC at early curative stage such as a serum biomarker would have great clinical value.
Currently, the most widely used biomarker of PDAC is carbohydrate antigen (CA) 19‐9. However, inadequate sensitivity and specificity limit the use of CA19‐9 as an early diagnostic marker for PDAC.2 Serum CA19‐9 is frequently normal in early‐stage PDAC, whereas it can also be elevated in benign conditions or in other cancers.2, 3, 4 Carcinoembryonic antigen (CEA), another tumor marker for PDAC,5 also exhibits inadequate sensitivity and specificity.6
High mobility group box‐1 (HMGB1), originally known as a nuclear protein, mediates many important pathological settings such as inflammation, cell migration, and tissue regeneration as a cytokine‐like extracellular form.7, 8, 9, 10 Recently, various studies have demonstrated cancer can exploit extracellular HMGB1 for their progression in conjunction with its specific membrane receptors.11, 12, 13, 14 Actually, previous studies have reported the correlation between overexpressed serum HMGB1 and advanced stage of cancer in many types of cancers.15, 16, 17
Although the exact mechanism was not fully evaluated, HMGB1 may be involved in the development and evolution of malignant processes through its ability to promote cell migration, modulate the adhesive properties, and stimulate tumor neoangiogenesis.11, 12, 13, 14, 18 Overexpressed HMGB1 in cancer cells19, 20, 21 may be released into extracellular microenvironment at higher levels than that of non‐cancer conditions in proportion to tumor growth and following necrosis, which may promote the malignant progression through promoting cell migration and neoangiogenesis. In addition, constant release of HMGB1 into the extracellular environment would create a microenvironment similar to chronic inflammation composed of repetitive destruction and remodeling, which is a predisposing condition of cancer development.22
In PDAC, a representative inflammation‐associated epithelial malignancy, serum HMGB1 may also play important roles in the development and evolution of malignant processes. However, until now, there has been no study to demonstrate the implication of serum HMGB1 in PDAC clinically, although several in vitro studies have suggested its potential roles in PDAC indirectly.21, 23
In order to evaluate the clinical implication of serum HMGB1 along the carcinogenic process and validate its diagnostic or prognostic usefulness in PDAC, we conducted a prospective case‐control study using human serum samples obtained from healthy controls, patients with chronic pancreatitis (CP, high‐risk) and patients with PDAC in comparison with CA19‐9 and CEA, pre‐existing PDAC biomarkers.
Materials and Methods
Subjects and sample collection
A total of 210 subjects consisted of 75 subjects for initial biomarker identification (training dataset, each n = 25) and following 135 independent validation datasets (each n = 45) were consecutively enrolled from the Yonsei University Health System between January 2006 and May 2011. Effect sample size of training dataset was estimated by Russ Lenth's interactive power/sample size online calculator because there was no information about the means of each group. Under the assumption that the number of comparison groups was three, the guesstimate of standard deviation (SD) was 0.5 among groups and 1 within groups, respectively, and the confidence level was 0.05. A sample size of 25 in each group achieved an 88% of statistic power (F‐test). For validation dataset, the NCSS PASS program24 was used under the assumption that the means are one, 15 and 39 in normal, CP and PDAC, respectively, and common SD is 50.3 within a group, all of which were estimated in training dataset. A sample size of 45 in each group achieved 90% statistic power to detect the differences of the means among groups using an F‐test with a 0.05 significance level. Clinicopathological features of subjects in the training and independent validation datasets are given in Table 1.
Table 1.
Clinicopathological features of subjects according to disease groups in the training and independent validation dataset
| Clinicopathological features | Disease groups (n) | ||
|---|---|---|---|
| Normal (25) | CP (25) | PDAC (25) | |
| (Initial training dataset) | |||
| Age (mean ± SD; years) | 54.2 ± 10.4 | 55.7 ± 9.5 | 58.2 ± 9.7 |
| Sex (male versus female; n) | 15:10 | 15:10 | 15:10 |
| Mass‐forming CP (n) | NS | 9 | NS |
| T‐stage (T1:T2:T3:T4; n) | NS | NS | 2:6:8:9 |
| Node metastasis (N0 vs N1; n) | NS | NS | 10:15 |
| Distant metastasis (M0 vs M1; n) | NS | NS | 16:9 |
| Overall stage (I, II, III, IV; n) | NS | NS | 5:5:6:9 |
| Size (≤2 cm:>2 cm & ≤5 cm:>5 cm; n) | NS | NS | 2:17:6 |
| Resectable:Unresectable (n)a | NS | NS | 8:17 |
| Early‐PDAC:non‐ Early‐PDAC (n)b | NS | NS | 2:23 |
| Disease groups (n) | |||
|---|---|---|---|
| Normal (45) | CP (45) | PDAC (45) | |
| (Initial training dataset) | |||
| Age (mean ± SD; years) | 55.1 ± 9.4 | 54.7 ± 8.3 | 57.2 ± 10.5 |
| Sex (male versus female; n) | 28:17 | 27:18 | 27:18 |
| Mass‐forming CP (n) | NS | 12 | NS |
| Depth of invasion (T1:T2:T3: T4; n) | NS | NS | 3:9:15:18 |
| Node metastasis (N0 vs N1; n) | NS | NS | 15:30 |
| Distant metastasis (M0 vs M1; n) | NS | NS | 24:21 |
| Overall stage (I, II, III, IV; n) | NS | NS | 6:8:10:21 |
| Size (≤2 cm:>2 cm & ≤5 cm:>5 cm; n) | NS | NS | 4:27:14 |
| Resectable:Unresectable (n) | NS | NS | 14:31 |
| Early PDAC:non‐Early PDAC (n) | NS | NS | 3:42 |
| Conservative Tx:OP:CCRT: CTx (n) | NS | NS | 6:11:10:18 |
| Tx Responders: Non‐responders (n)c | NS | NS | 14:31 |
P < 0.05 (two‐tailed) is considered to be statistically significant.
A tumor is defined as resectable when the tumor does not invade the celiac axis or the superior mesenteric artery (T1–3, N0–1, M0, stage I–II) without distant metastasis.
A tumor is defined as early PDAC when it is limited to the pancreas without any invasion or with minimal invasion to the stroma and tumor size is ≤2 cm (T1, N0, M0, stage IA).
Complete remission (CR), and partial remission (PR) groups are classified as treatment responders whereas stable disease (SD) and progression disease (PD) groups are classified as non‐responders. Treatment response was evaluated 6 months after the first treatment including whole treatment methods regardless of individual treatment modalities. CCRT, Concurrent chemoradiotherapy; CP, chronic pancreatitis; CTx, single chemotherapy; NS, not studied; OP, operation; PDAC, pancreatic ductal adenocarcinoma; SD, standard deviation; Tx, treatment.
Recruitment was based on the reference standard of each target disease (normal, CP, PDAC) through following diagnostic tests; history taking, physical examination, chemistry tests including total bilirubin (TBIL) and alkaline phosphatase (ALP), and radiological studies including abdominal ultrasonography or computed tomography. For confirmation of CP and PDAC, histopathological diagnosis through biopsy or surgical specimen was followed. TNM stage for PDAC was determined preoperatively based on radiologic examination according to the American Joint Committee on Cancer (AJCC) Cancer Staging Manual (6th edition), and finally corrected after surgery.
Participants with normal laboratory and radiologic findings without any risk of PDAC were enrolled as healthy controls. All cases of CP and PDAC groups were histopathologically proven. All disease groups were frequency‐matched by age and sex. Subjects with acute or chronic inflammatory illness and other types of cancer were excluded in all groups. Patients with other histologic types of pancreatic malignancies and history of previous treatment for PDAC were also excluded.
Blood samples for targeted assays (HMGB1, CA19‐9, CEA) were prospectively collected just before diagnostic tests without any previous information about index values of targeted assays. After sampling and diagnostic testing, each subject received appropriate treatments. Pancreatic ductal adenocarcinoma patients received stage‐based treatment. This research was approved by the Institutional Review Board of Yonsei University Health System for Human projects, and a written informed consent was obtained from all participants.
Measurement of serum HMGB1, CA19‐9, and CEA levels
Approximately 10 mL of whole blood was collected, centrifuged at 1500g for 15 min to obtain serum fraction, and stored at −70°C until analysis. Serum HMGB1 was measured using the commercially‐available HMGB1 enzyme‐linked immunosorbent assay (ELISA) kit II (SHINO‐TEST Corporation, Kanagawa, Japan) according to the manufacturer's instructions. Serum CA 19‐9 and CEA levels were measured using quality‐controlled Vitros‐3600 automatic analyzer (Ortho Clinical Diagnostic, New York, NY, USA) and Beckman Access CEA assay (Beckman Coulter, Chaska, MN, USA), respectively. All assays were performed three times in a blinded fashion to reduce bias at the end day of enrollment period by a PhD of laboratory medicine.
Statistics
For all statistical analyses except sample size estimation, SPSS (Version 15.0; Chicago, IL, USA) was used, and a P‐value <0.05 was considered statistically significant. All tested values were expressed as means and standard deviations. anova test with the multiple comparisons by post‐hoc Bonferroni method was applied to compare the differences of mean among disease groups. For non‐parametric comparisons of two variables, Mann–Whitney U‐test was used. Pearson's correlation (coefficient, γp) was performed to evaluate the relationships among continuous variables, and Spearman's correlation (coefficient, γs) was performed to evaluate the relationships between each marker and non‐continuous variables. Receiver operating characteristic (ROC) curves were plotted to determine the cut‐off point for the best sensitivity/specificity to predict PDAC. The reproducibility of diagnostic potentials of HMGB1for PDAC estimated in training set was confirmed in an independent validation set. To evaluate the diagnostic potential of HMGB1 as multiple‐marker panels in combination with CA19‐9 and/or CEA as well as a single‐marker, logistic regression was performed using validation set. All subjects in validation set were included in analysis. The endpoint was to detect PDAC compared with non‐PDAC. Normal and CP patients were classified as non‐PDAC subjects. Each marker (HMGB1, CA19‐9, CEA) was included as a linear term, and a quadratic term was included if it was statistically significant. Multiple‐marker combinations of serum HMGB1, CA19‐9 and CEA were evaluated from one to three panel sizes.
Overall survival from the date of first diagnosis to the time of last review (30 November 2011) or death was estimated using Kaplan–Meier method, and the comparison between low‐HMGB1 (≤30 ng/mL) and high‐HMGB1 group (>30 ng/mL) referred to the log‐rank test in validation set. We fixed 30 ng/mL as the cut‐off value of serum HMGB1 to classify either low‐ or high‐serum HMGB1 groups in PDAC patients because median value of serum HMGB1 in PDAC patients was 31.7 ng/mL in the current study. Censoring occurred if patients were still alive at last review, with a maximum follow‐up of 45 months. Cox proportional hazards regression models were used to control for the following subject features in validation set: male versus female, serum HMGB1 ≤30 ng/mL vs >30 ng/mL, negative versus positive nodes, negative versus positive metastasis, resectable versus unresectable, and early PDAC versus non‐early PDAC; age (analyzed as a continuous variable); T‐stage (analyzed as four categories, T1–4), tumor size (analyzed as three categories, ≤2 cm, >2 cm–≤5 cm, >5 cm); treatment responder versus non‐responder. Treatment response was evaluated at 6 months after the first treatment including whole treatments regardless of individual treatment modalities. A detailed flow diagram for the validation process throughout this study is presented in Figure 1. Data were analyzed by a gastroenterologist and a MD of laboratory medicine, supported by a statistician who specializes in biomarker study.
Figure 1.

A flow diagram for validation process of serum high mobility group box‐1 as a tumor marker for pancreatic ductal adenocarcinoma throughout the study.
Results
Evaluation of diagnostic potential of serum HMGB1 for PDAC in training set
Serum HMGB1 was significantly higher in the PDAC group (38.7 ± 50.3 ng/mL) compared with CP (15.1 ± 17.4 ng/mL) and the normal group (0.5 ± 2.6 ng/mL) in initial training dataset (anova, P < 0.001, Table 2). It was also higher in the CP group compared with the normal group; however, the difference was not significant between these groups (Post‐hoc Bonferroni, P = 0.295). Moreover, serum HMGB1 was not affected by the existence of pancreatic inflammatory mass in CP; this value in the mass‐forming CP group was not significantly different from that of the non‐mass‐forming CP group (Table 3, P = 0.836), whereas serum CA19‐9 was significantly higher in the mass‐forming CP group compared with that of the non mass‐forming CP group (P = 0.024).
Table 2.
Comparison of serum levels of high mobility group box‐1 (HMGB1), carbohydrate antigen (CA) 19‐9 or carcinoembryonic antigen (CEA) according to disease groups in each initial training and following independent validation dataset
| Biomarkers | Groups of disease (n) | |||
|---|---|---|---|---|
| Normal (n = 25) | CP (n = 25) | PDAC (n = 25) | P‐valueb | |
| (Initial training set) | ||||
| Serum HMGB1 (ng/mL) | 0.5 ± 2.6a | 15.1 ± 17.4 | 38.7 ± 50.3 | <0.001 |
| Serum CA19‐9 (U/mL) | 9.1 ± 10.2 | 131.2 ± 308.8 | 1627.4 ± 3480.3 | 0.009 |
| Serum CEA (ng/mL) | 2.3 ± 1.5 | 3.2 ± 3.3 | 14.3 ± 44.7 | 0.259 |
| Groups of disease (n) | ||||
|---|---|---|---|---|
| Normal (45) | CP (45) | PDAC (45) | P‐valueb | |
| (Following validation set) | ||||
| Serum HMGB1 (ng/mL) | 0.7 ± 3.5a | 22.3 ± 30.1 | 52.3 ± 49.4 | <0.001 |
| Serum CA19‐9 (U/mL) | 14.7 ± 18.5 | 144.4 ± 339.5 | 5136.1 ± 7669.8 | <0.001 |
| Serum CEA (ng/mL) | 2.2 ± 1.2 | 3.4 ± 3.0 | 330.6 ± 1374.1 | 0.146 |
P < 0.05 (two‐tailed) was considered to be statistically significant.
All tested values are expressed as means ± standard deviations.
anova test with the multiple comparisons by post‐hoc Bonferroni method are applied to compare the differences of mean among three disease groups.
CP, chronic pancreatitis; PDAC, pancreatic ductal adenocarcinoma.
Table 3.
Comparison of serum levels of high mobility group box‐1 (HMGB1), carbohydrate antigen (CA) 19‐9 or carcinoembryonic antigen (CEA) between mass‐forming and non‐mass forming chronic pancreatitis (CP) patients in each initial training and following independent validation dataset
| Biomarkers | Groups of disease (n) | ||
|---|---|---|---|
| Non‐mass forming CP (n = 16) | Mass‐forming CP (n = 9) | P‐valueb | |
| (Initial training set) | |||
| Serum HMGB1 (ng/mL) | 14.5 ± 14.9a | 16.1 ± 22.0 | 0.836 |
| Serum CA19‐9 (U/mL) | 87.6 ± 281.0 | 208.7 ± 356.8 | 0.002 |
| Serum CEA (ng/mL) | 2.4 ± 2.0 | 4.4 ± 4.7 | 0.425 |
| Groups of disease (n) | |||
|---|---|---|---|
| Non‐mass forming CP (n = 33) | Mass‐forming CP (n = 12) | P‐valueb | |
| (Following validation set) | |||
| Serum HMGB1 (ng/mL) | 21.4 ± 29.5a | 24.8 ± 32.8 | 0.395 |
| Serum CA19‐9 (U/mL) | 69.7 ± 209.2 | 368.5 ± 533.1 | 0.024 |
| Serum CEA (ng/mL) | 2.5 ± 1.7 | 5.3 ± 4.4 | 0.160 |
P < 0.05 (two‐tailed) was considered to be statistically significant.
All tested values are expressed as means ± standard deviations.
Mann–Whitney U‐test are applied to compare the differences of mean between mass‐forming and non‐mass‐forming CP groups.
CP, chronic pancreatitis; PDAC, pancreatic ductal adenocarcinoma.
The diagnostic ability of serum HMGB1 for PDAC was illustrated by ROC curve in comparison with those of CA19‐9 and CEA. Using the ROC curve, we estimated the optimized sensitivity/specificity of each biomarker to predict PDAC. As shown in Figure 2(a), the diagnostic potential of serum HMGB1 to detect PDAC was superior to CA19‐9 or CEA as a single marker; sensitivity and specificity of serum HMGB1 (72.0% and 82.0%, respectively) was superior compared with those of CA19‐9 (72.0% and 75.6%) and CEA (52.0% and 54.0%). Additionally, logistic regression demonstrated remarkable diagnostic potential of serum HMGB1 as multiple‐markers combined with CA19‐9 and/or CEA in the training dataset (Table 4). Especially, combination of all markers exhibited the best diagnostic potential for PDAC in the training set (87.8% specificity at 80.0% sensitivity, Table 4).
Figure 2.
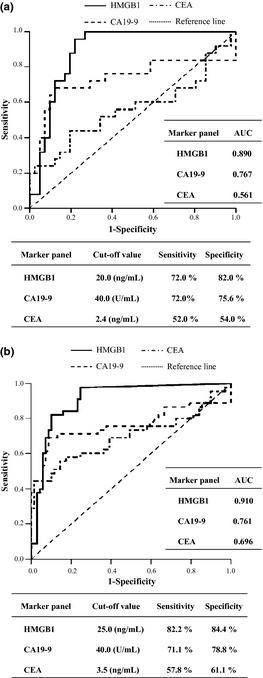
Receiver operator characteristic (ROC) curves and optimized sensitivity/specificity of high mobility group box‐1 (HMGB1), carbohydrate antigen (CA) 19‐9 or carcinoembryonic antigen (CEA) for screening of pancreatic ductal adenocarcinoma (PDAC) in training dataset (a) and in independent validation dataset (b). AUC, area under the receiver operating characteristic (ROC) curve.
Table 4.
Sensitivities and specificities to detect pancreatic ductal adenocarcinoma (PDAC) by the combination of tumor markers (high mobility group box‐1 [HMGB1], carbohydrate antigen [CA] 19‐9 or carcinoembryonic antigen [CEA]) using logistic regression in both training and validation dataset
| Marker panela | Cut‐off pointb | Sensitivity (%) | Specificity (%) |
|---|---|---|---|
| (Initial training set) | |||
| HMGB1 | 0.35 | 80.0 | 80.0 |
| CA19‐9 | 0.26 | 80.0 | 52.0 |
| CEA | 0.30 | 72.0 | 19.5 |
| HMGB1 + CA19‐9 | 0.34 | 80.0 | 84.0 |
| HMGB1 + CEA | 0.42 | 80.0 | 85.4 |
| CA19‐9 + CEA | 0.27 | 76.0 | 82.9 |
| HMGB1 + CA19‐9 + CEA | 0.32 | 80.0 | 87.8 |
| (Following validation set) | |||
| HMGB1 | 0.36 | 80.0 | 86.7 |
| CA19‐9 | 0.21 | 71.1 | 75.6 |
| CEA | 0.25 | 80.0 | 27.5 |
| HMGB1 + CA19‐9 | 0.35 | 82.2 | 89.4 |
| HMGB1 + CEA | 0.35 | 82.2 | 87.0 |
| CA19‐9 + CEA | 0.23 | 82.2 | 66.7 |
| HMGB1 + CA19‐9 + CEA | 0.38 | 82.2 | 89.4 |
Each marker is included as a linear term and evaluated from one to three panel size.
Cut‐off point means the probability cut‐off point to classify subjects as PDAC or non‐PDAC in binary logistic regression.
For comparison among each panel, cut‐off point ensures a target sensitivity of around 80%.
Validation of diagnostic potential of serum HMGB1 for PDAC using independent dataset
To test the reproducibility of the initial findings in the training dataset, we evaluated the diagnostic potential of serum HMGB1 for PDAC in more large‐scaled independent validation datasets. Consistent with the results of the training set, serum HMGB1 was also significantly higher in the PDAC group (52.3 ± 49.4 ng/mL, anova, P < 0.001) compared with the normal group (0.7 ± 3.5 ng/mL) and CP group (22.3 ± 30.1 ng/mL) including mass‐forming CP in the validation dataset (Tables 2 and 3). Receiver operating characteristic curve also exhibited the superior diagnostic potential of serum HMGB1 compared with CA19‐9 or CEA in the PDAC in validation dataset (Fig. 2b). Sensitivity and specificity of serum HMGB1 was 82.2% and 84.4%, respectively, compared with those of CA19‐9 (71.1% and 78.8%) and CEA (57.8% and 61.1%). Logistic regression also demonstrated remarkable diagnostic potential of serum HMGB1 as multiple‐marker panels combined with CA19‐9 and/or CEA. Among various‐sized biomarker combination subpanels, the combination of all markers also exhibited the best diagnostic potential for PDAC in the validation dataset (89.4% specificity at 82.2% sensitivity, Table 4).
Relationships between serum HMGB1 and clinicopathological features of PDAC
Next, we analyzed the relationships between individual biomarkers (HMGB1, CA19‐9, and CEA) and clinicopathological characteristics of PDAC in validation dataset (Table 5 and Fig. 3). Serum HMGB1 was positively correlated with T‐stage (γs = 0.755, P < 0.001), lymph node metastases (γs = 0.485, P = 0.001), distant metastases (γs = 0.394, P = 0.007), overall stage (γs = 0.506, P < 0.001), and tumor size (γs = 0.343, P = 0.023). It was also negatively correlated with resectability (γs = −0.517, P = 0.001) and early PDAC (γs = −0.386, P = 0.010) defined as tumor size ≤2 cm.25 On the other hand, serum CA19‐9 was only correlated with M‐stage (γs = 0.626, P < 0.001), overall stage (γs = 0.517, P < 0.001) and treatment response (γs = 0.377, P = 0.012), and negatively correlated with resectability (γs = −0.383, P = 0.011). Serum CEA was only correlated with M‐stage (γs = 0.401, P = 0.006) and overall stage (γs = 0.365, P = 0.015).
Table 5.
Correlations between individual biomarkers (high mobility group box‐1 [HMGB1], carbohydrate antigen [CA] 19‐9 or carcinoembryonic antigen [CEA]) and clinicopathological features of pancreatic ductal adenocarcinoma (PDAC) patients as the clinical endpoints reflecting the usefulness of biomarker in validation dataset
| HMGB1 γs or γp (P‐value) | CA19‐9 γs or γp (P‐value) | CEA γs or γp (P‐value) | |
|---|---|---|---|
| Sex | 0.150 (0.325) | −0.266 (0.080) | 0.139 (0.379) |
| Age | 0.065 (0.675) | 0.089 (0.275) | 0.122 (0.423) |
| Depth of invasion (T1–T4) | 0.755 (<0.001) | 0.141 (0.360) | 0.015 (0.925) |
| Node metastasis (N0, N1) | 0.485 (0.001) | 0.260 (0.089) | 0.185 (0.229) |
| Distant metastasis (M0, M1) | 0.394 (0.007) | 0.626 (<0.001) | 0.401 (0.006) |
| Overall stage (I, II, III, IV) | 0.506 (<0.001) | 0.517 (<0.001) | 0.365 (0.015) |
| Size (≤2 cm, >2 cm & ≤5 cm, >5 cm) | 0.343 (0.023) | 0.230 (0.133) | 0.227 (0.139) |
| Resectabilitya | −0.517 (0.001) | −0.383 (0.011) | −0.296 (0.051) |
| Early PDACb | −0.386 (0.010) | −0.259 (0.089) | −0.171 (0.266) |
| Treatment responsesc | 0.207 (0.178) | 0.377 (0.012) | 0.278 (0.067) |
A tumor is defined as resectable when the tumor does not invade the celiac axis or the superior mesenteric artery (T1–3, N0–1, M0, stage I–II) without distant metastasis.
A tumor is defined as early PDAC when it is limited to the pancreas without any invasion or with minimal invasion to the stroma and the size is ≤2 cm (T1, N0, M0, stage IA).
Treatment response was evaluated at 6 months after the first treatment including whole treatment methods regardless of individual treatment modalities.
Statistically significant values are given in bold type γs, Spearman's correlation coefficient; γp, Pearson's correlation coefficient.
Figure 3.

Distribution of three tested biomarkers (high mobility group box‐1 [HMGB1], carbohydrate antigen [CA] 19‐9 or carcinoembryonic antigen [CEA]) at each stage of pancreatic ductal adenocarcinoma (PDAC). *P < 0.05.
Diagnostic advantages of serum HMGB1 to overcome the limitations of CA19‐9 in PDAC
Although serum CA19‐9 is the most widely used biomarker for PDAC, it is sometimes difficult to differentiate between cancer and non‐cancer conditions in certain conditions. Thus, we evaluated if serum HMGB1 can overcome these limitations of CA19‐9 in a validation set.
We evaluated the correlations between three tested biomarkers and serum levels of TBIL and ALP reflecting biliary tract obstruction, and observed serum HMGB1 and CEA were not correlated with both serum TBIL and ALP, whereas serum CA19‐9 showed a close correlation with serum ALP and a tendency of correlation with serum TBIL (Table S1). Because serum HMGB1 was not be affected by biliary obstruction unlike CA19‐9, we compared the diagnostic power for PDAC between serum HMGB1 and CA19‐9 when ALP levels were within the normal range (≤250 IU/L) or above the normal range (>250 IU/L), which reflects biliary tract obstruction. When ALP levels were above the normal range, serum HMGB1 was superior to CA19‐9 or CEA to differentiate PDAC from non‐PDAC although it was not when ALP levels were within normal range (Table S2).
Sometimes, serum CA19‐9 is discordant with a real disease entity, which may make the differentiation between cancer and non‐cancer conditions difficult. Therefore, we evaluated if serum HMGB1 can differentiate between cancer and non‐cancer conditions when CA19‐9 was discordant with a disease entity. Logistic regression demonstrated serum HMGB1 exhibited remarkable detection power for PDAC in the low‐CA19‐9 group (<40 U/mL) compared with those of CA19‐9 and CEA as both a single marker and multiple‐marker panels combined with CA19‐9 and CEA (Table S3).
Evaluation of prognostic role of serum HMGB1 in PDAC
All 135 subjects in the validation set were included in the final prognostic analysis of serum HMGB1 without withdrawal. The maximum follow‐up time was 44 months and the median follow‐up time was 14.5 months. Kaplan–Meier survival curves showed the PDAC patients with high‐serum HMGB1 (>30 ng/mL) had a significantly worse prognosis than the patients with low‐serum HMGB1 (≤30 ng/mL, log‐rank, P = 0.017, Fig. 4). The median survival was 192 days (95% CI, 114.3–545.7) in the high‐serum HMGB1 group versus 514 days (95% CI, 140.1–1351.0) in the low‐serum HMGB1 group.
Figure 4.

Kaplan–Meier overall survival curves according to serum high mobility group box‐1 (HMGB1) levels. Patients with high serum HMGB1 (>30 ng/mL) have shorter survival than those with low serum‐HMGB1 (≤30 ng/mL) (Log‐rank, P = 0.017). CI, confidence interval; SD, standard deviation.
Because serum HMGB1 had a significant effect on survival, we conducted the univariate and multivariate analyses for serum HMGB1 using Cox proportional‐hazards regression model to confirm the prognostic role of serum HMGB1 in PDAC. Table 6 shows the univariate and multivariate hazard ratios (HRs) for the covariates of interest, which are considered as prognostic factors for PDAC. Male, high‐serum HMGB1 (>30 ng/mL), presence of distant metastasis, unresectability, large tumor size and no treatment response were statistically significant poor prognostic factors of PDAC in univariate analysis (Table 6); HRs for high‐serum HMGB1 was 2.931 (95% CI, 1.317–6.710; P = 0.009).
Table 6.
Univariate and adjusted‐multivariate Cox proportional‐hazards estimates of patients with pancreatic ductal adenocarcinoma (PDAC) from validation dataset
| HRsc | 95% CI | P‐value | |
|---|---|---|---|
| Univariate analysis | |||
| Sex (male versus female) | 0.458 | 0.211–0.955 | 0.041 |
| Age (continuous variable) | 1.004 | 0.915–1.112 | 0.345 |
| High‐serum HMGB1 (≤30 ng/mL versus >30 ng/mL) | 2.931 | 1.317–6.710 | 0.009 |
| Depth of invasion (T‐stage, T1–4) | 1.328 | 0.821–2.101 | 0.238 |
| Node metastasis (N0, N1) | 1.791 | 0.755–3.521 | 0.197 |
| Distant metastasis (M0, M1) | 3.218 | 1.475–6.533 | 0.001 |
| Resectability (resectable versus unresectable) | 3.090 | 1.180–8.015 | 0.020 |
| Early PDAC versus non‐Early PDACa | 2.413 | 0.581–10.181 | 0.222 |
| Size (≤2 cm, >2 cm & ≤5 cm, >5 cm) | 2.401 | 1.141–5.123 | 0.020 |
| Tx. response (responder versus non‐responder)b | 8.977 | 2.590–28.911 | <0.001 |
| Multivariate analysis | |||
| Sex (male versus female) | 0.437 | 0.188–0.914 | 0.037 |
| High‐serum HMGB1 (≤30 ng/mL vs > 30 ng/mL) | 3.077 | 1.145–8.203 | 0.023 |
| Distant metastasis (M0, M1) | 3.180 | 1.289–7.933 | 0.011 |
| Resectability (resectable versus unresectable) | 0.325 | 0.080–1.329 | 0.120 |
| Size (≤2 cm, >2 cm & ≤5 cm, >5 cm) | 2.071 | 0.871–4.911 | 0.099 |
| Tx. response (responder versus non‐responder) | 7.527 | 1.900–27.773 | 0.002 |
A P‐value <0.05 is considered statistically significant.
A tumor is defined as early PDAC when it is limited to the pancreas without any invasion or with minimal invasion to the stroma and the size is ≤2 cm (T1, N0, M0, stage IA).
Treatment response was evaluated at 6 months after the first treatment including whole treatment methods regardless of individual treatment modalities.
Hazard ratios were adjusted for other variables by “enter” method in multivariate Cox analyses.
CI, confidence interval; HR, hazard ratio of mortality.
Multivariate Cox proportional‐hazards model demonstrated male, high‐serum HMGB1, distant metastasis, and no treatment response remained as significant poor prognostic factors after being adjusted to prognostic factors that were meaningful in univariate analysis (Table 6). Adjusted HRs for high‐serum HMGB1 in multivariate analysis was 3.077 (95% CI, 1.145–8.203; P = 0.023).
Discussion
In this study, we demonstrated that serum HMGB1 was significantly correlated with the presence, progression, and prognosis of PDAC. To our knowledge, this is the first report to demonstrate serum HMGB1 as a potential diagnostic and prognostic biomarker for PDAC using prospectively collected human serum samples. For statistical validation, we followed the Standards for Reporting of Diagnostic Accuracy (STARD) statement26 and the Reporting recommendations for tumor marker prognostic studies (REMARK) guideline.27
As a diagnostic tumor marker, serum HMGB1 showed stronger predictive power for PDAC compared with CA19‐9 or CEA in both training and independent validation datasets (Table 4). Also, serum HMGB1 could differentiate pancreatic inflammatory mass versus overt malignancies, resectable versus unresectable cases and early PDAC versus non‐early PDAC (Tables 3 and 5). These results imply that serum HMGB1 can be used as a reliable early‐biomarker for PDAC to predict the curative stage. In addition, theoretically, this marker can provide valuable information helping the decisions before surgical resection to avoid unnecessary surgical procedures. Moreover, serum HMGB1 can provide additive diagnostic advantages compared with serum CA19‐9 by overcoming the limitation of serum CA19‐9 in PDAC (Tables S2 and S3).
Nevertheless, serum HMGB1 has several limitations as a desirable tumor marker for PDAC. One limitation is that serum HMGB1 can be elevated in other cancers.15, 16, 17 However, the combination with pre‐existing markers for PDAC such as CA19‐9 and/or CEA would overcome this limitation by increasing the specificity for PDAC. This assumption led us to estimate the potential usability of HMGB1 as multiple‐marker panels combined with CA19‐9 and CEA using logistic regression. As expected, combination of HMGB1 with CA19‐9 produced desirable specificities close to 90% at approximately 80% of sensitivities (Table 4).
Another limitation is that serum HMGB1 can be elevated in pancreatic inflammatory diseases such as acute pancreatitis (AP) or CP or any inflammatory conditions in other sites without any overt tumor in pancreas. To overcome this limitation, subjects who suffered from any acute or chronic inflammatory conditions within or outside of the pancreas were excluded from control or PDAC groups, and subjects who had any other inflammatory conditions except CP were also excluded from the CP group. Additionally, we compared serum HMGB1 of PDAC patients with those of AP patients using serum samples obtained from additional 25 AP patients. As a result, we observed that serum HMGB1 of AP patients was distinctively lower than that of PDAC patients although it was moderately elevated in AP patients compared to normal (data not shown). We also observed that serum HMGB1 of CP patients was distinctively lower than that of PDAC patients, although it was moderately elevated in CP patients compared to controls (Table 2). A moderate increase of serum HMGB1 in CP patients might arise from intermediate steps of PDAC carcinogenesis as well as simple inflammatory conditions because constant release of HMGB1 may induce a chronic inflammatory condition, which is an important predisposing condition of PDAC.22
Also, we could not evaluate the correlation between serum HMGB1 and detailed treatment response according to individual treatment modalities because the sample size of each treatment group was too small to be evaluated individually and the allocation of cancer treatment was not randomized but stage‐based. Instead, we estimated the overall treatment response including all treatment modalities (Table 1).
Prognostic evaluation was performed in the validation dataset instead of the preliminary training dataset including relatively small sample size. Kaplan–Meier survival and Cox proportional‐hazards regression model demonstrated the potential roles of high‐serum HMGB1 as an independent poor prognostic factor in PDAC (Table 6, Fig. 4).
In the current study, we did not perform experiments such as immunohistochemistry (IHC) or western blot to evaluate the origin of the overexpression of serum HMGB1 because this article is mainly focused on the validation of serum HMGB1 as a useful biomarker for PDAC. However, until now, many previous studies have showed that HMGB1 is overexpressed in overt cancer tissue or cancer cells including pancreatic cancer,19, 20, 21 and HMGB1 can be released into an extracellular environment from necrotic cancer cells including PDAC, which is induced by either overgrowth of cancer or treatment.12, 13, 14, 28 Thus, overexpressed serum HMGB1 in PDAC patients is probably originated from cancer cells. To confirm this, we will perform the IHC study for HMGB1 in PDAC in the future.
In conclusion, our results indicate serum HMGB1 is closely correlated with the presence and advanced‐stage of PDAC and has potential as a diagnostic and prognostic predictor for PDAC. However, our results may be still preliminary results because of relatively small sample sizes, although the chosen sample sizes achieved >90% statistic power. Thus, further large‐scaled studies to confirm our results should follow.
Disclosure Statement
The authors have no conflicts of interest.
Supporting information
Table S1. Correlations between tested three biomarkers (HMGB1, CA19‐9, and CEA) and serum levels of total bilirubin (TBIL) and alkaline phosphatase (ALP) reflecting biliary tract obstruction in validation set. Table S2. Diagnostic ability of the combinations of three tested PDAC biomarkers evaluated by logistic regression when serum alkaline phosphatase (ALP) levels are above normal range (>250 IU/L) versus within normal range (≤250 IU/L) from validation dataset. Table S3. Diagnostic ability of the combinations of three tested PDAC biomarkers evaluated by logistic regression when serum CA19‐9 levels are relatively low (≤40 U/mL) versus relatively high (>40 U/mL) from validation dataset.
Acknowledgments
This study was financially supported by the Korean Medical Women's Association (KMWA‐2009‐12) and a faculty research grant of Yonsei University College of Medicine for 2009 (6‐2009‐0091).
(Cancer Sci, 2012; 103: 1714–1721)
References
- 1. Warshaw AL, Fernández‐del Castillo C. Pancreatic carcinoma. N Engl J Med 1992; 326: 455–65. [DOI] [PubMed] [Google Scholar]
- 2. Locker GY, Hamilton S, Harris J et al ASCO 2006 update of recommendations for the use of tumor markers in gastrointestinal cancer. J Clin Oncol 2006; 24: 5313–27. [DOI] [PubMed] [Google Scholar]
- 3. Gupta MK, Arciaga R, Bocci L, Tubbs R, Bukowski R, Deodhar SD. Measurement of a monoclonal‐antibody‐defined antigen (CA19‐9) in the sera of patients with malignant and nonmalignant diseases. Comparison with carcinoembryonic antigen. Cancer 1985; 56: 277–83. [DOI] [PubMed] [Google Scholar]
- 4. Akdoğan M, Saşmaz N, Kayhan B, Biyikoğlu I, Dişibeyaz S, Sahin B. Extraordinarily elevated CA19‐9 in benign conditions: a case report and review of the literature. Tumori 2001; 87: 337–9. [DOI] [PubMed] [Google Scholar]
- 5. Lamerz R. Role of tumour markers, cytogenetics. Ann Oncol 1999; 10: 145–9. [PubMed] [Google Scholar]
- 6. Begent RH. The value of carcinoembryonic antigen measurement in clinical practice. Ann Clin Biochem 1984; 21: 231–8. [DOI] [PubMed] [Google Scholar]
- 7. Scaffidi P, Misteli T, Bianchi ME. Release of chromatin protein HMGB1 by necrotic cells triggers inflammation. Nature 2002; 418: 191–5. [DOI] [PubMed] [Google Scholar]
- 8. Wang H, Bloom O, Zhang M et al HMG‐1 as a late mediator of endotoxin lethality in mice. Science 1999; 285: 248–51. [DOI] [PubMed] [Google Scholar]
- 9. Palumbo R, Sampaolesi M, De Marchis F et al Extracellular HMGB1, a signal of tissue damage, induces mesoangioblast migration and proliferation. J Cell Biol 2004; 164: 441–9. [DOI] [PMC free article] [PubMed] [Google Scholar]
- 10. Palumbo R, Galvez BG, Pusterla T et al Cells migrating to sites of tissue damage in response to the danger signal HMGB1 require NF‐kappaB activation. J Cell Biol 2007; 179: 33–40. [DOI] [PMC free article] [PubMed] [Google Scholar]
- 11. Taguchi A, Blood DC, del Toro G et al Blockade of RAGE‐amphoterin signalling suppresses tumour growth and metastases. Nature 2000; 405: 354–60. [DOI] [PubMed] [Google Scholar]
- 12. Sims GP, Rowe DC, Rietdijk ST, Herbst R, Coyle AJ. HMGB1 and RAGE in inflammation and cancer. Annu Rev Immunol 2010; 28: 367–88. [DOI] [PubMed] [Google Scholar]
- 13. Tang D, Kang R, 3rd Zeh HJ, Lotze MT. High‐mobility group box 1 and cancer. Biochim Biophys Acta 2010; 1799: 131–40. [DOI] [PMC free article] [PubMed] [Google Scholar]
- 14. Ellerman JE, Brown CK, de Vera M et al Masquerader: high mobility group box‐1 and cancer. Clin Cancer Res 2007; 13: 2836–48. [DOI] [PubMed] [Google Scholar]
- 15. Chung HW, Lee SG, Kim H et al Serum high mobility group box‐1 (HMGB1) is closely associated with the clinical and pathologic features of gastric cancer. J Transl Med 2009; 7: 38–48. [DOI] [PMC free article] [PubMed] [Google Scholar]
- 16. Cheng BQ, Jia CQ, Liu CT et al Serum high mobility group box chromosomal protein 1 is associated with clinicopathologic features in patients with hepatocellular carcinoma. Dig Liver Dis 2008; 40: 446–52. [DOI] [PubMed] [Google Scholar]
- 17. Shang GH, Jia CQ, Tian H et al Serum high mobility group box protein 1 as a clinical marker for non‐small cell lung cancer. Respir Med 2009; 103: 1949–53. [DOI] [PubMed] [Google Scholar]
- 18. Schlueter C, Weber H, Meyer B et al Angiogenetic signaling through hypoxia: HMGB1: an angiogenetic switch molecule. Am J Pathol 2005; 166: 1259–63. [DOI] [PMC free article] [PubMed] [Google Scholar]
- 19. Wu D, Ding Y, Wang S, Zhang Q, Liu L. Increased expression of high mobility group box 1 (HMGB1) is associated with progression and poor prognosis in human nasopharyngeal carcinoma. J Pathol 2008; 216: 167–75. [DOI] [PubMed] [Google Scholar]
- 20. Yao X, Zhao G, Yang H, Hong X, Bie L, Liu G. Overexpression of high‐mobility group box 1 correlates with tumor progression and poor prognosis in human colorectal carcinoma. J Cancer Res Clin Oncol 2010; 136: 677–84. [DOI] [PMC free article] [PubMed] [Google Scholar]
- 21. Huang QX, Wang GB, Sun NF, Wang CY. Inhibitory effects of high mobility group box 1 antisense nucleotide on invasion of human pancreatic cancer cell line PCNA‐1. Ai Zheng 2004; 23: 1036–40. [PubMed] [Google Scholar]
- 22. Mignogna MD, Fedele S, Lo Russo L et al Immune activation and chronic inflammation as the cause of malignancy in oral lichen planus: is there any evidence? Oral Oncol 2004; 40: 120–30. [DOI] [PubMed] [Google Scholar]
- 23. Takada M, Koizumi T, Toyama H, Suzuki Y, Kuroda Y. Differential expression of RAGE in human pancreatic carcinoma cells. Hepatogastroenterology 2001; 48: 1577–8. [PubMed] [Google Scholar]
- 24. Burgu B, Suer E, Aydogdu O, Soygur T. Pelvic reduction during pyeloplasty for antenatal hydronephrosis: does it affect outcome in ultrasound and nuclear scan postoperatively? Urology 2010; 76: 169–74. [DOI] [PubMed] [Google Scholar]
- 25. Gall FP, Kessler H. Early cancer of the exocrine pancreas: diagnosis and prognosis. Chirurg 1987; 58: 78–83. [PubMed] [Google Scholar]
- 26. Bossuyt PM, Reitsma JB, Bruns DE et al Towards complete and accurate reporting of studies of diagnostic accuracy: the STARD initiative. Standards for Reporting of Diagnostic Accuracy. Clin Chem 2003; 49: 1–6. [DOI] [PubMed] [Google Scholar]
- 27. McShane LM, Altman DG, Sauerbrei W, Taube SE, Gion M, Clark GM. Reporting recommendations for tumor marker prognostic studies. J Clin Oncol 2005; 23: 9067–72. [DOI] [PubMed] [Google Scholar]
- 28. Dong XE, Ito N, Lotze MT et al High mobility group box I (HMGB1) release from tumor cells after treatment: implications for development of targeted chemoimmunotherapy. J Immunother 2007; 30: 596–606. [DOI] [PubMed] [Google Scholar]
Associated Data
This section collects any data citations, data availability statements, or supplementary materials included in this article.
Supplementary Materials
Table S1. Correlations between tested three biomarkers (HMGB1, CA19‐9, and CEA) and serum levels of total bilirubin (TBIL) and alkaline phosphatase (ALP) reflecting biliary tract obstruction in validation set. Table S2. Diagnostic ability of the combinations of three tested PDAC biomarkers evaluated by logistic regression when serum alkaline phosphatase (ALP) levels are above normal range (>250 IU/L) versus within normal range (≤250 IU/L) from validation dataset. Table S3. Diagnostic ability of the combinations of three tested PDAC biomarkers evaluated by logistic regression when serum CA19‐9 levels are relatively low (≤40 U/mL) versus relatively high (>40 U/mL) from validation dataset.