

Abstract
The purpose of the present study was to investigate the prognostic significance of murine double minute 4 (MDM4) in chronic lymphocytic leukemia (CLL) and to characterize the role of MDM4 in the p53 pathway. Full‐length MDM4 (FL‐MDM4), a splicing variant of MDM4 (S‐MDM4) and murine double minute 2 (MDM2) mRNA expressions were detected by quantitative PCR in 140 Chinese patients with CLL, and primary CLL cells were treated in vitro with either fludarabine or Nutlin‐3 to explore the interaction between p53 status and MDM4 or MDM2 expression. A marked increase of FL‐MDM4 and S‐MDM4 expressions were observed in the CLL patients with p53 aberrations (deletion and/or mutation) (P = 0.024, P < 0.001). A high level of S‐MDM4 mRNA expression was associated with short treatment free survival (TFS) (P = 0.004). FL‐MDM4 expression was significantly decreased after fludarabine treatment (P = 0.001) but increased after Nutlin‐3 treatment (P = 0.008) of primary CLL cells without p53 aberrations. Both S‐MDM4 and MDM2 expressions were significantly increased after fludarabine treatment of CLL cells without p53 aberrations (P = 0.013 and P = 0.030). MDM2 overexpression also occurred in CLL cells with p53 wild type after Nutlin‐3 treatment (P = 0.018). FL‐MDM4 and S‐MDM4 overexpression are indicators of p53 aberrations in CLL patients, suggesting that those patients have a poor prognosis. FL‐MDM4 inhibitory effects on p53 can be removed by MDM2‐p53 and saved by Nutlin‐3.
The clinical course of chronic lymphocytic leukemia (CLL) is highly variable;1 hence, an appropriate treatment protocol is essential. Chemotherapy drugs, for example fludarabine, exert anti‐tumor functions dependent on the normal function of p53. CLL patients with del(17p13) have a poor response to the present regimes, and there is no standard treatment.2 Therefore, p53 status is associated with the appropriate treatment protocols for CLL patients.
The tumor suppressor p53 plays a central role in the regulation of cell cycle, apoptosis, DNA repair and senescence.3, 4, 5, 6, 7 Once the p53 gene is inhibited or inactivated, it promotes tumor development. Distinct pathways have been identified that cause p53 activation, and ataxia telangiectasia mutated (ATM)‐dependent response to DNA damage is one of them. ATM kinase as a key molecule activates p53 after DNA damage.8 There are several regulators taking part in p53 activation, such as murine double minute 2 (MDM2) and murine double minute 4 (MDM4). After DNA damage, phosphorylation of full‐length MDM4 (FL‐MDM4), in an ATM‐dependent manner, increases binding, ubiquitination and degradation of MDM2, and eliminates its inhibition on p53.9
The purpose of this study was to investigate the prognostic significance of MDM4, and to characterize the role of MDM4 in the p53 pathway. We detected the expressions of FL‐MDM4, a splicing variant of MDM4 (S‐MDM4) and MDM2 mRNA by quantitative PCR (qPCR) in 140 Chinese CLL patients, and analyzed the correlation between those murine double minute (MDM) expressions and CLL prognostic markers. Furthermore, primary CLL cells were treated in vitro with either fludarabine or Nutlin‐3, to explore the interaction between p53 status and the MDM.
Materials and Methods
Patients
The present study enrolled 140 previously‐untreated CLL patients between January 2004 and June 2011. All patients provided informed consent and the research project was approved by the university and institutional review boards. Diagnosis and response were based on the revised National Cancer Institute criteria.10 The staging of CLL was performed according to the Binet stage system.11 Date collected at diagnosis included: age, gender, Binet stages, β2‐microglobulin (β2‐MG) and lactate dehydrogenase (LDH). A range of other prognostic markers was also analyzed for the majority of patients: immunoglobulin heavy‐chain variable region (IGHV) and p53 mutation status, ZAP‐70 and CD38 expression, and cytogenetics by FISH.
Immunoglobulin heavy‐chain variable region mutation status analysis
IGHV mutation status was detected by IGHV gene primer and IGH Somatic Hypermutation Assay for Gel Detection kit (InVivoScribe, San Diego, CA, USA). The multiplex PCR products of IGHV were detected by direct sequencing, as previously described.12 A germline homology of 98% was used as the cut‐off between IGHV mutated and unmutated cases.
Analysis of p53 mutations
The p53 mutation status was studied by PCR and direct sequencing. We used the same primers as previously described.13 PCR products of p53 were purified using standard methods (Invitrogen, Carlsbad, CA, USA) and directly sequenced using the ABI3730XL 96‐capillary DNA Analyzer (Applied Biosystems, Foster City, CA, USA).
Detection of CD38 and ZAP‐70 by flow cytometry
The expressions of ZAP‐70 and CD38 protein were measured using CD5‐FITC (BD Biosciences, San Jose, CA, USA), CD19‐PerCPCy5.5 (BD Biosciences), CD38‐PE (clone HB‐7; BD Biosciences) and ZAP‐70‐PE (clone 1F7.2; Caltag, Burlingame, CA, USA). This technique was performed as previously described.14 Data acquisition and analysis were performed using a BD FACSCalibur flow cytometer (BD Biosciences) and Cell Quest software (BD Biosciences). Cut‐off points of 30% and 20% were used to define positivity for CD38 and ZAP‐70, respectively.
Detection of molecular cytogenetic aberrations by FISH
Trisomy 12, 14q32 translocation, and 6q23, 11q22.3, 13q14 and 17p13 deletion were detected by FISH analysis, as previously described.15 The cut‐off levels for positive values (mean of normal control ± 3 SD), determined from samples of eight cytogenetically normal persons, were 3.3% for trisomy 12, 7.9% for 14q32 translocation, 7.4% for del(6q23), 7.5% for del(11q22.3), 10.0% for del(13q14) and 5.2% for del(17p13), respectively.
Protocol of primary cell culture
For preparation of primary cell cultures, CLL cells from 22 untreated patients were isolated from heparinized venous blood by density gradient centrifugation. The isolated cells were predominantly CLL B cells (>90% CD5+CD19+), as assessed by flow cytometry (FACScan, Becton Dickinson, San Jose, CA, USA). Freshly isolated CLL cells were seeded in six‐well plates (5–10 × 106 cells/well), treated by 3.5 μM fludarabine (Sigma) or 10 μM Nutlin‐3 (Sigma, St. Louis, MO, USA) or not, and cultured in RPMI‐1640 medium supplemented with 10% FCS in a humidified atmosphere containing 5% CO2 at 37°C.
Detection of the p53/p21 function by flow cytometry
The function of p53/p21 gene was detected by flow cytometry.16 Cells were harvested after 24 h in in vitro culture with fludarabine treatment. 5 × 10⁶ cells were fixed in 2% paraformaldehyde, at −4°C for 30 min, washed with PBS, and left in 80% ethanol at −20°C. Fixed cells were washed with PBS and cell membranes were ruptured using a cell permebilization kit (BD Biosciences FIX&PERM) at room temperature for 30 min. CLL cells were labeled with CD19‐APC (BD Biosciences), kept away from light for 15 min, and washed with PBS. Fixed cells were stained with p53‐phycoerythrin antibody (BD Biosciences) and p21‐fluorescein isothiocyanate (Calbiochem, San Diego, CA, USA) or the corresponding isotype controls. After incubation at ambient temperature for 15 min away from light, cells were detected on the BD FACSCalibur (BD Biosciences) and data were analyzed using the CellQuest Pro software (BD Biosciences).
Real‐time quantitative PCR analysis for murine double minuteand murine double minute 2
MDM4 and MDM2 mRNA expression was investigated by qPCR. Total RNA was isolated from peripheral blood mononuclear cells or culture cells, which had >90% B‐lymphocytes measured by flow cytometry. Expression of MDM4 or MDM2 was analyzed using 1 μg of purified total RNA, 5× M‐MLV buffer, M‐MLV, DTT, specific primer sets and SYBR Green I (Invitrogen). Reactions for qPCR were conducted in triplicate, using the Applied Biosystems ABI 7300 Real Time PCR system (Applied Biosystems software: SDSv2.0). Each reaction mixture contained 1 μL of cDNA (normalized to 1000 ng), 10 μL SYBR Green PCR Master Mix (Applied Biosystems), 1 μL MDM2, MDM4 or β‐actin primers (Table S1), and deionized water to a total volume of 20 μL. Cycle conditions for MDM2, MDM4 and β‐actin were one cycle for 4 min at 95°C, 40 cycles for 30 s at 95°C, 30 s at 60°C (58°C for FL‐MDM4), 30 s at 72°C, and, finally, 1 cycle for 10 min at 72°C. The threshold cycle (C t) was defined as the fractional cycle number at which the fluorescence passes the fixed threshold, and each sample was normalized based on its endogenous β‐actin RNA content. Sequences of amplified products were verified by DNA sequencing.
Statistical analysis
All statistical analyses were performed using the spss program for Windows (version 17.0, SPSS Inc., Chicago, IL, USA). ΔC t was calculated by subtracting the C t of the reference gene (β‐actin) from the C t of the genes of interest. The relative amount of MDM2, FL‐MDM4 and S‐MDM4 mRNA was calculated using the equation . MDM2, FL‐MDM4 and S‐MDM4 mRNA expression levels were compared by Mann–Whitney U‐test. Differences of gene expression levels between primary CLL cells treated with or without fludarabine and Nutlin‐3 were analyzed by matched‐pairs t‐test. The receiver operating characteristic (ROC) curve was used to determine the cut‐off value. Treatment‐free survival (TFS) was defined as the period from the diagnosis date to the time either of the first CLL‐specific treatment or the last follow‐up date. The Kaplan–Meier method was used to construct survival curves, and results were compared using the log‐rank test. For all tests, a P‐value of 0.05 was considered significant.
Results
Clinical characteristics of chronic lymphocytic leukemia patients
The characteristics of 140 CLL patients are summarized in Table 1. Of the 140 patients, 96 were men and 44 were men (male:female ratio, 2.2), and the median age was 61 years (range: 33–84 years). According to the Binet staging system,11 49 (35%) patients were in stage A, 53 (37.9%) in stage B and 38 (27.1%) in stage C. p53 aberrations were defined as del(17p13) and/or p53 mutations. At the time of enrollment, p53 aberrations occurred in 28 of 131 CLL patients (21.4%). Some information is unavailable because of limited biological material or the absence of clinical data. Among these patients, 99 patients were treated with chemotherapy or chemoimmunotherapy, and 14 patients died of disease progression. With the median follow‐up duration of 21.5 months (range, 2–90 months), the median TFS of 140 CLL patients was 13 months (range, 0–89 months).
Table 1.
Clinical and biological characteristics of 140 patients with chronic lymphocytic leukemia
| Clinical features | Value |
|---|---|
| Age (years old) | |
| <60 | 63 (45%) |
| ≥60 | 77 (55%) |
| Gender | |
| Male | 96 (69%) |
| Female | 44 (31%) |
| Binet stages | |
| A or B | 102 (73%) |
| C | 38 (27%) |
| LDH (n = 102) | |
| <250 U/L | 65 (64%) |
| ≥250 U/L | 37 (36%) |
| β2‐MG (n = 90) | |
| <3 mg/L | 40 (44%) |
| ≥3 mg/L | 50 (56%) |
| CD38 (n = 130) | |
| ≤30% | 93 (72%) |
| >30% | 37 (28%) |
| ZAP‐70 (n = 121) | |
| ≤20% | 95 (79%) |
| >20% | 26 (21%) |
| IGHV mutation status (n = 125) | |
| Mutated | 78 (62%) |
| Unmutated | 47 (38%) |
| Del(6q23) (n = 68) | |
| Negative | 59 (87%) |
| Positive | 9 (13%) |
| Del(11q22.3) (n = 105) | |
| Negative | 88 (84%) |
| Positive | 17 (16%) |
| Trisomy 12 (n = 93) | |
| Negative | 75 (81%) |
| Positive | 18 (19%) |
| Del(13q14) (n = 86) | |
| Negative | 55 (64%) |
| Positive | 31 (36%) |
| 14q32 translocation (n = 83) | |
| Negative | 62 (75%) |
| Positive | 21 (25%) |
| Del(17p13) (n = 105) | |
| Negative | 88 (84%) |
| Positive | 17 (16%) |
| p53 mutation status (n = 125) | |
| Unmutated | 104 (83%) |
| Mutated | 21 (17%) |
| p53 aberrations (n = 131) | |
| Positive | 28 (21%) |
| Negative | 103 (79%) |
IGHV, immunoglobulin heavy‐chain variable region; LDH, lactate dehydrogenase.
Full length murine double minute 4, splicing variant of murine double minute 4 and murine double minute 2 mRNA expression in 140 chronic lymphocytic leukemia patients
The qPCR products were sequenced, and the presence of S‐MDM4 as an MDM4 variant with a short internal deletion of 68 bp was validated, as shown earlier.17, 18 The median expression levels of FL‐MDM4, S‐MDM4 and MDM2 were 0.05274 (0.1101–0.01342), 0.01689 (0.03349–0.00645) and 0.01172 (0.02717–0.00539), respectively.
Correlation of full length murine double minute 4, splicing variant of murine double minute 4 and murine double minute 2 expressions with prognostic factors
FL‐MDM4 and S‐MDM4 expressions were significantly increased with the del(17p13) (P = 0.037 and P = 0.006), p53 mutations (P = 0.023 and P < 0.001) and p53 aberrations (P = 0.024 and P < 0.001) (Fig. 1). The correlation between the level of MDM2 expression and p53 status was not observed (P = 0.196, P = 0.095 and P = 0.092, respectively) (Fig. 1). A marked increase of S‐MDM4 expression was observed in CLL patients with advanced Binet stage (P = 0.020), higher level of LDH (P = 0.001) and β2‐MG (P = 0.026). The clinical and biological characteristics are presented in Table 2.
Figure 1.
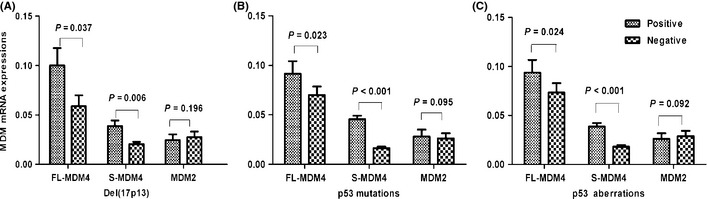
The correlations between murine double minute (MDM) expression and del(17p13), p53 mutations and p53 aberrations. (A) The level of full‐length MDM4 (FL‐MDM4) and splicing variant of MDM4 (S‐MDM4) expression in chronic lymphocytic leukemia (CLL) patients with del(17p13) was significantly higher than in the patients without del(17p13) (P = 0.037 and P = 0.006). However, MDM2 expression is not correlated with del(17p13) (P = 0.196). (B) The level of FL‐MDM4 and S‐MDM4 expression in CLL patients with p53 mutations was significantly higher than in the patients without p53 mutations (P = 0.023, P < 0.001). However, MDM2 expression is not correlated with p53 mutations (P = 0.095). (C) FL‐MDM4 and S‐MDM4 mRNA expressions in CLL patients with p53 aberrations were significantly higher than in the patients without p53 aberrations (P = 0.024 and P < 0.001). However, MDM2 expression was not correlated with p53 aberrations (P = 0.092).
Table 2.
The differences of FL‐MDM4, S‐MDM4 and MDM2 expressions between various groups of patients
| Clinical features | Cases | FL‐MDM4 [M (P5–P95)] | S‐MDM4 [M (P5–P95)] | MDM2 [M (P5–P95)] |
|---|---|---|---|---|
| Age (years) | 140 | P = 0.164 | P = 0.407 | P = 0.654 |
| <60 | 63 | 0.03492 (0.10682–0.01289) | 0.01686 (0.06046–0.00330) | 0.01332 (0.11585–0.00088) |
| ≥60 | 77 | 0.04972(0.10095–0.01136) | 0.01807 (0.05992–0.00191) | 0.00942 (0.10034–0.00135) |
| Gender | 140 | P = 0.191 | P = 0.838 | P = 0.408 |
| Male | 96 | 0.05158 (0.23611–0.00350) | 0.01820 (0.06371–0.00190) | 0.01222 (0.10234–0.00093) |
| Female | 44 | 0.07591 (0.40579–0.00831) | 0.01613 (0.05985–0.00372) | 0.00983 (0.10701–0.00142) |
| Binet stages | 140 | P = 0.167 | P = 0.020 | P = 0.788 |
| A or B | 102 | 0.04152 (0.30254–0.00323) | 0.01478 (0.05954–0.00192) | 0.01160 (0.09948–0.00090) |
| C | 38 | 0.09043 (0.32731–0.00530) | 0.02146 (0.09113–0.00434) | 0.01375 (0.13301–0.00129) |
| LDH | 102 | P = 0.218 | P = 0.001 | P = 0.339 |
| <250 U/L | 65 | 0.04152 (0.35232–0.00226) | 0.01360 (0.05487–0.00212) | 0.01160 (0.10108–0.00087) |
| ≥250 U/L | 37 | 0.08391 (0.18235–0.00667) | 0.03082 (0.06813–0.00363) | 0.01360 (0.10203–0.00254) |
| β2‐MG | 90 | P = 0.906 | P = 0.026 | P = 0.457 |
| <3 mg/L | 40 | 0.05123 (0.41123–0.00205) | 0.01409 (0.05692–0.00191) | 0.01172 (0.10264–0.00071) |
| ≥3 mg/L | 50 | 0.05038 (0.15312–0.00561) | 0.02238 (0.07698–0.00369) | 0.00860 (0.10866–0.00113) |
| CD38 | 130 | P = 0.437 | P = 0.932 | P = 0.084 |
| ≤30% | 93 | 0.04803 (0.24155–0.00658) | 0.01686 (0.06142–0.00238) | 0.00942 (0.10245–0.00085) |
| >30% | 37 | 0.08839 (0.30763–0.00274) | 0.01833 (0.06356–0.00181) | 0.01640 (0.15070–0.00188) |
| ZAP‐70 | 121 | P = 0.559 | P = 0.729 | P = 0.242 |
| ≤20% | 95 | 0.05042 (0.23849–0.00374) | 0.01652 (0.05962–0.00305) | 0.01053 (0.10561–0.00085) |
| >20% | 26 | 0.06293 (0.49583–0.00505) | 0.01965 (0.09150–0.00041) | 0.013424 (0.11728–0.00176) |
| IGHV mutation status | 125 | P = 0.382 | P = 0.626 | P = 0.131 |
| Mutated | 78 | 0.05007 (0.31161–0.00354) | 0.01505 (0.06106–0.00192) | 0.00892 (0.10645–0.00093) |
| Unmutated | 47 | 0.04803 (0.28006–0.00480) | 0.01833 (0.05873–0.00327) | 0.01332 (0.09911–0.00162) |
| Del(6q23) | 68 | P = 0.906 | P = 0.625 | P = 0.278 |
| Negative | 59 | 0.04152 (0.23816–0.00395) | 0.01652 (0.06058–0.00180) | 0.01234 (0.10295–0.00224) |
| Positive | 9 | 0.02120 (0.40054–0.00362) | 0.03082 (0.06561–0.00317) | 0.00765 (0.02076–0.00086) |
| Del(11q22.3) | 105 | P = 0.811 | P = 0.465 | P = 0.431 |
| Negative | 88 | 0.05123 (0.35408–0.00369) | 0.01613 (0.06212–0.00222) | 0.01118 (0.11182–0.00142) |
| Positive | 17 | 0.08839 (0.14359–0.00792) | 0.01833 (0.09087–0.00072) | 0.01686 (0.10013–0.00086) |
| Trisomy 12 | 93 | P = 0.815 | P = 0.115 | P = 0.189 |
| Negative | 75 | 0.04972 (0.30246–0.00374) | 0.01438 (0.06909–0.00189) | 0.01184 (0.13842–0.00085) |
| Positive | 18 | 0.05441 (0.40754–0.00749) | 0.02826 (0.06058–0.00372) | 0.01538 (0.11908–0.00455) |
| Del(13q14) | 86 | P = 0.798 | P = 0.090 | P = 0.511 |
| Negative | 55 | 0.05274 (0.40839–0.00374) | 0.01652 (0.08461–0.00305) | 0.01234 (0.12026–0.00081) |
| Positive | 31 | 0.04269 (0.24682–0.00539) | 0.00714 (0.05724–0.00124) | 0.01209 (0.11648–0.00131) |
| 14q32 translocation | 83 | P = 0.575 | P = 0.402 | P = 0.376 |
| Negative | 62 | 0.05158 (0.28868–0.00425) | 0.01686 (0.05139–0.00182) | 0.01222 (0.10284–0.00094) |
| Positive | 21 | 0.05274 (0.40684–0.00915) | 0.01184 (0.09475–0.00222) | 0.01858 (0.18540–0.00148) |
| Del(17p13) | 105 | P = 0.037 | P = 0.006 | P = 0.196 |
| Negative | 88 | 0.03822 (0.34428–0.0067) | 0.01370 (0.06218–0.00215) | 0.01118 (0.10270–0.00137) |
| Positive | 17 | 0.09408 (0.29730–0.0085) | 0.03396 (0.09087–0.00720) | 0.01734 (0.10013–0.00095) |
| p53 mutation status | 125 | P = 0.023 | P < 0.001 | P = 0.095 |
| Unmutated | 104 | 0.02988 (0.28252–0.00382) | 0.01230 (0.04362–0.00209) | 0.00956 (0.09479–0.00102) |
| Mutated | 21 | 0.10584 (0.23279–0.00563) | 0.04109 (0.08784–0.02112) | 0.01640 (0.11719–0.00245) |
| p53 aberrations | 131 | P = 0.024 | P < 0.001 | P = 0.092 |
| Positive | 28 | 0.09869 (0.27143–0.00652) | 0.03653 (0.07724–0.00350) | 0.01515 (0.11055–0.00317) |
| Negative | 103 | 0.02916 (0.30610–0.00365) | 0.01176 (0.02988–0.00514) | 0.00982 (0.10281–0.00101) |
FL‐MDM4, full‐length murine double minute 4; IGHV, immunoglobulin heavy‐chain variable region; LDH, lactate dehydrogenase; MDM2, murine double minute 2; S‐MDM4, splicing variant of murine double minute 4.
Prognostic impact of murine double minute 4 expression level on treatment‐free survival
To determine an optimal threshold cut‐off value for MDM4 mRNA level, ROC curve analysis was used based on the positivity or negativity of del(17p13). This allowed for dividing FL‐MDM4 or S‐MDM4 expression level into two subtypes. According to ROC curve analysis for FL‐MDM4 and del(17p13), the area under the curve (AUC) was 0.669 (95% CI, 0.528–0.811; P = 0.032), and the optimal cut‐off value of FL‐MDM4 mRNA was 0.0644, with a 75.0% sensitivity and a 63.9% specificity. According to ROC curve analysis for S‐MDM4 mRNA and del(17p13), the AUC was 0.820 (95% CI, 0.687–0.953; P < 0.001), and the optimal cut‐off value of S‐MDM4 mRNA 0.0223, with an 87.5% sensitivity and a 77.1% specificity.
A univariate analysis was used to assess the associations between TFS and potential risk factors, including MDM4 expression level. As expected, high level expression of S‐MDM4 (P = 0.004) was an adverse factor in determining the TFS (Fig. 2), but FL‐MDM4 has no significance in determining the TFS (P = 0.278). Binet stage (P = 0.035), p53 mutation (P = 0.037) and del(17p13) (P = 0.001) were also prognostic factors with statistical significance. A multivariate Cox analysis was used, which included S‐MDM4, FL‐MDM4, MDM2, Binet stage, p53 mutation and del(17p13), to show prognostic independence. This analysis included 63 patients. Del(17p13) (P = 0.006) was an independent prognostic factor and strongly associated with TFS.
Figure 2.
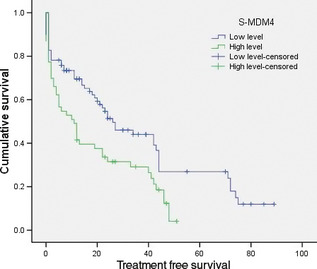
Treatment free survival (months) curve of patients with low level and high levels of splicing variant of murine double minute 4 (S‐MDM4) mRNA. FL‐MDM4, full‐length MDM4.
Clinical characteristics of the chronic lymphocytic leukemia patients with cell culture
For preparation of primary cell cultures, CLL cells were from 22 untreated patients. The clinical and biological characteristics of these patients are presented in Table 3. Three cases showed p53 mutations paired to del(17p13), six cases showed p53 mutations in the absence of del(17p13). The function of p53/p21 was detected by flow cytometry both at the beginning of incubation and after 24‐h fludarabine treatment. The level of p53 protein did not increase after treatment with fludarabine in seven patients. The level of p21 protein of 10 patients showed no increase after fludarabine treatment, implying p53 dysfunction. In the rest of the cases, the increased level of p21 protein was observed after fludarabine treatment, suggesting that p53 function was normal and the median increased level was 32.5% (range: 7.3–61.8%).16
Table 3.
Clinical and biological characteristics in 22 chronic lymphocytic leukemia patients
| Number | Gender | Age | Binet stage | IGHV mutation status | Fludarabine‐treated | p53 mutation status | p53 deletion | |
|---|---|---|---|---|---|---|---|---|
| p53 | p21 | |||||||
| 1 | Female | 45 | C | Unmutated | No | No | Mutated | Yes |
| 2 | Male | 54 | B | Mutated | Yes | Yes | Wild type | No |
| 3 | Female | 80 | B | Unmutated | Yes | Yes | Wild type | No |
| 4 | Male | 69 | B | Unmutated | Yes | Yes | Wild type | No |
| 5 | Female | 80 | C | Unmutated | No | No | Mutated | Yes |
| 6 | Female | 68 | C | Mutated | Yes | Yes | Mutated | No |
| 7 | Male | 57 | B | Mutated | No | No | Mutated | No |
| 8 | Female | 48 | C | Mutated | No | No | Mutated | No |
| 9 | Female | 70 | B | Mutated | Yes | Yes | Wild type | No |
| 10 | Female | 82 | A | Unmutated | Yes | No | Mutated | No |
| 11 | Male | 49 | B | Mutated | Yes | Yes | Wild type | No |
| 12 | Female | 52 | C | Unmutated | Yes | No | Wild type | No |
| 13 | Female | 63 | B | Mutated | Yes | Yes | Wild type | No |
| 14 | Female | 56 | B | Unmutated | No | No | Mutated | No |
| 15 | Male | 71 | C | Mutated | Yes | Yes | Wild type | No |
| 16 | Female | 68 | A | Unmutated | No | No | Mutated | No |
| 17 | Female | 67 | A | Mutated | Yes | Yes | Wild type | No |
| 18 | Female | 61 | A | Mutated | Yes | Yes | Wild type | No |
| 19 | Female | 67 | C | Mutated | Yes | Yes | Wild type | No |
| 20 | Male | 85 | A | Mutated | Yes | Yes | Wild type | No |
| 21 | Female | 50 | C | Unmutated | No | No | Mutated | Yes |
| 22 | Female | 52 | A | Mutated | Yes | No | Wild type | No |
“Yes” stands for raise up or positive; “No” stands for no change or negative. IGHV, immunoglobulin heavy‐chain variable region.
Expression levels of full length murine double minute 4, splicing variant of murine double minute 4 and murine double minute 2 after fludarabine or Nutlin‐3 treatment
To assay the interaction of p53 and FL‐MDM4, S‐MDM4 and MDM2 expressions, we detected the expression of those genes in fludarabine‐treated (n = 22) or Nutlin‐3‐treated (n = 16) CLL cells by qPCR. In the primary CLL cells without p53 aberrations or with normal p53 function, FL‐MDM4 mRNA expression was significantly decreased after 24 h fludarabine treatment (P = 0.001 and P = 0.002) (Figs 3 and 4), but increased after Nutlin‐3 treatment (P = 0.008 and P = 0.011) (Figs 3 and 4). A marked increase of S‐MDM4 expression was observed in the CLL cells after 24 h treatment with fludarabine (P = 0.013 and P = 0.017), but was not observed with Nutlin‐3 (P = 0.183 and P = 0.102) (Figs 3 and 4). The level of MDM2 expression was elevated after 24 h incubation with fludarabine (P = 0.030 and P = 0.007) and Nutlin‐3 (P = 0.018 and P = 0.038) (Figs 3 and 4). This indicated that FL‐MDM4 is deregulated by MDM2, removing the inhibition to p53 after fludarabine treatment in CLL cells, which decreases FL‐MDM4 expression and increases MDM2 expression. When Nutlin‐3 selectively inhibits p53‐MDM2 interaction, FL‐MDM4 mRNA expression can never be deregulated by MDM2, and be upregulated by Nutlin‐3 in CLL cells. Because p53‐MDM2 interaction does not exist, MDM2 is free and its mRNA expression is increased in CLL cells. S‐MDM4 mRNA expression is only increased in CLL cells after fludarabine treatment. In the primary CLL cells with p53 aberrations or p53 dysfunction, the levels of FL‐MDM4, S‐MDM4 and MDM2 expressions were not significantly increased or decreased after fludarabine or Nutlin‐3 treatment.
Figure 3.
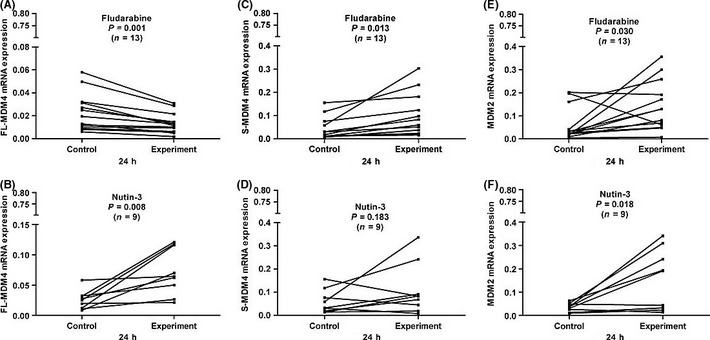
In the chronic lymphocytic leukemia (CLL) cells without p53 aberrations, full‐length MDM4 (FL‐MDM4) expression was significantly decreased after 24 h incubation with fludarabine compared with the control (P = 0.001) (A), but increased after 24 h incubation with Nutin‐3 (P = 0.008) (B). A marked increase of splicing variant of MDM4 (S‐MDM4) was observed in CLL cells after 24 h treatment with fludarabine compared with the control (P = 0.013) (C), but was not observed with Nutin‐3 (P = 0.183) (D). MDM2 expressions were significantly increased after 24 h incubation with fludarabine and Nutin‐3 compared with the control (P = 0.030 and (P = 0.018) (E and F).
Figure 4.
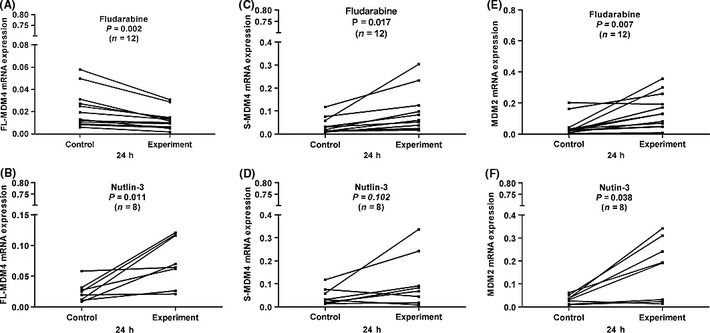
In the chronic lymphocytic leukemia (CLL) cells with normal p53 function, full‐length MDM4 (FL‐MDM4) expression was significantly decreased after 24 h incubation with fludarabine compared with the control (P = 0.002) (A), but increased after 24 h incubation with Nutin‐3 (P = 0.011) (B). A marked increase of splicing variant of MDM4 (S‐MDM4) was observed in CLL cells after 24 h treatment with fludarabine compared with the control (P = 0.017) (C), but was not observed with Nutin‐3 (P = 0.102) (D). MDM2 expressions were significantly increased after 24 h incubation with fludarabine and Nutin‐3 compared with the control (P = 0.007 and (P = 0.038) (E and F).
Discussion
Protein 53 is one of the most frequently mutated proteins in human tumors.19 In fact, approximately 50% of human cancers have aberrations in the p53 gene, resulting in inactivation or dysfunction of p53 protein.4, 20 It is reported that p53 mutations or deletions are observed in 10–15% of CLL patients.2 A deletion of 17p13 is usually correlated with a mutation of p53, and these diseases are aggressive and drug‐resistant.21, 22, 23, 24 The status of p53 is important in treatment selection for CLL patients. Many inhibitors take part in regulating p53 activation, such as MDM4 and its analogue MDM2. MDM4 inhibits transcriptional activities mediated by p53, such as cell‐cycle arrest and apoptosis.25, 26, 27, 28 Although MDM2 and MDM4 are oncogenes, they are crucial for development and are needed to regulate p53 function during development when expression is moderate.29 MDM2 gene overexpression has been found in CLL.30 Excess MDM2 and MDM4 expressions are detrimental to long‐term survival.29 It has been confirmed that the MDM4 protein is overexpressed in several human tumor cell lines 31, 32 and MDM4 gene is amplified in soft tissue sarcoma33 and breast carcinoma.34 This evidence suggests that the dysregulation of the MDM4 gene might contribute to tumor development or progression in human cancers.17, 35 MDM2 mediates p53 stability predominantly by degradation through its E3 ubiquitin ligase activity, which differs from MDM4. MDM2 also mediates MDM4 degradation. However, determining the exact mechanism resulting in MDM4 gene amplification or protein overexpression requires further study.
MDM4, besides FL‐MDM4, have seven transcript variants.36 S‐MDM4 and FL‐MDM4 were selected in the present study, because both contain p53 BD. S‐MDM4 is obtained from the deletion of exon 6, which produces a shift of the reading frame and results in an internal deletion of 68 bp.37 S‐MDM4 is a truncated protein containing only the p53 BD, and has no region to interact with MDM2, which protects S‐MDM4 from MDM2‐mediated degradation and makes S‐MDM4 more stable than FL‐MDM4.38 In addition to having a higher affinity than FL‐MDM4 for p53 and its increased nuclear localization, S‐MDM4 appears to be an evaluable inhibitor of p53.37, 39
An antagonizing function of MDM4 toward MDM2‐degradative activity is reported when the levels of overexpressed MDM4 exceed those of MDM2.26 That is, if the FL‐MDM4:MDM2 ratio is approximately 1:1, p53 undergoes MDM2‐mediated p53 degradation. However, when the levels of overexpressed FL‐MDM4 are higher, FL‐MDM4 inhibits MDM2‐mediated p53 degradation. Furthermore, the binding between MDM4 and MDM2 leads to the formation of a heterodimer, which possesses higher stability in comparison to the homodimer of each protein. However, MDM2 interacts with MDM4 through their ring finger domains, which are deleted in S‐MDM4.
Bo et al.40 report that FL‐MDM4 mRNA is overexpressed in CLL cells detected by qPCR. Transcript expression levels of MDM4 gene in “non‐responder” p53 wild‐type CLL samples were much higher than that in “responder” p53 wild‐type CLL samples (P = 0.004).40 In this study, 140 CLL patients were selected to detect expression levels of FL‐MDM4, S‐MDM4 and MDM2 by qPCR. The expression level of FL‐MDM4 and S‐MDM4 was elevated in CLL patients with p53 aberrations, while the level of MDM2 expression was not correlated with p53 status. FL‐MDM4 and S‐MDM4 overexpression is an indicator of p53 aberration in CLL patients, suggesting those patients might have a poorer prognosis than the patients with lower level expression.
In fact, MDM4 is a structural homologue of MDM2, which, like MDM2, is able to bind p53, preventing p53‐dependent transcription;17 as opposed to MDM2, however, interaction of MDM4 with p53 cannot be inhibited by Nutlin‐3 treatment.41 In this study, we treated primary CLL cells with fludarabine and Nutlin‐3 in vitro and analyzed the differences in FL‐MDM4, S‐MDM4 and MDM2 expression. In the primary CLL cells without p53 aberrations or with p53 normal function, the level of S‐MDM4 expression was elevated after 24 h incubation with fludarabine, but was not observed with Nutlin‐3. The level of MDM2 expression was increased after 24 h incubation with fludarabine and Nutlin‐3. However, in the primary CLL cells with p53 aberrations or p53 dysfunction, the levels of S‐MDM4 and MDM2 expressions were not significantly increased or decreased after fludarabine or Nutlin‐3 treatment. Therefore, it is conceivable that the patients with p53 aberrations did not respond to the in vitro treatment with fludarabine and Nutlin‐3.
The S‐MDM4 expression was increased after fludarabine treatment in CLL cells with normal gene type and function of p53, with no change after Nutlin‐3 treatment. It has been reported that S‐MDM4 affinity to p53 is approximately 10‐fold higher than that of FL‐MDM4.37, 39 Moreover, the overexpression of S‐MDM4 has no relation with that of FL‐MDM4.36 It has been reported that its overexpression is significantly correlated with an unfavorable prognosis in soft‐tissue sarcoma patients.33 To date, S‐MDM4 expression has not been reported in CLL. The results of the present study suggested that that S‐MDM4 is a more potent regulator to p53 transcriptional activity.
MDM2, an ubiquitin E3 ligase for p53, promotes p53 degradation in normal cells. After 24 h treatment with fludarabine in CLL cells, MDM2 expression was higher in the CLL cells with normal function of p53. Owing to p53 activation, DNA damage rapidly induces MDM2 expression. If DNA damage takes place over 12 h, high levels of MDM2 co‐exists with stabilized p53 in the cells, indicating that p53 degradation is no longer mediated by MDM2. In the meantime, DNA damage induces MDM2 phosphorylation on serine 395 by ATM,42 and phospho‐mimic mutations of the site lead to MDM2's inability to mediate p53 degradation or nuclear export.42, 43 It can be concluded that p53 degradation mediated by MDM2 is correlated with time, and p53 inhibited by MDM2 is transient. The present study indirectly demonstrates that MDM2 is not the real inhibitor of p53 when DNA damage exists.
Disclosure statement
The authors have no conflicts of interest to declare.
Supporting information
Table S1. The sequences of quantitative PCR primers of full‐length murine double minute 4 (MDM4), splicing variant of MDM4 and murine double minute 2 (MDM2).
Acknowledgments
This study was supported by the National Natural Science Foundation of China (30971296, 81170485, 81200360 and 81170488), the Natural Science Foundation of Jiangsu Province (BK2010584 and BK2012484), the Key Projects of the Health Department of Jiangsu Province (K201108), the Jiangsu Province's Medical Elite Program (RC2011169), the University Doctoral Foundation of the Ministry of Education of China (20093234110010), the Program for Development of Innovative Research Team in the First Affiliated Hospital of NJMU, the Project Funded by the Priority Academic Program Development of Jiangsu Higher Education Institutions, and the Project of the National Key Clinical Specialty.
(Cancer Sci 2012; 103: 2056–2063)
References
- 1. Dighiero G, Binet JL. When and how to treat chronic lymphocytic leukemia. N Engl J Med 2000; 343: 1799–801. [DOI] [PubMed] [Google Scholar]
- 2. Hillmen P. Using the biology of chronic lymphocytic leukemia to choose treatment. Hematology Am Soc Hematol Educ Program 2011; 2011: 104–9. [DOI] [PubMed] [Google Scholar]
- 3. Fridman JS, Lowe SW. Control of apoptosis by p53. Oncogene 2003; 22: 9030–40. [DOI] [PubMed] [Google Scholar]
- 4. Hainaut P, Hollstein M. p53 and human cancer: The first ten thousand mutations. Adv Cancer Res 2000; 77: 81–137. [DOI] [PubMed] [Google Scholar]
- 5. Vogelstein B, Lane D, Levine AJ. Surfing the p53 network. Nature 2000; 408: 307–10. [DOI] [PubMed] [Google Scholar]
- 6. Vousden KH, Lu X. Live or let die: The cell's response to p53. Nat Rev Cancer 2002; 2: 594–604. [DOI] [PubMed] [Google Scholar]
- 7. Shangary S, Wang S. Targeting the MDM2‐p53 interaction for cancer therapy. Clin Cancer Res 2008; 14: 5318–24. [DOI] [PMC free article] [PubMed] [Google Scholar]
- 8. Cheng Q, Chen J. Mechanism of p53 stabilization by ATM after DNA damage. Cell Cycle 2010; 9: 472–8. [DOI] [PMC free article] [PubMed] [Google Scholar]
- 9. Chen L, Gilkes DM, Pan Y, Lane WS, Chen J. ATM and Chk2‐dependent phosphorylation of MDMX contribute to p53 activation after DNA damage. EMBO J 2005; 24: 3411–22. [DOI] [PMC free article] [PubMed] [Google Scholar]
- 10. Hallek M, Cheson BD, Catovsky D et al Guidelines for the diagnosis and treatment of chronic lymphocytic leukemia: A report from the international workshop on chronic lymphocytic leukemia updating the National Cancer Institute‐working group 1996 guidelines. Blood 2008; 111: 5446–56. [DOI] [PMC free article] [PubMed] [Google Scholar]
- 11. Binet JL, Auquier A, Dighiero G et al A new prognostic classification of chronic lymphocytic leukemia derived from a multivariate survival analysis. Cancer 1981; 48: 198–206. [DOI] [PubMed] [Google Scholar]
- 12. Chen L, Zhang Y, Zheng W et al Distinctive IgVH gene segments usage and mutation status in Chinese patients with chronic lymphocytic leukemia. Leuk Res 2008; 32: 1491–8. [DOI] [PubMed] [Google Scholar]
- 13. Dong HJ, Zhou LT, Zhu DX et al The prognostic significance of TP53 mutations in Chinese patients with chronic lymphocytic leukemia is independent of del(17p13). Ann Hematol 2011; 90: 709–17. [DOI] [PubMed] [Google Scholar]
- 14. Xu W, Li JY, Wu YJ et al CD38 as a prognostic factor in Chinese patients with chronic lymphocytic leukaemia. Leuk Res 2009; 33: 237–43. [DOI] [PubMed] [Google Scholar]
- 15. Xu W, Li JY, Wu YJ et al Prognostic significance of ATM and TP53 deletions in Chinese patients with chronic lymphocytic leukemia. Leuk Res 2008; 32: 1071–7. [DOI] [PubMed] [Google Scholar]
- 16. Zenz T, Häbe S, Denzel T et al Detailed analysis of p53 pathway defects in fludarabine‐refractory chronic lymphocytic leukemia (CLL): Dissecting the contribution of 17p deletion, TP53 mutation, p53‐p21 dysfunction, and miR34a in a prospective clinical trial. Blood 2009; 114: 2589–97. [DOI] [PubMed] [Google Scholar]
- 17. Shvarts A, Bazuine M, Dekker P et al Isolation and identification of the human homolog of a new p53‐binding protein, Mdmx. Genomics 1997; 43: 34–42. [DOI] [PubMed] [Google Scholar]
- 18. Han X, Garcia‐Manero G, McDonnell TJ et al HDM4 (HDMX) is widely expressed in adult pre‐B acute lymphoblastic leukemia and is a potential therapeutic target. Mod Pathol 2007; 20: 54–62. [DOI] [PubMed] [Google Scholar]
- 19. Shangary S, Wang S. Small‐molecule inhibitors of the MDM2‐p53 protein–protein interaction to reactivate p53 function: A novel approach for cancer therapy. Annu Rev Pharmacol Toxicol 2009; 49: 223–41. [DOI] [PMC free article] [PubMed] [Google Scholar]
- 20. Feki A, Irminger‐Finger I. Mutational spectrum of p53 mutations in primary breast and ovarian tumors. Crit Rev Oncol Hematol 2004; 52: 103–16. [DOI] [PubMed] [Google Scholar]
- 21. Cordone I, Masi S, Mauro FR et al p53 expression in B‐cell chronic lymphocytic leukemia: A marker of disease progression and poor prognosis. Blood 1998; 91: 4342–9. [PubMed] [Google Scholar]
- 22. Johnston JB, Daeninck P, Verburg L et al p53, mdm‐2, bax and bcl‐2 and drug resistance in chronic lymphocytic leukemia. Leuk Lymphoma 1997; 26: 435–49. [DOI] [PubMed] [Google Scholar]
- 23. Christodoulopoulos G, Fotouhi N, Krajewski S, Reed JC, Alaoui‐Jamali M, Panasci L. Relationship between nitrogen mustard drug resistance in B‐cell chronic lymphocytic leukemia (B‐CLL) and protein expression of Bcl‐2, Bax, Bcl‐X and p53. Cancer Lett 1997; 121: 59–67. [DOI] [PubMed] [Google Scholar]
- 24. Döhner H, Stilgenbauer S, Benner A et al Genomic aberrations and survival in chronic lymphocytic leukemia. N Engl J Med 2000; 343: 1910–6. [DOI] [PubMed] [Google Scholar]
- 25. Marine JC, Francoz S, Maetens M, Wahl G, Toledo F, Lozano G. Keeping p53 in check: Essential and synergistic functions of Mdm2 and Mdm4. Cell Death Differ 2006; 13: 927–34. [DOI] [PubMed] [Google Scholar]
- 26. Marine JC, Jochemsen AG. Mdmx as an essential regulator of p53 activity. Biochem Biophys Res Commun 2005; 331: 750–60. [DOI] [PubMed] [Google Scholar]
- 27. Stad R, Little NA, Xirodimas DP et al Mdmx stabilizes p53 and Mdm2 via two distinct mechanisms. EMBO Rep 2001; 2: 1029–34. [DOI] [PMC free article] [PubMed] [Google Scholar]
- 28. Sharp DA, Kratowicz SA, Sank MJ, George DL. Stabilization of the MDM2 oncoprotein by interaction with the structurally related MDMX protein. J Biol Chem 1999; 274: 38189–96. [DOI] [PubMed] [Google Scholar]
- 29. Perry ME. The regulation of the p53‐mediated stress response by MDM2 and MDM4. Cold Spring Harb Perspect Biol 2010; 2: a000968. [DOI] [PMC free article] [PubMed] [Google Scholar]
- 30. Watanabe T, Hotta T, Ichikawa A et al The MDM2 oncogene overexpression in chronic lymphocytic leukemia and low‐grade lymphoma of B‐cell origin. Blood 1994; 84: 3158–65. [PubMed] [Google Scholar]
- 31. Ramos YF, Stad R, Attema J, Peltenburg LT, van der Eb AJ, Jochemsen AG. Aberrant expression of HDMX proteins in tumor cells correlates with wild‐type p53. Cancer Res 2001; 61: 1839–42. [PubMed] [Google Scholar]
- 32. Stad R, Ramos YF, Little N et al Hdmx stabilizes Mdm2 and p53. J Biol Chem 2000; 275: 28039–44. [DOI] [PubMed] [Google Scholar]
- 33. Bartel F, Schulz J, Böhnke A et al Significance of HDMX‐S (or MDM4) mRNA splice variant overexpression and HDMX gene amplification on primary soft tissue sarcoma prognosis. Int J Cancer 2005; 117: 469–75. [DOI] [PubMed] [Google Scholar]
- 34. Danovi D, Meulmeester E, Pasini D et al Amplification of Mdmx (or Mdm4) directly contributes to tumor formation by inhibiting p53 tumor suppressor activity. Mol Cell Biol 2004; 24: 5835–43. [DOI] [PMC free article] [PubMed] [Google Scholar]
- 35. Liang M, Han X, Vadhan‐Raj S et al HDM4 is overexpressed in mantle cell lymphoma and its inhibition induces p21 expression and apoptosis. Mod Pathol 2010; 23: 381–91. [DOI] [PubMed] [Google Scholar]
- 36. Mancini F, Di Conza G, Moretti F. MDM4 (MDMX) and its transcript variants. Curr Genomics 2009; 10: 42–50. [DOI] [PMC free article] [PubMed] [Google Scholar]
- 37. Rallapalli R, Strachan G, Cho B, Mercer WE, Hall DJ. A novel MDMX transcript expressed in a variety of transformed cell lines encodes a truncated protein with potent p53 repressive activity. J Biol Chem 1999; 274: 8299–308. [DOI] [PubMed] [Google Scholar]
- 38. Marine JC, Dyer MA, Jochemsen AG. MDMX: From bench to bedside. J Cell Sci 2007; 120: 371–8. [DOI] [PubMed] [Google Scholar]
- 39. Rallapalli R, Strachan G, Tuan RS, Hall DJ. Identification of a domain within MDMX‐S that is responsible for its high affinity interaction with p53 and high‐level expression in mammalian cells. J Cell Biochem 2003; 89: 563–75. [DOI] [PubMed] [Google Scholar]
- 40. Bo MD, Secchiero P, Degan M et al MDM4 (MDMX) is overexpressed in chronic lymphocytic leukaemia (CLL) and marks a subset of p53wild‐type CLL with a poor cytotoxic response to Nutlin‐3. Br J Haematol 2010; 150: 237–9. [DOI] [PubMed] [Google Scholar]
- 41. Patton JT, Mayo LD, Singhi AD, Gudkov AV, Stark GR, Jackson MW. Levels of HdmX expression dictate the sensitivity of normal and transformed cells to Nutlin‐3. Cancer Res 2006; 66: 3169–76. [DOI] [PubMed] [Google Scholar]
- 42. Maya R, Balass M, Kim ST et al ATM‐dependent phosphorylation of Mdm2 on serine 395: Role in p53 activation by DNA damage. Genes Dev 2001; 15: 1067–77. [DOI] [PMC free article] [PubMed] [Google Scholar]
- 43. Goldberg Z, Vogt Sionov R, Berger M et al Tyrosine phosphorylation of Mdm2 by c‐Abl: implications for p53 regulation. EMBO J 2002; 21: 3715–27. [DOI] [PMC free article] [PubMed] [Google Scholar]
Associated Data
This section collects any data citations, data availability statements, or supplementary materials included in this article.
Supplementary Materials
Table S1. The sequences of quantitative PCR primers of full‐length murine double minute 4 (MDM4), splicing variant of MDM4 and murine double minute 2 (MDM2).