

Abstract
The acetaldehyde associated with alcoholic beverages is an evident carcinogen for the esophagus. Genetic polymorphisms of the alcohol dehydrogenase 1B (ADH1B) and aldehyde dehydrogenase 2 (ALDH2) genes are associated with the risk of esophageal cancer. However, the exact mechanism via which these genetic polymorphisms affect esophageal carcinogenesis has not been elucidated. ADH1B*2 is involved in overproduction of acetaldehyde due to increased ethanol metabolism into acetaldehyde, and ALDH2*2 is involved in accumulation of acetaldehyde due to the deficiency of acetaldehyde metabolism. Acetaldehyde can interact with DNA and form DNA adducts, resulting in DNA damage. N 2‐ethylidene‐2′‐deoxyguanosine (N 2‐ethylidene‐dG) is the most abundant DNA adduct derived from acetaldehyde. Therefore, we quantified N 2‐ethylidene‐dG levels in blood samples from 66 Japanese alcoholic patients using liquid chromatography/electrospray tandem mass spectrometry, and investigated the relationship between N 2‐ethylidene‐dG levels and ADH1B and ALDH2 genotypes. The median N 2‐ethylidene‐dG levels (25th percentile, 75th percentile) in patients with ADH1B*1/*1 plus ALDH2*1/*1, ADH1B*2 carrier plus ALDH2*1/*1, ADH1B*1/*1 plus ALDH2*1/*2, and ADH1B*2 carrier plus ALDH2*1/*2 were 2.14 (0.97, 2.37)/107 bases, 2.38 (1.18, 2.98)/107 bases, 5.38 (3.19, 6.52)/107 bases, and 21.04 (12.75, 34.80)/107 bases, respectively. In the ALDH2*1/*2 group, N 2‐ethylidene‐dG levels were significantly higher in ADH1B*2 carriers than in the ADH1B*1/*1 group (P < 0.01). N 2‐ethylidene‐dG levels were significantly higher in the ALDH2*1/*2 group than in the ALDH2*1/*1 group, regardless of ADH1B genotype (ADH1B*1/*1, P < 0.05; ADH1B*2 carriers, P < 0.01) N 2‐ethylidene‐dG levels in blood DNA of the alcoholics was remarkably higher in individuals with a combination of the ADH1B*2 and ALDH2*2 alleles. These results provide a new perspective on the carcinogenicity of the acetaldehyde associated with alcoholic beverages, from the aspect of DNA damage.
Esophageal squamous cell carcinoma (SCC) occurs 3.7–9.5 times more frequently in East‐Asian countries, such as Japan, China, Taiwan, and Korea, than in Western countries.1 Alcohol consumption is a well‐established risk factor for esophageal SCC; moreover, in October 2009, the International Agency for Research on Cancer certified that the acetaldehyde associated with alcoholic beverages is an evident carcinogen for the head and neck region and for the esophagus.2 However, the carcinogenic mechanism of acetaldehyde in these regions remains unclear.
Orally ingested ethanol is metabolized to acetaldehyde mainly by alcohol dehydrogenase 1B (ADH1B) and alcohol dehydrogenase 1C (ADH1C) in the liver. Subsequently, acetaldehyde is metabolized to acetate by aldehyde dehydrogenase 2 (ALDH2) in the liver. The ADH1B and ALDH2 genes contain single‐nucleotide polymorphisms (SNPs) that modulate the enzymatic activity of their protein products. The variant ADH1B*2 increases ethanol metabolism to produce acetaldehyde by 40 times because of an amino acid substitution of histidine for arginine at position 47 of the protein. The variant ALDH2*2 is deficient in the activity of acetaldehyde catabolism because of an amino acid substitution of lysine for glutamine at position 487. These variants are thought to play protective roles against alcoholism because of the unpleasant flushing response associated with acetaldehydemia after drinking.3
In East‐Asian countries, ADH1B*2 and ALDH2*2 are prevalent genotypes found in approximately 90% and 50% of these populations, respectively.4 Despite the protection against alcohol intake afforded by these genotypes, continuous alcohol consumption by these individuals leads to increased exposure to carcinogenic acetaldehyde. Therefore, this genetic background is considered a cause of the high incidence of esophageal SCC in East Asia.
Acetaldehyde is a highly reactive electrophile that can interact with DNA to form DNA adducts, such as N 2‐ethyl‐2′‐deoxyguanosine (N 2‐Et‐dG),5, 6 α‐S‐ and α‐R‐methyl‐γ‐hydroxy‐1, N 2‐propano‐2′‐deoxyguanosine (α‐S‐Me‐γ‐OH‐PdG and α‐R‐Me‐γ‐OH‐PdG),7, 8 and N 2‐ethylidene‐2′‐deoxyguanosine (N 2‐ethylidene‐dG).7 N 2‐Et‐dG blocks DNA synthesis and induces DNA mutation.9, 10, 11 α‐S‐Me‐γ‐OH‐PdG and α‐R‐Me‐γ‐OH‐PdG induce DNA‐protein or DNA–DNA cross‐links and induce DNA mutation.12 We reported previously that the levels of the N 2‐Et‐dG, α‐S‐Me‐γ‐OH‐PdG, and α‐R‐Me‐γ‐OH‐PdG adducts were significantly higher in the leukocytes of ALDH2‐deficient Japanese alcoholics.13
Although N 2‐ethylidene‐dG was the most abundant of the DNA adducts derived from acetaldehyde,14 it was unstable at the nucleoside level and difficult to measure.7 Wang et al.7 established a system to quantify N 2‐ethylidene‐dG by adding NaBH3CN, a strong reducing agent that converts N 2‐ethylidene‐dG to the stable N 2‐Et‐dG. Since then, the quantification of N 2‐ethylidene‐dG has become possible.14, 15, 16, 17, 18, 19, 20
We reported previously that N 2‐ethylidene‐dG levels were significantly higher in the liver and stomach of ALDH2‐deficient mice after oral ethanol ingestion.14, 20 In humans, N 2‐ethylidene‐dG was detected in liver and lung DNA samples15, 18 and N 2‐ethylidene‐dG levels were significantly higher in the blood DNA of drinkers17 and significantly lower in the leukocyte DNA of smokers after smoking cessation.16 However, the relationship between N 2‐ethylidene‐dG levels and SNPs of the ADH1B and ALDH2 genes has not been examined in humans.
N 2‐ethylidene‐dG is produced from deoxyguanosine and acetaldehyde. Acetaldehyde is ubiquitous in the environment21 and alcoholic beverages and cigarettes are major sources of acetaldehyde for humans. In particular, alcohol consumption may be the most important route of acetaldehyde exposure in humans, as typical alcohol beverages contain over 10 g of ethanol/glass, much of which may be metabolized to acetaldehyde, whereas the level of acetaldehyde in cigarette smoke ranges from 0.6 to 2.1 mg/cigarette.22 N 2‐ethylidene‐dG levels in the blood of drinkers were 5270 ± 8770 fmol/μmol dG,17 which was several times higher than that observed in the smokers who drink only occasionally or not all (1310 ± 1720 fmol/μmol dG).16 Therefore, N 2‐ethylidene‐dG could become a good biomarker of acetaldehyde exposure associated with alcohol beverages.
In this study, we quantified N 2‐ethylidene‐dG levels in the leukocytes of Japanese alcoholics, as a biomarker of acetaldehyde‐derived DNA damage, and investigated the relationship between N 2‐ethylidene‐dG levels and SNPs of the ADH1B and ALDH2 genes.
Materials and Methods
Patients and ADH1B and ALDH2 genotypes
The participants in this study were 66 Japanese intoxicated alcoholic men who came to the Kurihama Alcoholism Center of the National Hospital Organization. This study was approved by the Ethics Committee of Kurihama Alcoholism Center for the National Hospital Organization and informed consent was obtained from all participating patients. Information regarding drinking profiles and smoking habits was obtained from the patients, as described previously.23 Blood samples were obtained from patients on the day of admission for alcoholism treatment. ADH1B and ALDH2 genotyping was performed on blood DNA using PCR/RFLP, as described previously.24, 25
Isolation of DNA
DNA was isolated from 1 mL of whole blood using the QIAamp DNA Blood Midi Kit (Qiagen, Hilden, Germany). The procedure was performed according to the manufacturer's instructions, with the exception of the addition of NaBH3CN to all solutions (final concentration, 100 mM). After the purification step, DNA was dissolved in distilled water.
DNA adduct standard and its stable isotope
N 2‐Et‐dG and [U‐15N5]‐labeled N 2‐Et‐dG were synthesized as described previously.6
DNA digestion
DNA samples (10–15 μg) were digested to their corresponding 2′‐deoxyribonucleoside‐3′‐monophosphates via the addition of 15 μL of 17 mM sodium succinate and 8 mM CaCl2 buffer (pH 6.0) containing micrococcal nuclease (22.5 U) and spleen phosphodiesterase (0.075 U), and [U‐15N5]‐labeled N 2‐Et‐dG. Solutions were mixed and incubated for 3 h at 37°C, followed by the addition of alkaline phosphatase (1 U), 10 μL of 0.5 M Tris–HCl (pH 8.5), 5 μL of 20 mM ZnSO4, and 67 μL of distilled water and incubation of solutions for an additional 3 h at 37°C. The mixture was evaporated to 10–20 μL and 100 μL of methanol was added to precipitate proteins. After centrifugation, the methanol fraction (supernatant) was transferred to a new Eppendorf tube. The precipitate was re‐extracted using 100 μL of methanol and the methanol fraction was collected into the Eppendorf tube. This methanol solution was evaporated to dryness, resuspended in 50 μL of distilled water, and subjected to liquid chromatography/electrospray tandem mass spectrometry (LC/MS/MS).
Instrumentation
Liquid chromatography/electrospray tandem mass spectrometry analyses were performed using a Shimadzu LC system (Shimadzu, Kyoto, Japan) interfaced with a Quattro Ultima triple‐stage quadrupole MS (Waters/Micromass, Manchester, UK). The LC column was eluted over a gradient that began at a ratio of 5% methanol to 95% water and was changed to 40% methanol over a period of 30 min, to 80% methanol from 30 to 35 min, and finally returned to the original starting conditions (5:95) for the remaining 11 min. The total run time was 46 min. Sample injection volumes of 20 μL each were separated on a Shim‐pack XR‐ODS column (3.0 × 75 mm, 2.2 μm; Shimadzu) and eluted at a flow rate of 0.2 mL/min. Mass spectral analyses were performed in a positive ion mode using nitrogen as the nebulizing gas. The temperature of the ion source was 130°C, the temperature of the desolvation gas was 380°C, and the cone voltage was operated at a constant 35 V. Nitrogen was also used as the desolvation gas (700 L/h) and cone gas (35 L/h), and argon was used as the collision gas, at a collision cell pressure of 1.5 × 10⁻³ mbar. Positive ions were acquired in multiple‐reaction monitoring mode. The multiple‐reaction monitoring transitions monitored were as follows: [15N5]‐N 2‐Et‐dG, m/z 301 → 185 and N 2‐Et‐dG, m/z 296 → 180. The amount of N 2‐Et‐dG was quantified using the ratio of the peak area of N 2‐Et‐dG to that of [U‐15N5]‐labeled N 2‐Et‐dG. The QuanLynx software (version 4.0; Waters/Micromass) was used to create a standard curve and to calculate the concentration of N 2‐Et‐dG. The amount of deoxyguanosine was monitored using a Shimadzu SPD‐10A UV–Visible detector that was set in place before the tandem MS.
Statistical analyses
Statistical analyses were performed using SPSS statistics software (version 17; SPSS Inc., Chicago, IL, USA). Values were expressed as means and standard deviations or medians plus 25th and 75th percentiles (Q1, Q3). Analysis of variance (anova) and the Kruskal–Wallis test were used to compare normally distributed data and non‐normally distributed data, respectively, among the groups with different ADH1B and ALDH2 genotype combinations; in addition, post hoc paired comparisons were performed using Tukey's method for anova and Holm's method for the Kruskal–Wallis test.23 Because N 2‐ethylidene‐dG levels were not normally distributed, the Mann–Whitney test was used to compare N 2‐ethylidene‐dG levels among genotype groups. Holm's method was used to adjust the P‐values for multiplicity.23 An adjusted P‐value < 0.05 was considered significant.
Results
Clinical characteristics
Table 1 lists the patients' characteristics. There were 50 patients in the ALDH2*1/*1 group, 16 patients in the ALDH2*1/*2 group, and no patients in the ALDH2*2/*2 group. Among the 50 patients with the ALDH2*1/*1 genotype, 13 patients were homozygous for ADH1B*1 (ADH1B*1/*1 + ALDH2*1/*1; Group 1) and 37 patients were ADH1B*2 carriers (ADH1B*1/*2, 14; ADH1B*2/*2, 23) (ADH1B*2 carriers + ALDH2*1/*1; Group 2). Among the 16 patients with the ALDH2*1/*2 genotype, eight patients were homozygous for ADH1B*1 (ADH1B*1/*1 + ALDH2*1/*2; Group 3) and eight patients were ADH1B*2 carriers (ADH1B*1/*2, 4; ADH1B*2/*2, 4) (ADH1B*2 carriers + ALDH2*1/*2; Group 4).
Table 1.
Relationship between clinical characteristics and genotypes of ADH1B and ALDH2 (n = 66)
| Group 1 (n = 13) | Group 2 (n = 37) | Group 3 (n = 8) | Group 4 (n = 8) | P‐value | |
|---|---|---|---|---|---|
| ADH1B | *1/*1 | *1/*2 + *2/*2 | *1/*1 | *1/*2 + *2/*2 | – |
| ALDH2 | *1/*1 | *1/*1 | *1/*2 | *1/*2 | – |
| Age (years) | 50.0 (40.0, 57.0) | 56.0 (43.0, 63.0) | 55.0 (44.0, 57.0) | 54.0 (50.5, 63.5) | 0.557 |
| Height (cm) | 167.9 ± 5.6 | 166.0 ± 6.2 | 168.8 ± 7.0 | 169.1 ± 5.0 | 0.409 |
| Weight (kg) | 66.9 ± 16.2a | 57.3 ± 7.7a | 58.8 ± 10.1 | 59.8 ± 9.3 | 0.050 |
| Amount of ethanol consumed in the previous 24 h (mL) | 120 (110, 180) | 100 (80, 160) | 120 (105, 140) | 150 (95, 205) | 0.364 |
| Interval from the last drink (h) | 12.0 (8.0, 14.0) | 13.0 (10.0, 24.0) | 9.5 (8.0, 14.0) | 10.5 (7.5, 14.0) | 0.285 |
| Number of cigarettes smoked in the previous 24 h (pieces) | 20.8 ± 10.2 | 15.6 ± 13.3 | 20.6 ± 12.1 | 20.6 ± 10.2 | 0.430 |
P < 0.05 for pairwise comparisons adjusted for multiplicity. Values are means ± standard deviation (SD) or medians (25th percentile, 75th percentile); P‐values are for homogeneity among the four groups based on analysis of variance (anova) and the Kruskal–Wallis test, respectively. ADH1B, alcohol dehydrogenase 1B; ALDH2, aldehyde dehydrogenase 2.
In the ALDH2*1/*1 group, the mean body weight was significantly lower in Group 2 than in Group 1 (P < 0.05), whereas no such difference was observed in the ALDH2*1/*2 group. There were no significant differences among the four groups regarding age, height, amount of alcohol consumed in the previous 24 h, interval from the last drink, and number of cigarettes smoked during the previous 24 h.
Level of the N 2‐ethylidene‐dG adduct and combinations of ADH1B and ALDH2 genotypes
N 2‐ethylidene‐dG was converted to N 2‐Et‐dG by adding NaBH3CN during the DNA isolation step and the amount of N 2‐Et‐dG was measured. Because the amount of N 2‐Et‐dG is, by far, lower than that of N 2‐ethylidene‐dG in the human body,15 the measured N 2‐Et‐dG level was considered as a surrogate marker of the N 2‐ethylidene‐dG adduct (Fig. 1).
Figure 1.
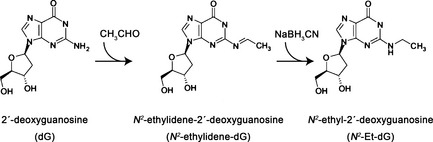
Formation of acetaldehyde‐derived DNA adducts. Acetaldehyde binds to deoxyguanosine (dG) and forms the unstable DNA adduct, N 2‐ethylidene‐2′‐deoxyguanosine (N 2‐ethylidene‐dG). After addition of NaBH3CN, N 2‐ethylidene‐dG is converted to the stable adduct, N 2‐ethyl‐2′‐deoxyguanosine (N 2‐Et‐dG).
The median N 2‐ethylidene‐dG levels (Q1, Q3) were 2.14 (0.97, 2.37)/107 bases in Group 1, 2.38 (1.18, 2.98)/107 bases in Group 2, 5.38 (3.19, 6.52)/107 bases in Group 3, and 21.04 (12.75, 34.80)/107 bases in Group 4 (Fig. 2).
Figure 2.
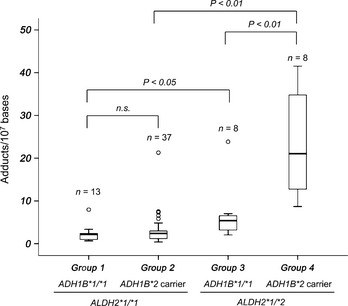
N 2‐ethylidene‐2′‐deoxyguanosine (N 2‐ethylidene‐dG) levels according to combinations of the ADH1B and ALDH2 genotypes. N 2‐ethylidene‐dG levels were significantly higher in the blood DNA of alcoholics with the combination of ADH1B*2 and ALDH2*1/*2 compared with alcoholics with the combination of ADH1B*1/*1 and ALDH2*1/*2 (P < 0.01). N 2‐ethylidene‐dG levels were significantly higher in the blood DNA of alcoholics with ALDH2*1/*2 compared with those with ALDH2*1/*1, regardless of ADH1B genotype (ADH1B*1/*1, P < 0.05; ADH1B*2 carriers, P < 0.01). Boxes represent 25th to 75th percentile values (interquartile range [IQR]). The band in the box represents the median. Outer lines represent the highest datum below 1.5 IQR above the 75th percentile and the lowest datum above 1.5 IQR below the 25th percentile. Small circles represent outliers. The Mann–Whitney test was used to compare N 2‐ethylidene‐dG levels among genotype groups. Holm's method was used to adjust the P‐values for multiplicity.
There was no significant difference in N 2‐ethylidene‐dG levels between Group 1 and Group 2. On the other hand, N 2‐ethylidene‐dG levels were significantly higher in Group 4 than in Group 3 (P < 0.01).
N 2‐ethylidene‐dG levels were significantly higher in the ALDH2*1/*2 group than in the ALDH2*1/*1 group, regardless of ADH1B genotype (ADH1B*1/*1, P < 0.05; ADH1B*2 carrier, P < 0.01).
Discussion
This study demonstrated for the first time the relationship between the levels of N 2‐ethylidene‐dG and ADH1B and ALDH2 genotypes in human samples. We found that the level of N 2‐ethylidene‐dG in the DNA of leukocytes from alcoholics was remarkably elevated in individuals with a combination of ADH1B*2 and ALDH2*2 alleles.
It was reported that N 2‐ethylidene‐dG was unstable.7 In our in vitro experiments in which HL‐60 cells (human promyelocytic leukemia cells) were cultured with acetaldehyde contained in medium, the half‐life of this adduct was approximately 35 h (Kimiko Hori, Shin'ichiro Miyamoto, Yoshiyuki Yukawa, Manabu Muto, Tsutomu Chiba and Tomonari Matsuda, unpublished data, 2012). However, the levels of N 2‐ethylidene‐dG in the leukocytes of alcoholics, as assessed in this study, were more abundant than those of N 2‐Et‐dG (ALDH2*1/*1, 0.04 ± 0.03/107 bases; ALDH2*1/*2, 0.28 ± 0.11/107 bases), α‐S‐Me‐γ‐OH‐PdG (ALDH2*1/*1, 0.09 ± 0.01/107 bases; ALDH2*1/*2, 0.20 ± 0.03/107 bases), and α‐R‐Me‐γ‐OH‐PdG (ALDH2*1/*1, 0.13 ± 0.01/107 bases; ALDH2*1/*2, 0.25 ± 0.03/107 bases) in leukocytes from similar populations reported previously.13 Therefore, N 2‐ethylidene‐dG should be a sensitive biomarker of acetaldehyde exposure. Although the mutagenicity of this adduct remains undetermined, the fact that N 2‐ethylidene‐dG is converted to N 2‐Et‐dG, α‐S‐Me‐γ‐OH‐PdG and α‐R‐Me‐γ‐OH‐PdG, which are more stable and mutagenic7, 8, 9, 10, 11, 12, 26 also shows the biological significance of N 2‐ethylidene‐dG.
Yokoyama et al. 23 reported an absence of differences in blood acetaldehyde concentration between ALDH2*1/*2 intoxicated alcoholics carrying the ADH1B*1/*1 and ADH1B*2 alleles, whereas the slope of the increase in blood acetaldehyde concentration according to increasing concentration of blood ethanol levels was significantly steeper in ADH1B*2 carriers with ALDH2*1/*2 than in other combinations of ADH1B and ALDH2 genotypes. Other investigators also reported that the combination of ADH1B*2 and ALDH2*1/*2 evoked the most intense alcohol flushing response, which was associated with an acetaldehydemia reaction.3, 27 Therefore, the present data could be interpreted as indicating that the exposure to increased levels of acetaldehyde increases the amount of acetaldehyde‐derived DNA adducts, especially in individuals with a combination of the ADH1B*2 and ALDH2*2 alleles.
In the present study, we measured DNA adducts quantitatively in the leukocytes of Japanese alcoholics and showed that the levels of N 2‐ethylidene‐dG in individuals with ALDH2*1/*2 were higher than those detected in individuals with ALDH2*1/*1. Furthermore, individuals with a combined genotype of ADH1B*2 and ALDH2*1/*2 exhibited the highest levels of N 2‐ethylidene‐dG. Recently, Weng et al. reported that DNA damage (as assessed using an alkaline comet assay) was significantly increased in elderly habitual drinkers with the ALDH2*2 allele. Furthermore, habitual drinkers with a combined genotype of ADH1B*2/*2 and ALDH2*1/*2 displayed significantly higher levels of DNA damage.28 These results are concordant with the present data. Thus, these results indicate that acetaldehyde‐induced DNA damage is closely associated with the combination of ADH1B*2 and ALDH2*1/*2.
If acetaldehyde‐derived DNA adducts are associated with esophageal carcinogenesis, the risk of disease would be highest among the subjects carrying ADH1B*2 plus ALDH2*1/*2. However, a recent meta‐analysis showed that ADH1B*1/*1 plus ALDH2*1/*2 was associated with the highest risk of esophageal cancer among heavy drinkers (odds ratio, 12.45; 95% CI, 2.9–53.46) compared with carriers of ADH1B*2 plus ALDH2*1/*1.29 In individuals with ALDH2*1/*2, this risk was higher in ADH1B*1/*1 compared with ADH1B*2 carriers. These results suggest that N 2‐ethylidene‐dG adduct levels in leukocytes may not be an adequate biomarker of the risk of esophageal cancer. In addition to the acetaldehyde that circulates systemically, which is produced in the liver from orally ingested ethanol, acetaldehyde produced locally by ADH730, 31 and CYP2E132 in the mucosa of the upper aerodigestive tract and by ADHs of oral microbes33, 34, 35 has been considered to play an important role in the carcinogenicity of the upper aerodigestive tract. Thus, the relationship between locally produced acetaldehyde‐derived DNA damage and the risk of esophageal cancer warrants investigation.
Regarding ADH1B, the ADH1B*1 allele increases the risk of cancer in the esophagus29, 36 and in the head and neck region;36 conversely, Kanda et al. reported that ADH1B*2/*2 increases the risk of pancreatic cancer in heavy drinkers and that the combination of the ADH1B*2/*2 and ALDH2*2 alleles is associated with the highest carcinogenic risk.37 Therefore, the carcinogenic risk associated with the ADH1B genotype may exhibit opposite trends in different organs. In contrast, the relationship between the ALDH2*2 allele and increased carcinogenic risk has been reported in a variety of organs (e.g., esophagus,29, 36 head and neck region,36 stomach, lung,38 and pancreas39), whereas there are no reports of the association of ALDH2*1/*1 with elevated carcinogenic risk. Thus, the carcinogenetic effect of ALDH2*1/*2 is apparent. In this study, N 2‐ethylidene‐dG levels in individuals with ALDH2*1/*2 were significantly higher than those detected in individuals with ALDH2*1/*1, regardless of ADH1B genotype.
In conclusion, the combination of ADH1B*2 and ALDH2*1/*2 strongly enhanced DNA damage in the leukocytes of alcoholics. Although further investigations are needed to clarify the involvement of exposure to acetaldehyde in the mechanism of esophageal carcinogenesis associated with alcohol drinking, the results of this study are expected to provide a new perspective on the carcinogenicity of the acetaldehyde associated with alcoholic beverages, from the aspect of DNA damage.
Disclosure statement
The authors have no conflict of interest.
Acknowledgments
This work was supported in part by management expenses grants from the Government of Japan to the National Cancer Center (grant number 101106).
(Cancer Sci, 2012; 103: 1651–1655)
References
- 1. Hongo M, Nagasaki Y, Shoji T. Epidemiology of esophageal cancer: Orient to Occident. Effects of chronology, geography and ethnicity. J Gastroenterol Hepatol 2009; 24: 729–35. [DOI] [PubMed] [Google Scholar]
- 2. Secretan B, Straif K, Baan R et al A review of human carcinogens—Part E: tobacco, areca nut, alcohol, coal smoke, and salted fish. Lancet Oncol 2009; 10: 1033–4. [DOI] [PubMed] [Google Scholar]
- 3. Matsuo K, Wakai K, Hirose K, Ito H, Saito T, Tajima K. Alcohol dehydrogenase 2 His47Arg polymorphism influences drinking habit independently of aldehyde dehydrogenase 2 Glu487Lys polymorphism: analysis of 2,299 Japanese subjects. Cancer Epidemiol Biomarkers Prev 2006; 15: 1009–13. [DOI] [PubMed] [Google Scholar]
- 4. Higuchi S, Matsushita S, Murayama M, Takagi S, Hayashida M. Alcohol and aldehyde dehydrogenase polymorphisms and the risk for alcoholism. Am J Psychiatry 1995; 152: 1219–21. [DOI] [PubMed] [Google Scholar]
- 5. Fang JL, Vaca CE. Development of a 32P‐postlabelling method for the analysis of adducts arising through the reaction of acetaldehyde with 2′‐deoxyguanosine‐3′‐monophosphate and DNA. Carcinogenesis 1995; 16: 2177–85. [DOI] [PubMed] [Google Scholar]
- 6. Fang JL, Vaca CE. Detection of DNA adducts of acetaldehyde in peripheral white blood cells of alcohol abusers. Carcinogenesis 1997; 18: 627–32. [DOI] [PubMed] [Google Scholar]
- 7. Wang M, McIntee EJ, Cheng G, Shi Y, Villalta PW, Hecht SS. Identification of DNA adducts of acetaldehyde. Chem Res Toxicol 2000; 13: 1149–57. [DOI] [PubMed] [Google Scholar]
- 8. Hecht SS, McIntee EJ, Wang M. New DNA adducts of crotonaldehyde and acetaldehyde. Toxicology 2001; 166: 31–6. [DOI] [PubMed] [Google Scholar]
- 9. Terashima I, Matsuda T, Fang TW et al Miscoding potential of the N 2‐ethyl‐2′‐deoxyguanosine DNA adduct by the exonuclease‐free Klenow fragment of Escherichia coli DNA polymerase I. Biochemistry 2001; 40: 4106–14. [DOI] [PubMed] [Google Scholar]
- 10. Matsuda T, Terashima I, Matsumoto Y, Yabushita H, Matsui S, Shibutani S. Effective utilization of N 2‐ethyl‐2′‐deoxyguanosine triphosphate during DNA synthesis catalyzed by mammalian replicative DNA polymerases. Biochemistry 1999; 38: 929–35. [DOI] [PubMed] [Google Scholar]
- 11. Upton DC, Wang X, Blans P, Perrino FW, Fishbein JC, Akman SA. Replication of N 2‐ethyldeoxyguanosine DNA adducts in the human embryonic kidney cell line 293. Chem Res Toxicol 2006; 19: 960–7. [DOI] [PubMed] [Google Scholar]
- 12. Brooks PJ, Theruvathu JA. DNA adducts from acetaldehyde: implications for alcohol‐related carcinogenesis. Alcohol 2005; 35: 187–93. [DOI] [PubMed] [Google Scholar]
- 13. Matsuda T, Yabushita H, Kanaly RA, Shibutani S, Yokoyama A. Increased DNA damage in ALDH2‐deficient alcoholics. Chem Res Toxicol 2006; 19: 1374–8. [DOI] [PubMed] [Google Scholar]
- 14. Matsuda T, Matsumoto A, Uchida M et al Increased formation of hepatic N 2‐ethylidene‐2′‐deoxyguanosine DNA adducts in aldehyde dehydrogenase 2‐knockout mice treated with ethanol. Carcinogenesis 2007; 28: 2363–6. [DOI] [PubMed] [Google Scholar]
- 15. Wang M, Yu N, Chen L, Villalta PW, Hochalter JB, Hecht SS. Identification of an acetaldehyde adduct in human liver DNA and quantitation as N 2‐ethyldeoxyguanosine. Chem Res Toxicol 2006; 19: 319–24. [DOI] [PMC free article] [PubMed] [Google Scholar]
- 16. Chen L, Wang M, Villalta PW et al Quantitation of an acetaldehyde adduct in human leukocyte DNA and the effect of smoking cessation. Chem Res Toxicol 2007; 20: 108–13. [DOI] [PMC free article] [PubMed] [Google Scholar]
- 17. Balbo S, Hashibe M, Gundy S et al N 2‐ethyldeoxyguanosine as a potential biomarker for assessing effects of alcohol consumption on DNA. Cancer Epidemiol Biomarkers Prev 2008; 17: 3026–32. [DOI] [PubMed] [Google Scholar]
- 18. Singh R, Sandhu J, Kaur B et al Evaluation of the DNA damaging potential of cannabis cigarette smoke by the determination of acetaldehyde derived N 2‐ethyl‐2′‐deoxyguanosine adducts. Chem Res Toxicol 2009; 22: 1181–8. [DOI] [PubMed] [Google Scholar]
- 19. Hecht SS, Seow A, Wang M et al Elevated levels of volatile organic carcinogen and toxicant biomarkers in Chinese women who regularly cook at home. Cancer Epidemiol Biomarkers Prev 2010; 19: 1185–92. [DOI] [PMC free article] [PubMed] [Google Scholar]
- 20. Nagayoshi H, Matsumoto A, Nishi R, Kawamoto T, Ichiba M, Matsuda T. Increased formation of gastric N 2‐ethylidene‐2′‐deoxyguanosine DNA adducts in aldehyde dehydrogenase‐2 knockout mice treated with ethanol. Mutat Res 2009; 673: 74–7. [DOI] [PubMed] [Google Scholar]
- 21. IARC . Monographs on the Evaluation of Carcinogenic Risks to Humans: Re‐evaluation of Some Organic Chemicals, Hydrazine and Hydrogen Peroxide, Vol. 71. Lyon, France: International Agency for Research on Cancer, 2009; 319–35. [PMC free article] [PubMed] [Google Scholar]
- 22. IARC . Monographs on the Evaluation of Carcinogenic Risks to Humans: Tobacco Smoke and Involuntary Smoking, Vol. 83. Lyon, France: International Agency for Research on Cancer, 2004; 51–119. [PMC free article] [PubMed] [Google Scholar]
- 23. Yokoyama A, Tsutsumi E, Imazeki H, Suwa Y, Nakamura C, Yokoyama T. Polymorphisms of alcohol dehydrogenase‐1B and aldehyde dehydrogenase‐2 and the blood and salivary ethanol and acetaldehyde concentrations of Japanese alcoholic men. Alcohol Clin Exp Res 2010; 34: 1246–56. [DOI] [PubMed] [Google Scholar]
- 24. Harada S, Zhang S. New strategy for detection of ALDH2 mutant. Alcohol Alcohol Suppl 1993; 1A: 11–3. [DOI] [PubMed] [Google Scholar]
- 25. Xu YL, Carr LG, Bosron WF, Li TK, Edenberg HJ. Genotyping of human alcohol dehydrogenases at the ADH2 and ADH3 loci following DNA sequence amplification. Genomics 1988; 2: 209–14. [DOI] [PubMed] [Google Scholar]
- 26. Garcia CC, Angeli JP, Freitas FP et al [13C2]‐Acetaldehyde promotes unequivocal formation of 1,N 2‐propano‐2′‐deoxyguanosine in human cells. J Am Chem Soc 2011; 133: 9140–3. [DOI] [PubMed] [Google Scholar]
- 27. Takeshita T, Mao XQ, Morimoto K. The contribution of polymorphism in the alcohol dehydrogenase beta subunit to alcohol sensitivity in a Japanese population. Hum Genet 1996; 97: 409–13. [DOI] [PubMed] [Google Scholar]
- 28. Weng H, Weng Z, Lu Y, Nakayama K, Morimoto K. Effects of alcohol‐drinking behaviour and ADH1B and ALDH2 polymorphisms on basal DNA damage in human mononuclear cells as determined by the comet assay. Mutat Res 2010; 701: 132–6. [DOI] [PubMed] [Google Scholar]
- 29. Yang SJ, Yokoyama A, Yokoyama T et al Relationship between genetic polymorphisms of ALDH2 and ADH1B and esophageal cancer risk: a meta‐analysis. World J Gastroenterol 2010; 16: 4210–20. [DOI] [PMC free article] [PubMed] [Google Scholar]
- 30. Dong YJ, Peng TK, Yin SJ. Expression and activities of class IV alcohol dehydrogenase and class III aldehyde dehydrogenase in human mouth. Alcohol 1996; 13: 257–62. [DOI] [PubMed] [Google Scholar]
- 31. Yin SJ, Chou FJ, Chao SF et al Alcohol and aldehyde dehydrogenases in human esophagus: comparison with the stomach enzyme activities. Alcohol Clin Exp Res 1993; 17: 376–81. [DOI] [PubMed] [Google Scholar]
- 32. Lieber CS. Microsomal ethanol‐oxidizing system (MEOS): the first 30 years (1968–1998)—a review. Alcohol Clin Exp Res 1999; 23: 991–1007. [PubMed] [Google Scholar]
- 33. Muto M, Hitomi Y, Ohtsu A et al Acetaldehyde production by non‐pathogenic Neisseria in human oral microflora: implications for carcinogenesis in upper aerodigestive tract. Int J Cancer 2000; 88: 342–50. [PubMed] [Google Scholar]
- 34. Kurkivuori J, Salaspuro V, Kaihovaara P et al Acetaldehyde production from ethanol by oral streptococci. Oral Oncol 2007; 43: 181–6. [DOI] [PubMed] [Google Scholar]
- 35. Tillonen J, Homann N, Rautio M, Jousimies‐Somer H, Salaspuro M. Role of yeasts in the salivary acetaldehyde production from ethanol among risk groups for ethanol‐associated oral cavity cancer. Alcohol Clin Exp Res 1999; 23: 1409–15. [PubMed] [Google Scholar]
- 36. Yokoyama A, Omori T. Genetic polymorphisms of alcohol and aldehyde dehydrogenases and risk for esophageal and head and neck cancers. Alcohol 2005; 35: 175–85. [DOI] [PubMed] [Google Scholar]
- 37. Kanda J, Matsuo K, Suzuki T et al Impact of alcohol consumption with polymorphisms in alcohol‐metabolizing enzymes on pancreatic cancer risk in Japanese. Cancer Sci 2009; 100: 296–302. [DOI] [PMC free article] [PubMed] [Google Scholar]
- 38. Yokoyama A, Muramatsu T, Ohmori T et al Alcohol‐related cancers and aldehyde dehydrogenase‐2 in Japanese alcoholics. Carcinogenesis 1998; 19: 1383–7. [DOI] [PubMed] [Google Scholar]
- 39. Miyasaka K, Hosoya H, Tanaka Y et al Association of aldehyde dehydrogenase 2 gene polymorphism with pancreatic cancer but not colon cancer. Geriatr Gerontol Int 2010; 10(Suppl 1): S120–6. [DOI] [PubMed] [Google Scholar]