

Abstract
To reduce cancer mortality, understanding of mechanisms of cancer metastasis is crucial. We have established six rat hepatocellular carcinoma (HCC) cell lines, which exhibit differing metastatic potential to the lung after inoculation into the tail veins of nude mice. In the present experiment, we investigated the process of cell attachment to metastatic sites and possible regulating factors. One hour after inoculation, two of two HCC cell lines with high metastatic potential and one of two HCC cell lines with low metastatic potential exhibited many attached cells in the lung. One day after inoculation, lung metastatic foci were observed only with highly‐metastatic cells with elevated connexin 43 (Cx43) expression as assessed by cDNA array analysis. Furthermore, 24 or 48 h after transfection of an siRNA targeting Cx43, in vitro invasion and migration were suppressed by 68% (P < 0.001) and 36% (P < 0.05) compared with control‐siRNA transfected cells, despite no differences in cellular morphology, cell proliferation or apoptotic activity. Moreover, the number of metastatic nodules per lung area in nude mice was significantly (P < 0.01) reduced. In conclusion, suppression of Cx43 expression in tumor cells reduced in vitro migration and invasion capacity and in vivo metastatic ability so that Cx43 has potential as a molecular target for prevention of cancer metastasis with Cx43 overexpressing tumors. (Cancer Sci 2012; 103: 860–867)
Despite significant improvements in diagnosis, surgical techniques, general patient care and local and systemic adjuvant therapies, most deaths from cancer are due to metastases that are resistant to conventional therapies. To reduce cancer mortality, an understanding of the mechanisms of cancer metastasis and the development of treatments focusing on prevention and/or care of metastases are a high priority.
We have established six rat hepatocellular carcinoma (HCC) cell lines1 from an in vivo rat HCC model,2, 3, 4 in which combination treatment of N‐nitrosomorpholine and diethylnitrosamine induces liver tumors metastasizing to the lung. These cell lines (HSU‐C1, ‐C2, ‐C5F, ‐C6, ‐N1 and ‐L2) show similar in vitro doubling times but widely differing metastatic ability after inoculation into the tail vein or transplantation into the subcutis of nude mice.1 In particular, the N1 and L2 lines are particularly metastatic to the lung when inoculated into the tail vein, as compared with the other lines. All these lines express the glutathione S‐transferase placental form (GST‐P), known to be upregulated during rat hepato‐carcinogenesis, from preneoplastic liver cell foci to hepatocellular carcinoma.5, 6, 7 Thus, immunohistochemistry for rat GST‐P can readily visualize the cells in mouse tissue.
Metastasis is a multi‐step process, involving angiogenesis, invasion, detachment, circulation, adhesion and extravasation.8 The genes and factors responsible for promotion or suppression of metastasis are multiple for each step and reasons for differences in metastatic potential remain to be elucidated.
It has been reported that cancer cells can be detected in peripheral blood or bone marrow of patients before metastatic lesions become clinically evident.9, 10, 11 In one experimental analysis of micrometastasis using LacZ gene‐tagged Lewis lung carcinoma cells, <0.1% of injected cells generated metastatic foci.12 Metastasis or attachment of circulating‐tumor cells to the distant organ might thus be considered as a very rare event.
In the present experiment, using rat HCC cells with different metastatic potential, we analyzed factors that might play a critical role in attachment of circulating tumor cells to metastatic sites as possible targets for suppression of metastasis.
Materials and Methods
Cell culture
The HSU rat HCC sublines,1 HSU‐C1, C5F, ‐C6, ‐N1 and ‐L2 were maintained in DMEM (Gibco, Grand Island, NY, USA) supplemented with 10% FBS at 37°C under a 5% CO2 atmosphere.
Animal experiment for the micrometastasis analysis
Nine‐week‐old female KSN athymic nude mice (Nihon SLC, Hamamatsu, Japan) were housed five per plastic cage with wood chips for bedding in an air‐conditioned room at 23 ± 2°C and 55 ± 5% humidity with a 12:12 h light:dark cycle. They were maintained on Oriental MF diet (Oriental Yeast Co., Tokyo, Japan) and distilled water ad libitum. At the age of 10–12 weeks, C5F, C6, N1 and L2 cells (1 × 10⁶/0.2 mL/mouse) suspended in serum‐free DMEM medium were injected into the tail veins of 15 mice per cell line. Subgroups of five mice each were sequentially killed at 1 h, 1 day and 1 week thereafter, when the lungs, liver, kidneys and spleen were removed and fixed in 10% buffered formalin. At least one section of spleen but two each for the liver, kidneys and the largest section from each lobe of the lung were processed for H&E staining. Immunohistochemical staining with anti‐GST‐P antibodies (MBL, Nagoya, Japan) was also performed to detect rat HCC cells. Quantitative analysis of lung metastases of five lobes, to provide numbers and areas (μm2) of lesions per mm2 of lung tissue, as well as the average size of metastatic foci was carried out with the aid of an image processor (Image Processor for Analytical Pathology [IPAP]; Sumika Technoservise, Osaka, Japan).13
Use of the animals in this transplantation experiment was according to the Guidelines for the Care and Use of Laboratory Animals of Nagoya City University Graduate School of Medical Sciences, and the study was approved by the Institutional Animal Care and Use Committee.
Microarray analysis
Extraction of total RNA from approximately 1 × 10⁷ C5F, C6, N1 and L2 cells as well as non‐treated rat liver tissue for RT‐PCR and microarray analysis was performed with ISOGEN (Nippon gene, Tokyo, Japan) and RQ1 RNase‐free DNase kits (Promega, Madison, WI, USA) following the manufacturer's instructions. Two micrograms of total RNA was processed following the protocol of CodeLink™ iExpress Expression Assay Reagent Kit (GE Healthcare, Piscataway, NJ, USA) and used for hybridization with a single microarray chip in a temperature‐controlled shaking incubator overnight. Spots were visualized using Cy5‐streptavidin dye conjugate. After subtraction of the background value, normalization of data was performed by the median global normalization method, using raw values/median values of all spots on the array. The expression ratio for each gene was compared between HSU cell lines and normal‐liver tissue.
RT‐PCR analysis
Total RNA from cell lysates of HSU‐C1, C5F, C6, N1 and L2 was extracted with an RNAeasy Mini kit (Qiagen sciences, Hilden, Germany) and then 1 μg of RNA was converted to cDNA with avian myeloblastosis virus reverse transcriptase (Takara, Shiga, Japan). Quantitative PCR was performed with SYBR Premix ExTaq (Takara) and primers for connexin (Cx) 43, Cx26, Cx32 using a light cycler apparatus (Roche Diagnostic, Mannheim, Germany). For normalization of cDNA contents used for the RT‐PCR template, rat β‐actin was applied for confirmation of array data and rat cyclophilin to check the efficacy of Cx43‐silencing. Primer sequences are listed in Table 1.
Table 1.
Primer sequences
| Gene | Forward | Reverse |
|---|---|---|
| Cx43 | 5′‐GAA GAA GCG ATC CTT ACC AC‐3′ | 5′‐TGT AAT TGC GGC ACG AGG AA‐3′ |
| Cx26 | 5′‐GGG GTG TCA ACA AGC AC‐3′ | 5′‐GGG AAG TAG TGG TCG TAG CA‐3′ |
| Cx32 | 5′‐AAC GTG GCG GAG GTG GTG TA‐3′ | 5′‐GGG AAG GTT TGA TGG AGT AAT‐3′ |
| β‐actin | 5′‐GCT CCG GCA TGT GCA A‐3′ | 5′‐AGG ATG TTC ATG AGG TAG‐3′ |
| Cyclophilin | 5′‐TGC TGG ACC AAA CAC AAA TA‐3′ | 5′‐GAA GGG GAA TGA GGA AAA TA‐3′ |
Silencing of Cx43 with siRNA
Three selected sequences of rat Cx43‐siRNA and Stealth RNAi Negative Control Duplex (medium GC Duplex) were purchased from Invitrogen (Carlsbad, CA, USA). To check the efficiency of reverse transfection, approximately 30 000 cells (highly metastatic L2 cells) in 500 μL of complete growth medium without antibiotics were incubated with 6 pmol of RNAi duplex (in 100 μL Opti‐MEM I Medium) with 1 μL of Lipofectamine RNAiMAX (Invitrogen) in 24 wells at 37°C for 24 h. Silencing efficiency was evaluated by RT‐PCR, as described above. The most effective Cx43‐siRNA sequence was used for further studies.
Cell proliferation and apoptosis
L2 cells were suspended in the transfection solution as described above and re‐plated in either 96‐ (for WST‐1 assay) or six‐well (for cell cycle and apoptosis assay) plates. At 24 h after the transfection period, the culture supernatant was removed and replaced with fresh complete culture medium (DMEM), then culture was continued for a further 24 or 48 h at 37°C. At the indicated time, cell growth was assessed by WST‐1 colorimetic assay (Roche Diagnostics), cell cycling and apoptosis were assessed with the Guava‐PCA system (Guava Technologies, Hayward, CA, USA), following the manufacturer's instructions. All analyses were performed in triplicate.
Invasion and migration analysis
For the invasion and migration assays, after 24 h transfection, the cells were trypsinized and 2 × 10⁵ L2 cells were seeded in the upper chambers of BD Biocoat Matrigel invasion chambers and the BD Falcon 24‐multiwell insert system (BD Biosciences, San Jose, CA, USA), respectively. The upper chamber was filled with medium containing 0.1% albumin but not FBS and phenol red and FBS free media plus 10 μg/mL fibronectin was added to the lower chamber as a chemoattractant. The cells were incubated at 37°C in a 5% CO2 atmosphere for 48 h. Invading or migrating cells were fixed with 100% ethanol for 5 min, and then stained with 0.5% crystal violet in 20% methanol for 30 min. The percent areas occupied by such cells were then determined with ImageJ 1.410 (National Institute of Health, Bethesda, MD, USA).
Gelatin zymography
Secretion of active matrix metalloproteinase (MMP)‐2 and MMP‐9 was analyzed by gelatin zymography. In brief, 24 h after siRNA transfection, cells were cultured in serum‐free medium for 48 h. Then the culture supernatant was collected and concentrated with Amicon Ultra Centrifugal Filters (Millipore, Billerica, MA, USA). Supernatants of parental L2 cells were also investigated. Samples were diluted in SDS buffer and separated on 10% SDS polyacrylamide gels containing 0.1 mg/mL gelatin (Bio‐Rad Laboratories, Hercules, CA, USA) under non‐reducing conditions. After electrophoresis, the gels were washed twice in 2.5% Triton X‐100 for 30 min with shaking at room temperature and subsequently incubated in 50 mM Tris–HCl (pH 7.4), 200 mM NaCl, and 10 mM CaCl2 at 37°C for 24 h. After staining with 0.1% Coomassie Brilliant Blue R‐250 in 50% methanol/10% acetic acid, and destaining in the same solution without the dye, the gelatinolytic activity was evaluated with ImageJ 1.410.
In vivo metastasis analysis
Twenty‐four hours after siRNA transfection with lipofectamine, L2 cells were trypsinized and 1 × 10⁶/0.2 mL per mouse suspended in DMEM medium without serum were injected into the tail veins of a group of 10 mice. Non‐treated parental L2 cells were also evaluated. Three weeks after inoculation, all mice were killed and their lungs, livers, kidneys and spleens were histologically analyzed as described above. The numbers and areas of lung metastatic foci per area of lung specimen were quantitatively analyzed with the aid of IPAP, in the maximum section from four lobes. Immunohistochemical analysis of Ki‐67 (DAKO, Denmark A/S, Glostrup, Denmark) and cleaved‐caspase 3 (Cell Signaling Technology, Danvers, MA, USA) for cell proliferation and apoptosis ability, respectively, was also conducted for metastatic foci.
The use of the animals in this transplantation experiment was also according to the Guidelines described above.
Statistical analysis
All in vitro experiments were performed at least in triplicate to confirm reproducibility. Statistical analyses were performed with mean ± SD values using one‐way anova, the Bonferroni's correction and the Student's t‐test with Welch's correction. Statistical significance was concluded at P < 0.05.
Results
Sequential animal experiment for the in vivo micrometastasis analysis
One hour after inoculation of various rat HSU cells, GST‐P‐positive single cells and or rare small cell clusters were diffusely observed in the lung sections of the nude mice given the C6, N1 or L2 lines (Fig. 1b–d,g). The number of foci in the mice given C5F was <10% of the values in mice given the other cell lines (P < 0.001) (Fig. 1a,g). GST‐P positive cells were not found in other organs, including the liver, kidney and spleen. One day after inoculation, the numbers of HCC foci in the lungs given the C6, N1 or L2 cells were dramatically decreased with statistical significance (P < 0.001) from 1 h after inoculation, particularly no HCC cells being seen in mice given C5F or C6 cells (Fig. 1g). One week after inoculation, metastatic foci were observed in one out of five mice with N1 cells and five out of five mice with L2 cells. The total area of foci per lung specimen (data not shown) changed in a similar manner to the number of foci. The average size of lung foci at 1 h after inoculation was almost equal to the size of single cells and nearly the same among cells. Then, it gradually increased with N1 and L2 at 1 day and 1 week after inoculation (Fig. 1d–f,h). At 1 week after inoculation, the average size of lung foci in mice given L2 cells was significantly higher (P < 0.001) than with other cells.
Figure 1.
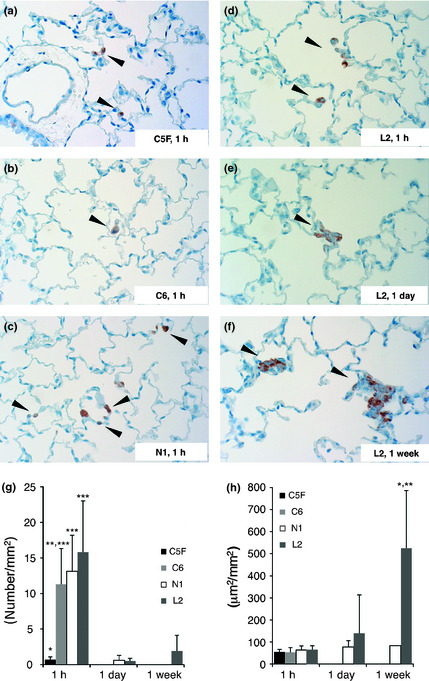
Immunohistochemical staining of GST‐P in nude mouse lungs. One hour after inoculation of C5F (a), C6 (b), N1 (c) and L2 (d). One day (e) and 1 week (f) after inoculation of L2. Arrowhead shows GST‐P positive hepatocellular carcinoma (HCC) cells. The number of HCC cell foci per area of lung specimens (g). *P < 0.001 versus C6, N1 and L2 at the same time point. **P < 0.01 versus L2 at the same time point. ***P < 0.001 versus the same cell line at 1 day and 1 week. The average size of metastatic foci (h). *P < 0.001 versus C5F, C6 and N1 at the same time point. **P < 0.001 versus the same cell line at 1 h and 1 day.
Microarray analysis and expression of Cxs
Micorarray analysis of the four HSU cell lines and rat normal liver tissue revealed variation in expression levels of a number of genes (GEO accession number GSE30469). The patterns of connexins in HSU cell lines were completely different from that in normal liver tissue (Table 2). The expression of Cx26 and Cx32, major connexins in the liver, was lowered to 0–24% and 0–20% of the normal liver tissue levels, respectively, in all four cell lines. On the other hand, levels of Cx43, a minor connexin in the liver, were higher in N1 and L2 cells. These tendencies were confirmed by RT‐PCR analysis. The mRNA expression of Cx26 in C1, C5F N1 and L2 cells was as low as that in rat heart tissue. Although the value for the C6 line was the highest in the cell lines investigated, it was rather lower than in normal rat liver tissue, which consists of not only hepatocytes, but also bile ducts and mesenchymal cells, including endothelium (Fig. 2a). The expression of Cx43 in C1, C5F and C6, showing low lung metastatic potential after inoculation into mice tail veins,1 was almost zero, while that in N1 was almost the same as the rat normal liver tissue, and in L2 was higher (Fig. 2b). Statistical significance was not observed for Cx26 expression, but Cx43 expression in N1 (P < 0.01) and L2 (P < 0.05) was significantly higher than in C1, C5F and C6.
Table 2.
Relative mRNA expression evaluated by cDNA microarray
| Gene | Lower metastatic HCC cells | Higher metastatic HCC cells | ||
|---|---|---|---|---|
| C5F | C6 | N1 | L2 | |
| C× 43 (GE1202712) | 0.11 | 0.28 | 1.35 | 3.09 |
| C× 43 (GE15258) | 0.05 | 0.08 | 1.08 | 2.27 |
| C× 32 (GE20450) | −0.01 | 0.20 | 0.12 | 0.06 |
| C× 32 (GE22089) | 0.07 | 0.10 | 0.08 | 0.09 |
| C× 26 (GE1113642) | 0.20 | 0.24 | 0.07 | 0 |
| C× 45 (GE1173386) | 5.50 | −1.69 | 18.64 | 21.91 |
| C× 40 (GE20631) | 6.62 | 5.22 | 6.44 | 7.4 |
(): The GE number indicates the probe name. Data were expressed as a relative ratio to the normal rat liver tissue. HCC, hepatocellular carcinoma.
Figure 2.
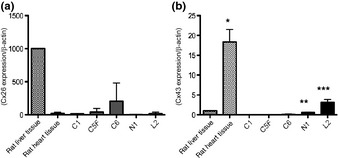
Relative mRNA expression was evaluated by real time RT‐PCR normalized with β‐actin for Cx26 (a) and Cx43 (b) in rat liver tissue (positive control of Cx26), rat heart tissue (positive control of Cx43), C1, C5F, C6, N1 and L2. *P < 0.001 versus rat liver tissue and all hepatocellular carcinoma cell lines (Bonferroni's multiple comparison). **P < 0.01 versus C1, C5F and C6 (t‐test with Welch's correction). ***P < 0.05 versus C1, C5F, C6 and N1 (t‐test with Welch's correction).
Silencing of Cx43 with siRNA
With one of three Cx43 siRNAs (set 2), the expression of Cx43 mRNA was successfully reduced to approximately 30% of the level in control siRNA‐transfected L2 cells at both 24 and 48 h after transfection (Fig. 3a). The control siRNA also tended to decrease the expression of Cx43 slightly. In a confirmation study, 24 h after Cx43 siRNA transfection (Fig. 3b–d), the mRNA expression of Cx43 was suppressed by 70% (Fig. 3b). At the same time, the expression of Cx26 was increased by 1.5‐fold (Fig. 3c) and that of Cx32 remained at the same level as in control siRNA‐transfected L2 cells (Fig. 3d).
Figure 3.
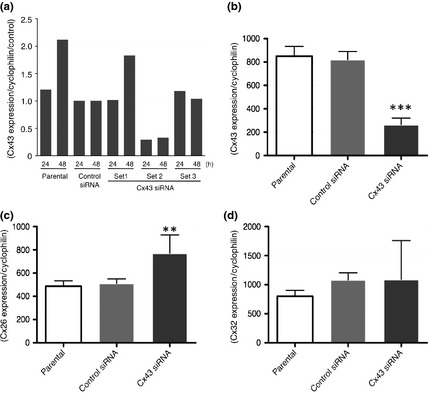
Effects of the Cx43 siRNA. Relative expression levels of Cx43 mRNA to the control siRNA‐transfected cells in parental, control siRNA‐transfected and three different sequences (sets 1, 2 and 3) of Cx43 siRNA‐transfected L2 at 24 and 48 h after transfection (a). Relative expression of Cx43 (b), Cx26 (c) and Cx32 mRNA in parental, control siRNA‐transfected and Cx43 siRNA‐transfected L2 at 24 h after transfection. (n = 3) ***P < 0.001 and **P < 0.01 versus control siRNA.
Effects on cell proliferation and apoptosis by Cx43 siRNA transfection
WST‐1 assays revealed that the Cx43 siRNA did not affect L2 cell proliferation (Fig. 4a) and the silencing of Cx43 did not induce cell cycle arrest (Fig. 4b). The annexin V assay further showed that Cx43 siRNA did not induce apoptosis in L2 cells (Fig. 4c) and siRNA transfection did not cause obvious morphological alteration (Fig. 4d).
Figure 4.
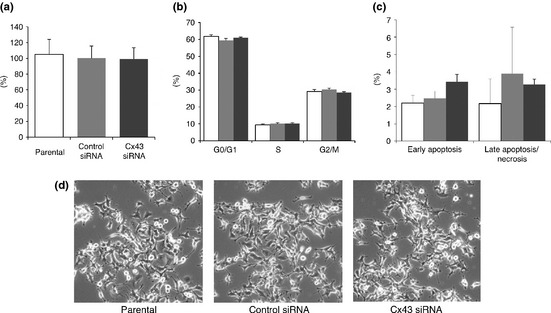
Characteristics of parental (open column), control siRNA‐transfected (light gray column) and Cx43 siRNA‐transfected (dark gray column) L2 at 48 h after re‐plating. Cell viability evaluated with the WST‐1 assay is indicated as the ratio to the control siRNA‐transfected cells (a). The cell cycle distribution (b) and apoptosis evaluated with annexin assay are given as percentages of cells (c) (n = 3). Microscopic appearance (d).
Effects on invasion and migration with Cx43 siRNA transfection
The number of L2 cells transfected with Cx43 siRNA which invaded through matrigel was significantly decreased by 68% (P < 0.001) compared with control siRNA‐transfected cells (Fig. 5a,b). The ability to migrate assessed in chambers without a matrix was also significantly reduced by 36% (P < 0.05) in the case of Cx43 siRNA‐transfected cells (Fig. 5a,b).
Figure 5.
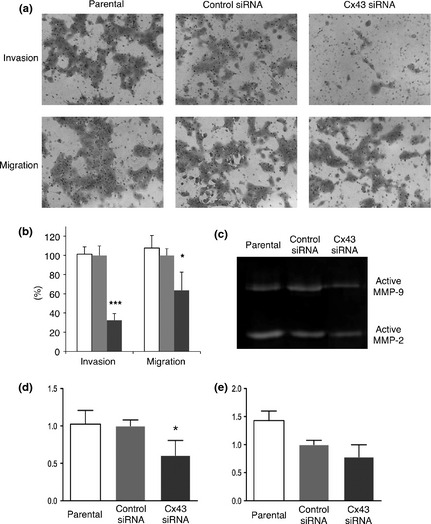
Potential for invasion, migration and secretion of active matrix metalloproteinases (MMPs). Representative crystal violet‐stained membranes with matrigel (upper row) and without matrigel (lower row). The size of pores was 8 μm (a). Quantitative evaluation of invasive L2 cells of parental (open column), control siRNA‐transfected (light gray column) and Cx43 siRNA‐transfected (dark gray column) indicated as the ratio to the control siRNA‐transfected cells. ***P < 0.001 and *P < 0.05 versus control siRNA (b). Representative gelatin zymography of culture supernatants (c). Densitometry values for gelatinolytic activity of active MMP‐9 (d) and active MMP‐2 (e) are given as ratios to the control siRNA‐transfected cells (n = 4). *P < 0.05 versus control siRNA.
Effects on MMPs secretion with Cx43 siRNA transfection
Gelatin zymography (Fig. 5c) revealed that secretion of active MMP‐2 from L2 cells was not altered by Cx43 siRNA‐transfection (Fig. 5d). On the other hand, active MMP‐9 secretion was significantly (P < 0.05) reduced by Cx43 siRNA, as compared with control siRNA (Fig. 5e).
Effects on in vivo metastasis with Cx43 siRNA transfection
In nude mice receiving Cx43 siRNA‐transfected L2 cells, the body and liver weights were not changed and the lung weight tended to be lower than in mice given control siRNA‐transfected cells and parental cells, 3 weeks after inoculation (data not shown). Macroscopically, all mice developed numerous metastatic nodules in their lungs. Fewer metastatic nodules were observed in the mice inoculated with L2 cells transfected with Cx43 siRNA (Fig. 6a). Quantitatively, the number (P < 0.01) and area (P < 0.05) were significantly decreased (Fig. 6b,c). Tendencies for reduction in cell proliferation as indicated by Ki67 indices (Fig. 6d) and for increase in apoptosis as assessed with reference to cleaved‐caspase 3 indices (Fig. 6e) were seen in the metastatic nodules of Cx43 siRNA transfected cells, but without significance.
Figure 6.
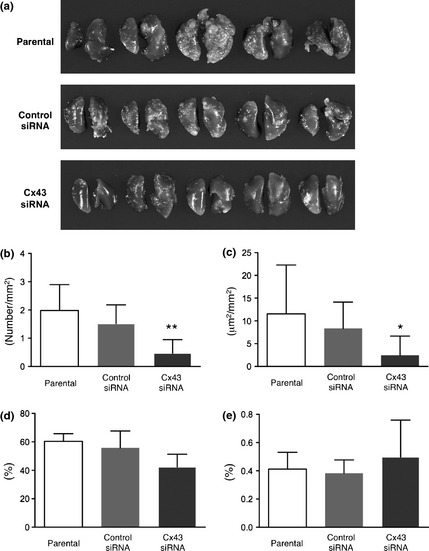
Macroscopic appearance of the lungs of nude mice, 3 weeks after inoculation (a). The number (b) and area (μm2) (c) of hepatocellular carcinoma cell foci per area (mm2) of lung specimens. **P < 0.01 and *P < 0.05 versus control siRNA. Percentage labeling indices for ki67 (d) and cleaved caspase 3 (e) in lung metastatic foci.
Discussion
The present results demonstrated many anchored cells to be present in the lungs 1 h after intravenous inoculation of HSU cell lines with high metastatic potential and one of two HSU cell lines with low metastasis potential. A few cells of the other low metastatic potential were also observed in the lung capillaries. Interestingly, 24 h after inoculation, most of the attached cells in the lung had disappeared. Moreover, no anchored inoculated cells were noted in other organs such as the kidney, liver and spleen at any time point. These findings are consistent with our former study, in which metastatic nodules were not observed except in the lungs and regional lymph nodes at a later time point.1
Overall, it can be said that only a limited number of cells are able to survive in the target organs, in line with the idea of seed and soil proposed by Paget over 100 years ago. This concept has been emphasized in more recent studies focused on the tumor‐microenvironment.8 However, the mechanisms and reasons for the limited number of cells that can attach and grow, among the enormous number of circulating tumor cells, remain unclear.
We have been studying the role of Cx32 and Cx43 in rat liver carcinogenesis over many years.14, 15, 16, 17 Moreover, data have accumulated suggesting that these molecules play an important role in cancer metastasis.18, 19, 20, 21, 22, 23, 24, 25 Therefore, we have intensively given attention to the expression of connexins. The present microarray analysis revealed expression of Cx26 and Cx32, major connexins in the liver, to be extremely low in all HSU cell lines. However, Cx43, a minor connexin in the liver, was highly expressed in metastatic HSU cell lines (N1 and L2) compared with low metastatic HSU cell lines (C1, C5F and C6) and in normal liver tissue. Connexins are components of gap junction channels, which mediate direct cell‐to‐cell communication by allowing passage of small molecules under about 1000 Da. Six connexin subunits form hemichannels and by pairing of two hemichannels the gap junction is constructed. More than 20 different mammalian connexins have been identified.26 The roles of connexins in cancer are still controversial. Most of the studies suggest that they are protective against tumor onset. For example, mice and rats lacking or with reduced Cx32 are more susceptible to chemical‐ and radiation‐induced liver14, 16, 27, 28 and lung carcinogenesis.29 The sharing of ions, amino acids, second messengers and various metabolites through gap junctions is thought to maintain homeostasis between cells. Glutathione has high permeability through gap junction channels,30, 31 and its antioxidant properties protect cells from reactive oxygen species. Thus, glutathione is considered to protect against DNA damage, as well as detoxifying carcinogens.32
In the present experiment, interference in Cx43 expression with an siRNA significantly suppressed invasion and migration of L2 cells, accompanied by reduction of active MMP‐9 secretion in vitro, and also suppressed lung metastasis after inoculation into tail veins of nude mice. Although reports indicating relations between Cx45 and metastasis are limited, upregulation of Cx43 is associated with invasion, intravasation, extravasation and metastasis of melanoma cells,18, 19 mammary gland carcinoma cells,19, 20 and glioma cells.21 Indeed, Cx43‐transfected malignant glioma cells showed elevated invasive capacity associated with higher MMP‐2 and MMP‐9 secretion, compared with mock‐transfected cells.22 Moreover, several studies have suggested that upregulation of MMP‐9 is related to the metastasis in human hepatocellular carcinoma.33, 34
On the other hand, there is opposing evidence that reduced expression of Cx43 correlates with invasion and metastasis in lung cancer cell23 and overexpression of Cx43 was found to reduce cell adhesion and/or migration of breast cancer cells.24, 25
It is of considerable interest that only a limited number of circulating tumor cells can survive and form metastatic foci among the enormous numbers inoculated into veins. Clonal cultured cells should share exactly the same genetic characteristics. Variation in metastasizing potential may thus not be simply explained by an additional gene alteration. Among more than 20 connexins, Cx43 is commonly found in endothelial cells,35 osteoblastic cells36 and heart.37 Highly metastatic HCC cells that aberrantly express Cx43 might form gap junction channels with endothelial cells, which might be beneficial for HCC cell survival. Further studies regarding the expression and detailed localization of Cx43 in HCC metastatic foci and effects on the angiogenesis would be needed in our system. Cytoplasmic dye transfer between metastatic tumor cells that express Cx43 and endothelium has been reported for melanoma and mammary carcinoma.19 Upregulation of Cx43 may also occur in tumor cell to endothelial cell contact areas.20 Generally, cells express more than one connexin, and gap junction channels can thus potentially contain more than one type. Homomeric heterotypical channels are formed by the pairing of two different types of connexons, which each consist of uniform connexins. Such heterotypical channels have been recognized in Xenopus oocytes.38, 39 Heterotypic pairing of Cx26 and Cx43 did not result in electrical coupling in paired Xenopus oocytes.39 Another kind of mixed channel, a heteromeric channel formed by non‐uniform connexins within one connexon also has been identified with a number of combinations, including Cx26‐Cx30, Cx26‐Cx32, Cx43‐Cx37, Cx43‐Cx40, Cx43‐Cx45, Cx43‐Cx56 and Cx46‐Cx50. Interestingly, co‐expression of Cx26 and Cx43 in mouse neuroblastoma cells did not result in formation of heteromeric channels, but rather a reduction in the total junctional conductance to around 10% of that in cells expressing a single connexin.40 In our rat HCC cells, the Cx26 level is decreased, while Cx43, Cx40 and Cx45 levels are increased. Variation in the ratios of Cxs on cells and aberrant functions of heterotypic and/or heteromeric channels might offer one explanation of the mechanisms underlying limited tumor cell attachment to endothelial cells and different potentials for invasion and metastasis among tumor cells.
In conclusion, the potential for colonization of circulating tumor cells within the first 24 h after inoculation was here found to differ among four rat HCC cell lines with different metastasizing ability. cDNA array analysis revealed that highly‐metastatic cells express elevated Cx43 and silencing of Cx43 in highly metastatic tumor cells with an siRNA reduced in vitro migration and invasion ability and in vivo metastatic ability. Our results suggest that Cx43, at least in part, may regulate tumor cell invasion and metastasis. Thus, Cx43 can be a molecular target for suppression of cancer metastasis by Cx43 overexpressing tumors.
Disclosure Statement
The authors have no conflict of interest.
Acknowledgments
This work was supported in part by a grant from the Society for Promotion of Toxicological Pathology of Nagoya, Japan.
References
- 1. Ogawa K, Nakanishi H, Takeshita F et al Establishment of rat hepatocellular carcinoma cell lines with differing metastatic potential in nude mice. Int J Cancer 2001; 91: 797–802. [DOI] [PubMed] [Google Scholar]
- 2. Masui T, Nakanishi H, Inada K‐I et al Highly metastatic hepatocellular carcinomas induced in male F344 rats treated with N‐nitrosomorpholine in combination with other hepatocarcinogens show a high incidence of p53 gene mutations along with altered mRNA expression of tumor‐related genes. Cancer Lett 1997; 112: 33–45. [DOI] [PubMed] [Google Scholar]
- 3. Futakuchi M, Hirose M, Ogiso T et al Establishment of an in vivo highly metastatic rat hepatocellular carcinoma model. Jpn J Cancer Res 1999; 90: 1196–202. [DOI] [PMC free article] [PubMed] [Google Scholar]
- 4. Yoshino H, Futakuchi M, Cho YM et al Modification of an in vivo lung metastasis model of hepatocellular carcinoma by low dose N‐nitrosomorpholine and diethylnitrosamine. Clin Exp Metastasis 2005; 22: 441–7. [DOI] [PubMed] [Google Scholar]
- 5. Sato K, Kitahara A, Satoh K, Ishikawa T, Tatematsu M, Ito N. The placental form of glutathione S‐transferase as a new marker protein for preneoplasia in rat chemical hepatocarcinogenesis. Gann 1984; 75: 199–202. [PubMed] [Google Scholar]
- 6. Ito N, Tsuda H, Tatematsu M et al Enhancing effect of various hepatocarcinogens on induction of preneoplastic glutathione S‐transferase placental form positive foci in rats – an approach for a new medium‐term bioassay system. Carcinogenesis 1988; 9: 387–94. [DOI] [PubMed] [Google Scholar]
- 7. Ogiso T, Tatematsu M, Tamano S, Hasegawa R, Ito N. Correlation between medium‐term liver bioassay system data and results of long‐term testing in rats. Carcinogenesis 1990; 11: 561–6. [DOI] [PubMed] [Google Scholar]
- 8. Fidler IJ. The pathogenesis of cancer metastasis: the ‘seed and soil’ hypothesis revisited. Nat Rev Cancer 2003; 3: 453–8. [DOI] [PubMed] [Google Scholar]
- 9. Pantel K, Cote RJ, Fodstad O. Detection and clinical importance of micrometastatic disease. J Natl Cancer Inst 1999; 91: 1113–24. [DOI] [PubMed] [Google Scholar]
- 10. Waguri N, Suda T, Nomoto M et al Sensitive and specific detection of circulating cancer cells in patients with hepatocellular carcinoma; detection of human telomerase reverse transcriptase messenger RNA after immunomagnetic separation. Clin Cancer Res 2003; 9: 3004–11. [PubMed] [Google Scholar]
- 11. Riethdorf S, Wikman H, Pantel K. Review: biological relevance of disseminated tumor cells in cancer patients. Int J Cancer 2008; 123: 1991–2006. [DOI] [PubMed] [Google Scholar]
- 12. Kobayashi K, Nakanishi H, Masuda A, Tezuka N, Mutai M, Tatematsu M. Sequential observation of micrometastasis formation by bacterial lacZ gene‐tagged Lewis lung carcinoma cells. Cancer Lett 1997; 112: 191–8. [DOI] [PubMed] [Google Scholar]
- 13. Watanabe T, Katsura Y, Yoshitake A, Masataki H, Mori T. IPAP: image processor for analytical pathology. J Toxicol Pathol 1994; 7: 353–61. [Google Scholar]
- 14. Tsuda H, Asamoto M, Baba H et al Cell proliferation and advancement of hepatocarcinogenesis in the rat are associated with a decrease in connexin 32 expression. Carcinogenesis 1995; 16: 101–5. [DOI] [PubMed] [Google Scholar]
- 15. Asamoto M, Hokaiwado N, Murasaki T, Shirai T. Connexin 32 dominant‐negative mutant transgenic rats are resistant to hepatic damage by chemicals. Hepatology 2004; 40: 205–10. [DOI] [PubMed] [Google Scholar]
- 16. Hokaiwado N, Asamoto M, Futakuchi M, Ogawa K, Takahashi S, Shirai T. Both early and late stages of hepatocarcinogenesis are enhanced in Cx32 dominant negative mutant transgenic rats with disrupted gap junctional intercellular communication. J Membr Biol 2007; 218: 101–6. [DOI] [PubMed] [Google Scholar]
- 17. Naiki‐Ito A, Asamoto M, Naiki T et al Gap junction dysfunction reduces acetaminophen hepatotoxicity with impact on apoptotic signaling and connexin 43 protein induction in rat. Toxicol Pathol 2010; 38: 280–6. [DOI] [PubMed] [Google Scholar]
- 18. Villares GJ, Dobroff AS, Wang H et al Overexpression of protease‐activated receptor‐1 contributes to melanoma metastasis via regulation of connexin 43. Cancer Res 2009; 69: 6730–7. [DOI] [PMC free article] [PubMed] [Google Scholar]
- 19. El‐Sabban ME, Pauli BU. Cytoplasmic dye transfer between metastatic tumor cells and vascular endothelium. J Cell Biol 1991; 115: 1375–82. [DOI] [PMC free article] [PubMed] [Google Scholar]
- 20. Elzarrad MK, Haroon A, Willecke K, Dobrowolski R, Gillespie MN, Al‐Mehdi AB. Connexin‐43 upregulation in micrometastases and tumor vasculature and its role in tumor cell attachment to pulmonary endothelium. BMC Med 2008; 6: 20. [DOI] [PMC free article] [PubMed] [Google Scholar]
- 21. Lin JH, Takano T, Cotrina ML et al Connexin 43 enhances the adhesivity and mediates the invasion of malignant glioma cells. J Neurosci 2002; 22: 4302–11. [DOI] [PMC free article] [PubMed] [Google Scholar]
- 22. Zhang W, Nwagwu C, Le DM, Yong VW, Song H, Couldwell WT. Increased invasive capacity of connexin43‐overexpressing malignant glioma cells. J Neurosurg 2003; 99: 1039–46. [DOI] [PubMed] [Google Scholar]
- 23. Xu HT, Li QC, Zhang YX et al Connexin 43 recruits E‐cadherin expression and inhibits the malignant behaviour of lung cancer cells. Folia Histochem Cytobiol 2008; 46: 315–21. [DOI] [PubMed] [Google Scholar]
- 24. Li Z, Zhou Z, Donahue HJ. Alterations in Cx43 and OB‐cadherin affect breast cancer cell metastatic potential. Clin Exp Metastasis 2008; 25: 265–72. [DOI] [PubMed] [Google Scholar]
- 25. McLachlan E, Shao Q, Wang HL, Langlois S, Laird DW. Connexins act as tumor suppressors in three‐dimensional mammary cell organoids by regulating differentiation and angiogenesis. Cancer Res 2006; 66: 9886–94. [DOI] [PubMed] [Google Scholar]
- 26. Willecke K, Eiberger J, Degen J et al Structural and functional diversity of connexin genes in the mouse and human genome. Biol Chem 2002; 383: 725–37. [DOI] [PubMed] [Google Scholar]
- 27. Temme A, Buchmann A, Gabriel HD, Nelles E, Schwarz M, Willecke K. High incidence of spontaneous and chemically induced liver tumors in mice deficient for connexin32. Curr Biol 1997; 7: 713–6. [DOI] [PubMed] [Google Scholar]
- 28. King TJ, Lampe PD. Mice deficient for the gap junction protein Connexin32 exhibit increased radiation‐induced tumorigenesis associated with elevated mitogen‐activated protein kinase (p44/Erk1, p42/Erk2) activation. Carcinogenesis 2004; 25: 669–80. [DOI] [PubMed] [Google Scholar]
- 29. King TJ, Lampe PD. The gap junction protein connexin32 is a mouse lung tumor suppressor. Cancer Res 2004; 64: 7191–6. [DOI] [PubMed] [Google Scholar]
- 30. Goldberg GS, Lampe PD, Nicholson BJ. Selective transfer of endogenous metabolites through gap junctions composed of different connexins. Nat Cell Biol 1999; 1: 457–9. [DOI] [PubMed] [Google Scholar]
- 31. Tapiero H, Townsend DM, Tew KD. The role of carotenoids in the prevention of human pathologies. Biomed Pharmacother 2004; 58: 100–10. [DOI] [PMC free article] [PubMed] [Google Scholar]
- 32. Balendiran GK, Dabur R, Fraser D. The role of glutathione in cancer. Cell Biochem Funct 2004; 22: 343–52. [DOI] [PubMed] [Google Scholar]
- 33. Kim J, Hong SJ, Park JY et al Epithelial‐mesenchymal transition gene signature to predict clinical outcome of hepatocellular carcinoma. Cancer Sci 2010; 101: 1521–8. [DOI] [PMC free article] [PubMed] [Google Scholar]
- 34. Li J, Lau GK‐K, Chen L et al Interleukin 17A promotes hepatocellular carcinoma metastasis via NF‐kB induced matrix metalloproteinases 2 and 9 expression. PLoS ONE 2011; 6: e21816. [DOI] [PMC free article] [PubMed] [Google Scholar]
- 35. Yeh HI, Rothery S, Dupont E, Coppen SR, Severs NJ. Individual gap junction plaques contain multiple connexins in arterial endothelium. Circ Res 1998; 83: 1248–63. [DOI] [PubMed] [Google Scholar]
- 36. Donahue HJ, McLeod KJ, Rubin CT et al Cell‐to‐cell communication in osteoblastic networks: cell line‐dependent hormonal regulation of gap junction function. J Bone Miner Res 1995; 10: 881–9. [DOI] [PubMed] [Google Scholar]
- 37. van Veen AA, van Rijen HV, Opthof T. Cardiac gap junction channels: modulation of expression and channel properties. Cardiovasc Res 2001; 51: 217–29. [DOI] [PubMed] [Google Scholar]
- 38. Swenson KI, Jordan JR, Beyer EC, Paul DL. Formation of gap junctions by expression of connexins in Xenopus oocyte pairs. Cell 1989; 57: 145–55. [DOI] [PubMed] [Google Scholar]
- 39. White TW, Paul DL, Goodenough DA, Bruzzone R. Functional analysis of selective interactions among rodent connexins. Mol Biol Cell 1995; 6: 459–70. [DOI] [PMC free article] [PubMed] [Google Scholar]
- 40. Gemel J, Valiunas V, Brink PR, Beyer EC. Connexin43 and connexin26 form gap junctions, but not heteromeric channels in co‐expressing cells. J Cell Sci 2004; 117: 2469–80. [DOI] [PubMed] [Google Scholar]