Abstract
The testin (TES) gene was previously identified in the fragile chromosomal region FRA7G at 7q31.2. In the present study, we aimed to investigate the candidate tumor suppressor function of TES and explore its correlations to clinicopathologic features and prognosis in breast cancer. In clinical samples, we showed that the expression of TES decreased gradually from normal through ductal hyperplasia without atypia, atypical ductal hyperplasia, and ductal carcinoma in situ, to invasive ductal carcinoma. To explore the possible tumor suppressing function of TES, the expression of TES in breast cancer cells was manipulated by ectopic expression or by RNAi. We revealed that ectopic TES expression significantly inhibited cell proliferation, invasive ability, and angiogenesis, whereas knockdown of TES by RNAi enhanced cell proliferation, invasive ability, and angiogenesis. In an animal model, TES markedly inhibited breast cancer cell xenograft formation in athymic nude mice and reduced breast cancer cell metastasis to lung. Moreover, we revealed that TES inhibited the invasion and angiogenesis of breast cancer partially through miR‐29b‐mediated MMP‐2 inhibition. Using the tissue microarray of breast cancer from Yale University, we found that lower TES expression was an independent prognostic factor for shorter overall survival and disease‐free survival with univariate and multivariate analyses. Taken together, these data suggest that TES, as a valuable marker of breast cancer prognosis, plays an important role in the development and progression of breast cancer. TES may be an effective novel target in breast cancer prevention and treatment.
Breast cancer is the most common female malignancy worldwide, with approximately 229 060 new breast cancer cases and 39 510 deaths expected in the USA alone in 2012.1 Although the widespread use of early detection methods and improvements in treatment have led to a reduction in mortality from breast cancer, it continues to be the second leading cause of cancer‐related deaths among women. Better understanding of the molecules and signaling pathways leading to breast cancer would facilitate the development of more effective treatment strategies, with potential improvements in the quality of life and outcomes in patients. Thus, identification of novel molecular mechanisms that lead to breast cancer carcinogenesis, tumor progression, and improvements in patient outcomes are still urgently needed.
The TES gene, a novel human gene, was mapped to a common fragile site on chromosome 7q31.2 designated FRA7G. The gene spans 48 kb encompassing seven exons and is predicted to encode a highly conserved protein of 421 amino acids. There are three isoforms of human TES, which differ in the size of the 3′‐UTR encoded by exon 7.2, 3 The TES gene contains three zinc‐binding domains present in the Lin‐11, Isl‐1, and Mec‐3 domains, which play a very important role in focal adhesion.4 FRA7G is a locus that shows loss of heterozygosity in many human malignancies, and some studies suggested that one or more tumor suppressor genes involved in multiple malignancies are in this region.2, 3 Loss of gene expression within this region on chromosome 7q31.2 may have a relationship with the development and/or progression of cancer. We and other researchers have reported that TES expression is decreased or silenced partially by hypermethylation and/or loss of heterozygosity in various human cancers.5, 6, 7, 8 TES is a cytoskeleton‐associated protein that localizes along actin stress fibers at cell–cell contact areas and at focal adhesion plaques. It interacts with a variety of cytoskeletal proteins, including zyxin, mena, VASP, talin, and actin.4, 9 Drusco et al.10 established the tumor suppressor function of TES in vivo for gastric cancer but the potential role of TES in the progression, metastasis, and prognosis of breast cancer remains to be identified. In the present study, we aimed to investigate the candidate tumor suppressor function of TES and explore its correlations to clinicopathologic features and prognosis in breast cancer.
Materials and Methods
Patients and tissue samples
All the breast samples involved in the study were histopathologically diagnosed by at least two pathologists using the World Health Organization's Classification of Tumors: Pathology and Genetics of Tumors of Breast and Female Genital Organs, Fourth Edition. A total of 307 paraffin‐embedded breast tissue samples (50 cases of normal breast tissues, 28 cases of ductal hyperplasia without atypia [UDH], 17 cases of atypical ductal hyperplasia [ADH], 25 cases of ductal carcinoma in situ [DCIS], and 187 cases of invasive ductal carcinoma) and 39 cases of breast cancer tissue and their matched non‐tumor tissues were obtained from the Department of Pathology of Qilu Hospital (Shandong University, Jilin, China) between 2007 and 2011. A breast cancer tissue microarray was created with 153 primary tumors. In addition, a clinicopathologic database with long‐term clinical follow‐up was also used for this study, and has been previously described.11, 12 For all participants in this study, written informed consent was obtained as delineated by the protocol that was approved by the Ethical Committee of Shandong University.
Cell lines and reagents
The breast cancer cell lines MCF‐7 and MDA‐MB‐468 and the murine fibroblast cell line NIH3T3 were obtained from ATCC (Rockville, MD, USA). An antibody against MMP‐2 was purchased from Cell Signaling Technology (Beverly, MA, USA) and mouse monoclonal anti‐TES antibody (ab57292) from Abcam (Cambridge, MA, USA). Unless otherwise specified, all remaining reagents were obtained from Sigma‐Aldrich (St. Louis, MO, USA).
Immunohistochemistry
Immunohistochemical staining was carried out using the labeled streptavidin–biotin method as previously described.7, 13, 14 The primary antibody was incubated with the sections overnight at 4°C. Staining was visualized using diaminobenzidine. Known positive tissue from testis was included as the positive control. For negative controls, the antibody solution was replaced with non‐immune mouse serum. The TES immunoreactivity was semiquantitatively scored based on both distribution and intensity of staining. The distribution of staining in the tumor cells was graded as focal (≤10%), regional (11–50%), or diffuse (>50%). The intensity of staining was graded as negative, weak, moderate, or intense. The TES immunoreactivity was assigned one of the two final scores: 0, negative (focal distribution, or regional distribution and negative/weak staining); or 1, positive (diffuse distribution, or regional distribution and moderate/intense staining). Two investigators who were blinded to the clinical and laboratory patient information carried out evaluation of the specimens independently. The antibodies and methods for estimating estrogen receptor (ER), progesterone receptor (PR), human epidermal growth factor receptor 2 (HER2), and p53 were the same as previously described.11, 14
Plasmid construction and transfection
For RNAi of TES, the pGPU6‐Neo‐GFP (Genepharm, Shanghai, China) vector was used. The pGPU6‐Neo‐GFP‐shRNA‐TES vector, which consists of pools of three to five target‐specific 19–25 nt siRNAs designed to knockdown TES expression, was constructed by Genepharm. The pGPU6‐Neo‐GFP‐shRNA‐TES vector and the empty vector were used to transfect cells using Lipofectamine 2000 (Invitrogen, Carlsbad, CA, USA) according to the manufacturer's protocol to establish pGPU6‐Neo‐GFP‐shRNA‐TES cell lines (MCF7‐TES‐KD) and control cell lines (MCF7‐control).
For overexpression, the cDNA representing the complete ORF of TES was cloned into the pcDNA3.1 vector (Invitrogen) to generate the expression plasmid of TES. The expression plasmid was verified by sequencing of both strands and was used to transfect the MDA‐MB‐468 cells to establish the TES overexpression cell line (TES‐OVE). The MDA‐MB‐468 cell lines were transfected by the pcDNA3.1 vector to generate 468 control cell lines.
Quantitative RT‐PCR analysis
Total RNA were extracted with TRIzol reagents (Invitrogen) according to the manufacturer's protocol. Briefly, cDNA was synthesized from 1 μg total RNA by the PrimerScript RT Reagent Kit (Takara, Dalian, China). For miRNA analysis, the miRcute miRNA First‐Strand cDNA Synthesis Kit and the miRcute miRNA qPCR Detection Kit (SYBR Green) from Tiangen (Beijing, China) were employed. Quantitative RT‐PCR (qRT‐PCR) was carried out using the StepOne and StepOnePlus Real‐Time PCR Systems (Applied Biosystems, Foster City, CA, USA). The samples were loaded in quadruple, and the results of each sample were normalized to GAPDH. The experiments were repeated in triplicate to confirm the findings.
Western blot analysis
Cells were lysed with protease and phosphorase inhibitors and quantified by the BCA Protein Assay Kit (Merck, Darmstadt, Germany). Equal amounts of protein were separated by SDS‐PAGE, electrotransferred to PVDF membranes (ImmobilonP; Millipore, Bedford, MA, USA) and blocked in 5% non‐fat dry milk. Membranes were immunoblotted overnight at 4°C with primary antibodies, followed by their respective HRP‐conjugated secondary antibodies. Signals were detected by enhanced chemiluminescence. β‐actin was used as the loading control.
Cell proliferation assay
The MTT assay was used to assess cellular proliferation. Cells were seeded in a 96‐well plate and allowed to attach overnight. Twenty microliters of MTT solution (5 mg/mL) was added to each well at the indicated time. The absorbance was quantified by a Microplate Reader (Bio‐Rad, Hercules, CA, USA).
Clonogenic assay
The survival and proliferation potential of cells were assessed using clonogenic assays. Briefly, cells were trypsinized, counted, and seeded in a 6‐cm plate at 500 cells per well. After incubation for 2 weeks, colonies were fixed with methanol and stained with crystal violet, and the number of colonies containing more than 50 cells was scored.
Invasion and migration assays
Invasion assays were carried out as described previously.15 Briefly, 500 mL of balanced mixture of the conditional medium from NIH3T3 fibroblasts and the complete medium was added to the lower compartment as the chemotactic factor. Serum‐free DMEM with 1 × 10⁵ cells was added to the upper compartment of the chamber. At the indicated time, the non‐invasive cells in the upper compartment were removed with a cotton swab. The cells in the lower compartment of the chamber were counted under a light microscope for a minimum of 10 random visual fields. The migration assay was similar to the invasion assay, except that the upper side of the membranes was not coated with Matrigel.
Capillary tube formation assay
Forty‐eight‐well plates were coated with 200 μL growth factor‐reduced Matrigel and incubated at 37°C for 1 h to allow gelling. Tumor cell conditioned medium (TCM) was prepared as described.16 Then HUVEC were resuspended by the TCM collected from the cells and seeded on Matrigel‐coated plates. The HUVEC were then incubated at 37°C. The formation of capillary‐like structures was captured under a light microscope. The branch points of the formed tubes, which represent the degree of angiogenesis in vitro, were scanned and quantitated in at least 10 microscopic fields.
In vivo tumorigenesis and metastasis assay
The in vivo tumorigenesis and metastasis assay was carried out as described previously.11 For the s.c. xenograft model, 1 × 10⁶ cells were injected s.c. into either side of the posterior flank of the same female BALB/c athymic nude mice at 5 weeks of age. For MCF‐7 cells, a 17β‐estradiol pellet (Innovative Research of America, Sarasota, FL, USA) was implanted s.c. into each mouse 2 days before cell injection. The growth of primary tumors was monitored by measuring tumor diameters for 35 days. Tumor length (L) and width (W) were measured, and tumor volume was calculated by the equation: volume = (W2 × L) / 2. To produce experimental lung metastasis, 5 × 10⁵ cells were injected into the lateral tail veins of 5‐week‐old female BALB/c athymic nude mice. After 38 days, the mice were killed under anesthesia. The lungs were harvested and fixed in 10% formalin. Haematoxylin and eosin staining was done on sections from embedded samples. All animal work was carried out in accordance with the guidelines of the Shandong University Animal Care and Use Committee under approved protocols.
Statistical analysis
The results were analyzed using the software spss version 18.0 (SPSS, Chicago, IL, USA). Each experiment was done three times and the data were expressed as mean ± SD. A two‐tailed Student's t‐test and χ2‐test was used when indicated to determine statistical significance. Kaplan–Meier analysis and multivariate Cox analysis were used to assess the relationship between TES and patient outcomes. P < 0.05 was considered statistically significant.
Results
Testin protein was reduced in breast cancer tissues
In order to clarify the relationship between TES and breast cancer progression, we first compared the expression levels of TES in 39 cases of breast cancer fresh‐frozen tissues and the matched non‐tumor tissues by Western blot analysis. As shown in Figure 1(A), the TES protein levels of 31 cases were significantly reduced in the cancer lesion compared with the matched non‐tumor tissues, suggesting an association between decreased expression of TES protein levels and carcinogenesis of breast cancers. The other eight cases had similar levels of TES between them.
Figure 1.
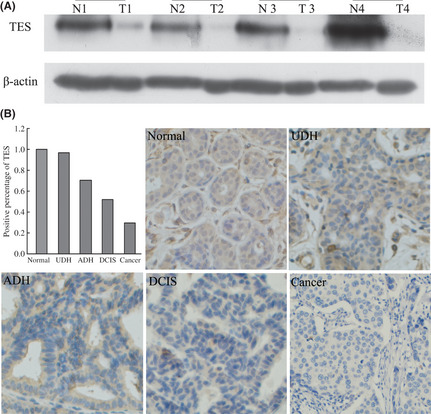
Expression of the testin (TES) gene in breast cancer tissues. (A) TES protein levels in four different pairs of tumor tissues (T) and their matched non‐tumor tissues (N) analyzed by Western blot. (B) Expression of TES by immunohistochemistry in breast pre‐cancerous lesions and cancer; TES staining was mainly localized in the cytoplasm of breast cells. ADH, atypical ductal hyperplasia; DCIS, ductal carcinoma in situ; UDH, usual ductal hyperplasia without atypia.
Expression levels of TES gradually reduced during breast carcinogenesis
Given that UDH, ADH, and DCIS of the breast are associated with different levels of risk for the subsequent development of invasive carcinoma, we used a variety of the above (in addition to normal tissue and invasive cancer) to determine whether changes in the expression level of TES contribute to the progression of breast cancer. As shown in Figure 1(B), positive TES staining was identified in all of the normal breast tissues (50/50; 100%). In the proliferative lesions, positive TES staining was detected in 27/28 (96.43%) cases of UDH, 12/17 (70.59%) cases of ADH, and 13/25 (52.00%) cases of DCIS. Furthermore, only 56/187 (29.95%) cases of invasive breast cancer showed positive TES staining. The differential staining of TES at different stages of breast cancer was statistically significant by linear‐by‐linear association (P < 0.05).
Testin gene inhibited proliferation of breast cancer cells
In order to explore additional functions of TES in breast cancer, we used the breast cancer cell line MDA‐MB‐468 to establish stable cells that constitutively overexpressed the TES protein, and breast cancer cell line MCF‐7 to generate TES‐knockdown cell models. The transfection efficiency was confirmed using Western blot and qRT‐PCR analysis. As shown in Figure 2(A), the MDA‐MB‐468 cells transfected with expression plasmid (TES‐OVE cell lines) showed significantly increased TES protein expression and mRNA levels compared with the 468 control cells. The MCF‐7 cells transfected with shRNA‐TES plasmid (TES‐KD cell lines) showed significantly decreased TES mRNA and protein expression levels compared with the MCF‐7 control cells.
Figure 2.
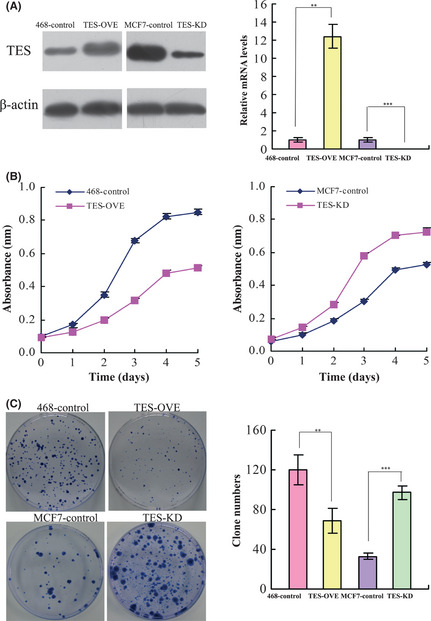
Effect of the testin (TES) gene on cell proliferation in breast cancer cell lines. (A) Transfection efficiency of TES protein levels measured by Western blot analysis and RT‐PCR analysis in MDA‐MB‐468 and MCF‐7 cell lines. (B) Growth curves of control and TES overexpression/knockdown cells were plotted. (C) Results of colony formation for control and TES transfected breast cancer cell lines. The data represent the mean ± SD of three independent experiments. **P < 0.01; ***P < 0.001.
We next investigated the effect of TES expression on cell proliferation. The MTT assay showed that overexpression of TES significantly inhibited cell proliferation of MDA‐MB‐468 cells (P = 0.009), whereas knockdown of TES significantly enhanced the growth of MCF‐7 cells (P = 0.008) (Fig. 2B). Next, we carried out a clonogenic assay. As shown in Figure 2(C) overexpression of TES in MDA‐MB‐468 cells dramatically reduced colony formation efficiency (P = 0.006), whereas the colony formation efficiency was dramatically increased in the TES knockdown cells compared with MCF‐7 control cells (P < 0.0001). These results suggested that TES played a significant role in inhibiting the proliferation of breast cancer cells.
Testin gene inhibited mobility of breast cancer cells
By using a two‐chamber assay, we found that TES inhibited cell migration (120.40 ± 9.69 vs 64.80 ± 5.93; P < 0.001) and invasion (82.40 ± 5.55 vs 31.80 ± 4.32; P < 0.001) in TES‐OVE cell lines. Consistent with this, enhanced cell migration (49.48 ± 4.58 vs 79.40 ± 9.94; P = 0.0001) and invasion (30.0 ± 5.36 vs 55.6 ± 5.55; P < 0.001) (Fig. 3) were evident with knockdown of TES in MCF‐7 cells.
Figure 3.
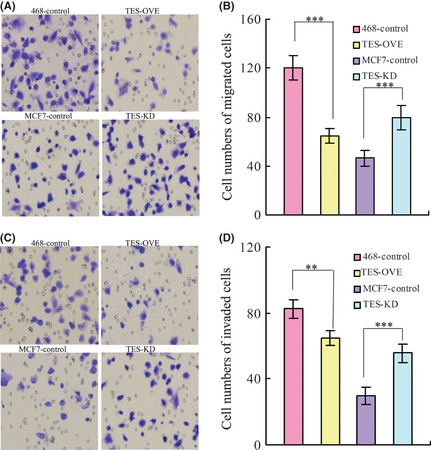
Effect of the testin (TES) gene on invasion and migration of breast cancer cells. (A) Migration ability was measured using Transwell chamber assays in TES transfected MDA‐MB‐468 and MCF‐7 cells, with suumary graphs (B). (C) Invasion ability was measured using Transwell chamber assays in TES transfected MDA‐MB‐468 and MCF‐7 cells, with summary graphs (D). Data represent the average cell numbers from at least 10 viewing fields and are presented as the mean ± SEM. **P < 0.01; ***P < 0.001.
Testin gene inhibited angiogenesis of breast cancer
Because angiogenesis is one of the major contributors to tumor growth and metastasis, we explored the biological significance of TES in tumor angiogenesis using an in vitro capillary tube formation assay for the angiogenic activity of HUVEC. As shown in Figure 4(A), when HUVEC were incubated with TCM of TES‐OVE cells, the branch points of capillary‐like structures dramatically decreased to a level comparable to HUVEC grown in the control MDA‐MB‐468 cells (75.67 ± 7.02 vs 37.33 ± 5.51, P = 0.0017). When TCM from TES‐KD cells were supplied to the culture medium for HUVEC, HUVEC developed more capillary‐like structures compared with those cultured in TCM from MCF‐7 control cells (38.67 ± 4.51 vs 66.33 ± 7.02, P = 0.0046).
Figure 4.
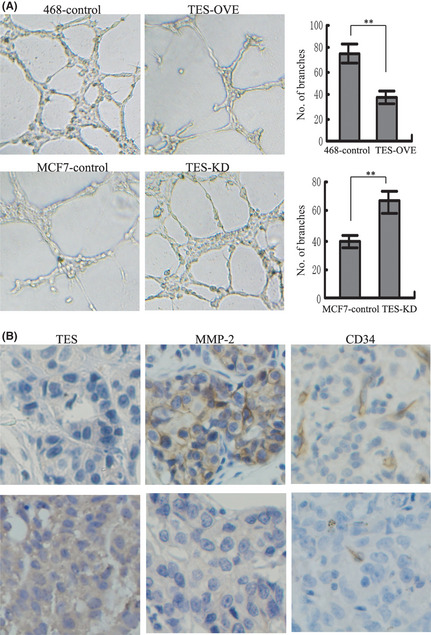
Effect of the testin (TES) gene on angiogenesis in breast cancer. (A) Tube formation assay showing the effect of TES on the formation of tube‐like structures in HUVEC (left). The representative images of tube formation and the number of branch points of HUVEC are presented (right). (B) Sections of breast tumors were stained for TES, CD34, and MMP‐2. Representative images of sections with lower TES expression and cancer lesions with higher TES expression. **P < 0.01.
Given that CD34 has been described as a marker for vascular‐associated tissue and angiogenesis, we examined the expression of CD34 in 83 cases of breast cancers and analyzed the relationship between CD34 and TES. As shown in Figure 4(B), overexpression of TES was associated with lower microvessel density compared with the TES non‐expressing tissues (55.67 ± 5.69 vs 35.33 ± 4.04, P = 0.0072), suggesting that expression of TES in tumor sections is inversely correlated with expression of specific angiogenesis molecule CD34 both in vitro and in clinical samples.
Because the MMP family is frequently overexpressed in various tumor tissues and plays an important role in both tumor angiogenesis and metastasis, including breast cancer,17, 18, 19, 20 we assessed the relationship between TES and MMP‐2. In 83 cases of breast cancer, 35 cases had higher TES expression and 19 cases had MMP‐2 positive staining, whereas 35 cases were MMP‐2 positive in the 48 cases with lower TES expression (P = 0.0222) (Fig. 4B). We also examined the relationship between TES and MMP‐9, but found there was no relationship between them (P = 0.0731).
Testin gene inhibited tumorigenesis and metastasis in vivo
In order to investigate the tumor‐suppressing function of TES in vivo, the TES overexpressed MDA‐MB‐468 (TES‐OVE) cells, TES knockdown MCF‐7 (TES‐KD) cells, and control cells were injected s.c. into either side of the posterior flank of 5‐week‐old female BALB/c athymic nude mice. During the process, we found that the mice injected with the TES‐OVE cells formed tumors later than those in the control MDA‐MB‐468 cells. Whereas large tumors were formed in mice injected with control cells within 35 days, tumor growth was greatly reduced in mice injected with TES‐OVE cells. The TES‐KD cells formed earlier tumors and the tumors grew faster than the MCF‐7 control group (Fig. 5A), implying a potential role of TES in inhibition of breast cancer cell xenograft formation and growth in vivo.
Figure 5.
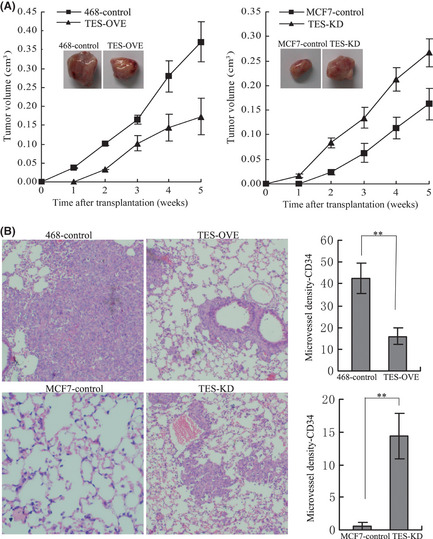
Testin (TES) gene inhibited tumorigenic and metastatic capabilities in vivo. (A) Tumors isolated from mice 35 days after s.c. injection of control and TES transfected MDA‐MB‐468 and MCF‐7 cells in SCID mice. Growth curves of mammary tumors after injection of cells. Error bars represent mean ± SD (n = 7). (B) Lungs obtained from mice after injection into the lateral tail veins with control and TES overexpression MDA‐MB‐468 cells as well as TES knockdown MCF‐7 cells (H&E staining). Representative staining of lung sections showing the numbers of tumor nodules per field under light microscope. **P < 0.01.
The effect of TES on breast cancer metastatis to lung was evaluated using an experimental lung metastasis model. After 5 weeks, all lungs were harvested and fixed in 10% formalin. Haematoxylin and eosin staining was done on sections from embedded samples. As expected, the lungs from mice injected with MDA‐MB‐468 control cells developed extensive macrometastatic foci by histological analysis. However, mice injected with TES‐OVE cells showed fewer macrometastatic foci (42.23 ± 7.02 vs 16.00 ± 3.61, P = 0.0045). Macrometastatic foci from the MCF‐7 control cells measured 0.67 ± 0.58 foci vs 14.34 ± 3.51 in lungs of the TES‐KD group (P = 0.0027) (Fig. 5B). These data further confirm that TES plays a role in the inhibition of lung metastasis of breast cancer cells.
Testin gene inhibited invasion, metastasis, and angiogenesis through miR‐29b‐mediated MMP‐2 inhibition
We had previously revealed that TES played an important role in carcinogenesis, invasion, metastasis, and angiogenesis, and it was significantly correlated with the expression of MMP‐2 in breast cancer tissues. Fang et al.16 also has reported that miR‐29b could suppress tumor angiogenesis, invasion, and metastasis by regulating MMP‐2 expression in hepatocellular carcinoma. Therefore, we further hypothesized that TES inhibited the invasion, metastasis, and angiogenesis of breast cancer by the inhibition of MMP‐2 through miR‐29b, a novel miRNA that has been shown to play an important role in invasion, metastasis, and angiogenesis in various cancers. We first detected the expression of miR‐29b and MMP‐2 in the TES overexpressed MDA‐MB‐468 cells and the TES knockdown MCF‐7 cells. The results of qRT‐PCR confirmed our hypothesis, with the level of miR‐29b upregulated in TES‐OVE cells and downregulated in TES‐KD cells compared with their respective control cells, and the levels of MMP‐2 showing the reverse results (Fig. 6A). To validate the role of miR‐29b in invasion and angiogenesis, we transfected the control and TES‐OVE cells with an miR‐29b inhibitor (10 μM) or negative control oligoduplex (Ambion, Cambridge, MA, USA). The control and TES‐KD cells were transfected with miR‐29b mimics (10 μM) or negative control oligoduplex (Ambion). The transfection efficiency and the levels of MMP‐2 were examined by qRT‐PCR (Fig. 6B). We also measured invasion ability using a Transwell assay and the variability in angiogenesis by capillary tube formation assay. As expected, the invasion ability (Fig. 6C) was restored in TES‐OVE cells and the invasion ability of TES‐KD was inhibited after transfection of miR‐29b. Meanwhile, the branch points of capillary‐like structures formed by HUVEC decreased in the TES‐OVE cells and the HUVEC developed more capillary‐like structures in TES‐KD cells (Fig. 6D). Consistent with these results, the MDA‐MB‐468 and MCF‐7 cell lines transfected with miR‐29b inhibitor or mimics showed the same effect on invasion and angiogenesis (data not shown).
Figure 6.
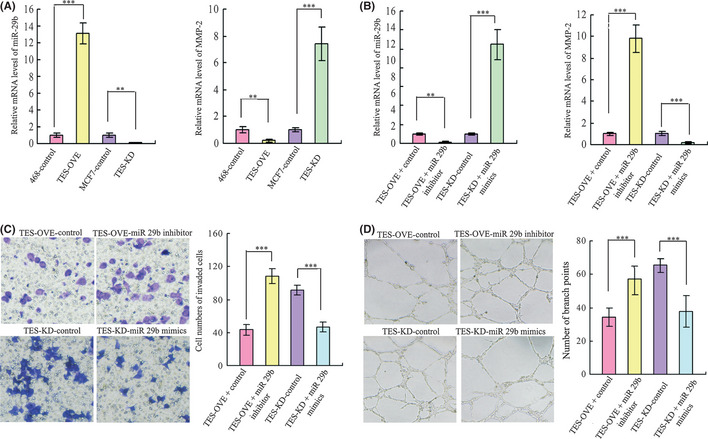
Testin (TES) gene inhibited metastasis and angiogenesis ability by the inhibition of MMP‐2 through miR‐29b. (A) Levels of miR‐29b and MMP‐2 in TES transfected breast cancer cell lines. (B) Transfection efficiency was detected by quantitative RT‐PCR in TES overexpressing (TES‐OVE) and TES knockdown (TES‐KD) cells transfected by miR‐29b inhibitor or mimics. Levels of MMP‐2 were detected in the above miR‐29b transfected cells. (C) Invasion ability was measured using Transwell chamber assays after transfection of miR‐29b inhibitor or mimics in TES transfected MDA‐MB‐468 and MCF‐7 cell lines. Summary graphs for the invasion assay are presented. (D) Effects of miR‐29b on the formation of tube‐like structures in TES‐OVE and TES‐KD cells were determined by HUVEC cells. Representative images of tube formation and the number of branch points of HUVEC are presented. Data represent the average cell numbers from at least 10 viewing fields and are presented as the mean ± SEM. **P < 0.01; ***P < 0.001.
Testin gene is an independent prognostic marker for breast cancer
We first determined the relationship of TES with the clinical features of breast cancer. As shown in Table 1, TES expression was strongly correlated with ER status (P = 0.027), but it was not associated with other clinical characteristics. To evaluate whether the expression of TES is prognostic in breast cancer, we evaluated TES expression status with respect to the four survival outcomes: breast relapse‐free survival; cause‐specific survival; distant metastasis‐free survival; and overall survival. As shown in Figure 7, significant correlations were observed between TES negativity and declines in all four survival categories (P = 0.001, P = 0.002, P = 0.007, and P = 0.018, respectively). As the tumor biology differs according to breast cancer subtypes, we also evaluated the prognostic values in the subgroup of ER‐positive and ER‐negative breast cancers as well as HER2‐positive and HER2‐negative breast cancers. In the ER‐positive group, TES was a prognostic factor for breast relapse‐free survival and overall survival (both P < 0.001). However in the ER‐negative breast cancers, there were no statistical differences in either breast relapse‐free survival or overall survival (P = 0.537 and 0.820, respectively). Prognostic significance was not detected in the HER2‐positive or HER2‐negative groups.
Table 1.
Relationship between testing (TES) gene expression and clinicopathological variables of breast cancer
| Clinicopathologicalvariables | TES expression status | P‐value | |
|---|---|---|---|
| Negative | Positive | ||
| Age, years | |||
| ≤40 | 21 | 39 | 0.861 |
| >40 | 30 | 63 | |
| Tumor size, cm | |||
| ≤2 | 34 | 68 | 0.935 |
| >2 | 13 | 29 | |
| Nodal status | |||
| Negative | 34 | 63 | 0.857 |
| Positive | 11 | 24 | |
| ER status | |||
| Negative | 40 | 59 | 0.027 |
| Positive | 9 | 36 | |
| PR status | |||
| Negative | 33 | 60 | 0.207 |
| Positive | 11 | 36 | |
| HER2 status | |||
| Negative | 42 | 86 | 0.571 |
| Positive | 3 | 11 | |
| p53 status | |||
| Negative | 38 | 72 | 0.097 |
| Positive | 5 | 25 | |
Bold text indicates significant result. ER, estrogen receptor; HER2, human epidermal growth factor receptor 2; PR, progesterone receptor.
Figure 7.
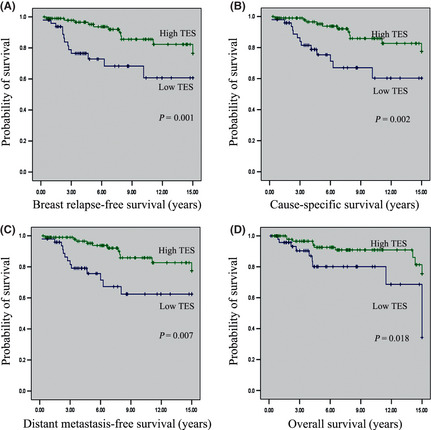
Kaplan–Meier curves for survival in patients with breast cancer according to testin (TES) gene expression. (A) Breast relapse‐free survival. (B) Cause‐specific survival. (C) Distant metastasis‐free survival. (D) Overall survival.
To further validate the prognostic values, univariate analysis was carried out to identify those factors that affected overall survival (Table 2). We then carried out multivariate analysis of TES expression with the tissue samples stratified by other common clinicopathological parameters including TES, ER, PR, HER2, p53, and lymph node status as well as the sizes of primary tumors at the time of cancer diagnosis. The TES expression level retained its prognostic significance in multivariate analyses independent of other clinicopathological factors (hazard ratio, 0.162; 95% confidence interval, 0.043–0.612, P = 0.007).
Table 2.
Cox hazard ratios for overall survial of breast cancer based on testin (TES) gene expression levels in tissue array analysis
| Pathological parameter | Univariate analysis | Multivariate analysis | ||
|---|---|---|---|---|
| HR (95% CI) | P‐value | HR (95% CI) | P‐value | |
| Testin | 0.305 (0.136–0.685) | 0.004 | 0.162 (0.043–0.612) | 0.007 |
| Tumor size | 0.231 (0.048–1.114) | 0.068 | 0.604 (0.258–1.415) | 0.246 |
| Nodal status | 0.132 (0.027–0.648) | 0.013 | 0.684 (0.273–1.718) | 0.419 |
| ER | 0.054 (00003–1.018) | 0.051 | 0.792 (0.282–2.223) | 0.658 |
| PR | 0.071 (0.057–1.088) | 0.057 | 0.484 (0.160–1.460) | 0.198 |
| HER2 | 0.397 (0.067–2.342) | 0.308 | 0.904 (0.294–2.785) | 0.861 |
| p53 | 0.426 (0.041–4.444) | 0.476 | 0.839 (0.302–2.334) | 0.737 |
CI, confidence interval; ER, estrogen receptor; HER2, human epidermal growth factor receptor 2; HR, hazard ratio; PR, progesterone receptor.
Discussion
It has been established that TES is a candidate human tumor suppressor gene,10, 21 but its role in breast cancer remains unknown. Our study is the first attempt to elucidate the tumor suppressor role of TES in the progression, angiogenesis, and metastasis of breast cancer using both in vitro and in vivo models. This is also the first attempt to illuminate the independent prognostic role of TES in breast cancer tissues.
We first identified that TES expression was reduced in breast cancer lesions compared with matched non‐tumor tissues, which implied that TES is a candidate tumor suppressor gene in breast cancer. Next, we assessed the expression levels of TES in the progression of breast cancer by immunohistochemical staining and found that TES is expressed in all normal tissues, but that expression levels diminished with proliferative lesion progression from UDH to ADH and DCIS. These results suggest that TES is a novel indicator for the carcinogenesis of breast cancer and may play an important role in the development of the disease.
To further explore the detailed tumor suppressor function of TES, the expression of TES in breast cancer cells was manipulated with ectopic expression or RNAi. We found that overexpression of TES significantly inhibited proliferation, invasion, and angiogenesis, whereas knockdown of TES promoted the proliferation, invasion, and angiogenesis in breast cancer cell lines. In animal models, TES also markedly inhibited breast cancer cell xenograft formation and growth and reduced breast cancer cell metastasis in a lung metastasis model. These data further supported the tumor suppressor role of TES in breast cancer. Previous studies have reported that TES inhibited the growth of breast and uterine as well as ovarian cancer cell proliferation through caspase‐dependent and caspase‐independent apoptosis.7, 21 Our present results further confirmed that TES could significantly inbibit cell proliferation, but its role in invasion and angiogenesis of breast cancer was unknown. Angiogenesis has been reported to be essential for tumor metastasis,22, 23, 24 and metastasis remains the major cause of breast cancer‐related death. So we next examined the effect of TES on angiogenesis, which partly contributes to the metastasis of breast cancer. Our findings showed that overexpression of TES in breast cancer cell lines could significantly inhibit capillary tube formation of HUVEC. In the clinical samples, we found that TES was inversely correlated with expression of MMP‐2 and CD34. These data suggested that TES had a potential role in the neovascular formation of breast cancer. This gave a clue that TES should be considered as a potential therapeutic target for breast cancer in future investigations.
The phenomenon of TES in inhibiting the progression, metastasis, and angiogenesis of breast cancer cells encouraged us to further investigate the possible mechanism. We found that ectopic expression of TES could upregulate the expression of miR‐29b, whereas knockdown of TES significantly inhibited the expression of miR‐29b in breast cancer cell lines. We also found that MMP‐2 was inversely regulated. It had been reported that MMP‐2 is a target for miR‐29b and studies have shown that miR‐29b could suppress tumor angiogenesis, invasion, and metastasis by regulating MMP‐2 expression in cancers.16 Therefore, we hypothesized that TES inhibited invasion and angiogenesis of breast cancer by the inhibition of MMP‐2 through miR‐29b. Using the transfectants of miR‐29b inhibitors, we revealed that the invasion and angiogenesis ability were rescued in TES‐OVE as well as their control cells. Also, after transfection of miR‐29b mimics, the invasion and angiogenesis ability were inhibited for both TES‐KD and their control breast cancer cells. These data suggested that TES could suppress tumor angiogenesis, invasion, and metastasis at least partly by the inhibition of MMP‐2 through miR‐29b. However, the mechanism through which TES regulates miR‐29b and MMP‐2 should be explored in further studies.
Lastly, we evaluated the prognostic ability of TES in breast cancer. We showed that a unique cohort of breast cancer patients lacking TES had significantly worse relapse‐free survival, cause‐specific survival, distant metastasis‐free survival, and overall survival. Our findings suggest that low expression or loss of expression of TES protein may be an important prognostic factor for breast cancer outcomes independent of other prognostic clinical and pathological factors. In addition, TES expression had significant relationships with ER status and the prognostic value was observed in ER‐positive groups rather than ER‐negative groups. These findings implied that TES is a potential prognostic marker for breast cancer, and possibly an individual therapeutic target for ER‐positive patients. These results do need to be further validated in larger cohorts.
To the best of our knowledge, this is the first study to indicate the potential role of TES in the progression and prognosis of breast cancer. Expression of TES was generally lower in breast cancer lesions compared with matched non‐tumor tissues, and the intensity and expression level decreased both qualitatively and quantitatively with the progression of disease. Our findings show that TES plays a significant role in the inhibition of invasion and metastasis, partially by the inhibition of MMP‐2 through miR‐29b. In addition, we found that TES was a novel independent prognostic marker for breast cancer. Cohesively, our present findings suggest that TES could play an important role in the development of breast cancer, and that TES should be considered as a prognostic marker and therapeutic target for breast cancer in future investigations.
Disclosure Statement
The authors have no conflict of interest.
Acknowledgment
This work was supported by grants from the National Natural Science Foundation of China (Grant Nos. 81072150 and 81172529) to Q.Y., the Breast Cancer Research Foundation to B.G.H, and the Graduate Independent Innovation Foundation of Shandong University (Grant No. yzc12142) to X.L. We thank Yun Zhang, Shi Yan, Cunzhong Yuan and Xiaoli Kong (Shandong University School of Medicine, Jinan, Shandong, China) for technical support and critical discussions.
(Cancer Sci 2012; 103: 2092–2101)
Reference
- 1. Siegel R, Naishadham D, Jemal A. Cancer statistics, 2012. CA Cancer J Clin 2012; 62: 10–29. [DOI] [PubMed] [Google Scholar]
- 2. Tatarelli C, Linnenbach A, Mimori K, Croce CM. Characterization of the human TESTIN gene localized in the FRA7G region at 7q31.2. Genomics 2000; 68: 1–12. [DOI] [PubMed] [Google Scholar]
- 3. Tobias ES, Hurlstone AF, MacKenzie E, McFarlane R, Black DM. The TES gene at 7q31.1 is methylated in tumours and encodes a novel growth‐suppressing LIM domain protein. Oncogene 2001; 20: 2844–53. [DOI] [PubMed] [Google Scholar]
- 4. Coutts AS, MacKenzie E, Griffith E, Black DM. TES is a novel focal adhesion protein with a role in cell spreading. J Cell Sci 2003; 116: 897–906. [DOI] [PubMed] [Google Scholar]
- 5. Garvalov BK, Higgins TE, Sutherland JD et al The conformational state of Tes regulates its zyxin‐dependent recruitment to focal adhesions. J Cell Biol 2003; 161: 33–9. [DOI] [PMC free article] [PubMed] [Google Scholar]
- 6. Chene L, Giroud C, Desgrandchamps F et al Extensive analysis of the 7q31 region in human prostate tumors supports TES as the best candidate tumor suppressor gene. Int J Cancer 2004; 111: 798–804. [DOI] [PubMed] [Google Scholar]
- 7. Qiu H, Zhu J, Yuan C, Yan S, Yang Q, Kong B. Frequent hypermethylation and loss of heterozygosity of the testis derived transcript gene in ovarian cancer. Cancer Sci 2010; 101: 1255–60. [DOI] [PMC free article] [PubMed] [Google Scholar]
- 8. Mueller W, Nutt CL, Ehrich M et al Downregulation of RUNX3 and TES by hypermethylation in glioblastoma. Oncogene 2007; 26: 583–93. [DOI] [PubMed] [Google Scholar]
- 9. Griffith E, Coutts AS, Black DM. RNAi knockdown of the focal adhesion protein TES reveals its role in actin stress fibre organisation. Cell Motil Cytoskeleton 2005; 60: 140–52. [DOI] [PubMed] [Google Scholar]
- 10. Drusco A, Zanesi N, Roldo C et al Knockout mice reveal a tumor suppressor function for Testin. Proc Natl Acad Sci U S A 2005; 102: 10947–51. [DOI] [PMC free article] [PubMed] [Google Scholar]
- 11. Hu G, Chong RA, Yang Q et al MTDH activation by 8q22 genomic gain promotes chemoresistance and metastasis of poor‐prognosis breast cancer. Cancer Cell 2009; 15: 9–20. [DOI] [PMC free article] [PubMed] [Google Scholar]
- 12. Bouwman P, Aly A, Escandell JM et al 53BP1 loss rescues BRCA1 deficiency and is associated with triple‐negative and BRCA‐mutated breast cancers. Nat Struct Mol Biol 2010; 17: 688–95. [DOI] [PMC free article] [PubMed] [Google Scholar]
- 13. Yang QF, Sakurai T, Yoshimura G et al Expression of Bcl‐2 but not Bax or p53 correlates with in vitro resistance to a series of anticancer drugs in breast carcinoma. Breast Cancer Res Treat 2000; 61: 211–6. [DOI] [PubMed] [Google Scholar]
- 14. Broustas CG, Ross JS, Yang Q et al The proapoptotic molecule BLID interacts with Bcl‐XL and its downregulation in breast cancer correlates with poor disease‐free and overall survival. Clin Cancer Res 2010; 16: 2939–48. [DOI] [PubMed] [Google Scholar]
- 15. Li X, Kong X, Huo Q et al Metadherin enhances the invasiveness of breast cancer cells by inducing epithelial to mesenchymal transition. Cancer Sci 2011; 102: 1151–7. [DOI] [PubMed] [Google Scholar]
- 16. Fang JH, Zhou HC, Zeng C et al MicroRNA‐29b suppresses tumor angiogenesis, invasion, and metastasis by regulating matrix metalloproteinase 2 expression. Hepatology 2011; 54: 1729–40. [DOI] [PubMed] [Google Scholar]
- 17. Pratheeshkumar P, Kuttan G. Nomilin inhibits tumor‐specific angiogenesis by downregulating VEGF, NO and proinflammatory cytokine profile and also by inhibiting the activation of MMP‐2 and MMP‐9. Eur J Pharmacol 2011; 668: 450–8. [DOI] [PubMed] [Google Scholar]
- 18. Babykutty S, S PP, J NR et al Nimbolide retards tumor cell migration, invasion, and angiogenesis by downregulating MMP‐2/9 expression via inhibiting ERK1/2 and reducing DNA‐binding activity of NF‐kappaB in colon cancer cells. Mol Carcinog 2012; 51: 475–90. [DOI] [PubMed] [Google Scholar]
- 19. Kessenbrock K, Plaks V, Werb Z. Matrix metalloproteinases: regulators of the tumor microenvironment. Cell 2010; 141: 52–67. [DOI] [PMC free article] [PubMed] [Google Scholar]
- 20. Muhlebach MD, Schaser T, Zimmermann M et al Liver cancer protease activity profiles support therapeutic options with matrix metalloproteinase‐activatable oncolytic measles virus. Cancer Res 2010; 70: 7620–9. [DOI] [PubMed] [Google Scholar]
- 21. Sarti M, Sevignani C, Calin GA et al Adenoviral transduction of TESTIN gene into breast and uterine cancer cell lines promotes apoptosis and tumor reduction in vivo. Clin Cancer Res 2005; 11: 806–13. [PubMed] [Google Scholar]
- 22. Weis SM, Cheresh DA. Tumor angiogenesis: molecular pathways and therapeutic targets. Nat Med 2011; 17: 1359–70. [DOI] [PubMed] [Google Scholar]
- 23. Zerbini G, Lorenzi M, Palini A. Tumor angiogenesis. N Engl J Med 2008; 359: 763.; author reply 4. [DOI] [PubMed] [Google Scholar]
- 24. Kerbel RS. Tumor angiogenesis. N Engl J Med 2008; 358: 2039–49. [DOI] [PMC free article] [PubMed] [Google Scholar]


