

Abstract
Dysregulated DNA methylation followed by abnormal gene expression is an epigenetic hallmark in cancer. DNA methylation is catalyzed by DNA methyltransferases, and the aberrant expression or mutations of DNA methyltransferase genes are found in human neoplasm. The enzymes for demethylating 5‐methylcytosine were recently identified, and the biological significance of DNA demethylation is a current focus of scientific attention in various research fields. Ten–eleven translocation (TET) proteins have an enzymatic activity for the conversion from 5‐methylcytosine to 5‐hydroxymethylcytosine (5‐hmC), which is an intermediate of DNA demethylation. The loss‐of‐function mutations of TET2 gene were reported in myeloid malignancies, suggesting that impaired TET‐mediated DNA demethylation could play a crucial role in tumorigenesis. It is still unknown, however, whether DNA demethylation is involved in biological properties in solid cancers. Here, we show the loss of 5‐hmC in a broad spectrum of solid tumors: for example, a significant reduction of 5‐hmC was found in 72.7% of colorectal cancers (CRCs) and 75% of gastric cancers compared to background tissues. TET1 expression was decreased in half of CRCs, and a large part of them was followed by the loss of 5‐hmC. These findings suggest that the amount of 5‐hmC in tumors is often reduced via various mechanisms, including the downregulation of TET1. Consistently, in the in vitro experiments, the downregulation of TET1 was clearly induced by oncogene‐dependent cellular transformation, and loss of 5‐hmC was seen in the transformed cells. These results suggest the critical roles of aberrant DNA demethylation for oncogenic processes in solid tissues. (Cancer Sci 2012; 103: 670–676)
Patterns of DNA methylation, histone modification and chromatin structure are profoundly altered in human cancers.1, 2, 3, 4, 5 In particular, aberrant promoter hypermethylation leading to inappropriate transcriptional silencing of genes, especially tumor suppressor genes, is often found in various types of human neoplasm, including colorectal and gastric cancers.6, 7, 8, 9 DNA methylation is catalyzed by DNA methyltransferases (DNMTs), and it is reported that the increased level of DNMT1 is correlated with the histological grade or poor prognosis of human cancers.10, 11, 12 In addition, a recent report demonstrated somatic mutations in the DNMT3A gene from acute myeloid leukemia patients.13
Global loss of methylated DNA in paternal genome after fertilization suggests active DNA demethylation pathway in mammalian cells, although the molecular mechanism has been unknown for a long time. The recent discovery of ten–eleven translocation (TET) proteins those are capable of converting from 5‐methylcytosine to 5‐hydroxymethylcytosine (5‐hmC) gave a breakthrough to the epigenetic research field.14, 15, 16, 17, 18, 19 Following studies showed that the activation‐induced cytidine deaminase family convert cytosine to uracil and 5‐hmC to 5‐hydroxymethyluracil,20, 21 and that TET1 mediates further oxidation of 5‐hmC to 5‐formylcytosine and 5‐carboxylcytosine.17, 18 These reports indicate that the active DNA demethylation may be established through multiple steps generating various forms of intermediates.22
5‐hydroxymethylcytosine (5‐hmC), a proposed intermediate of DNA demethylation, is abundant in embryonic stem (ES) cells and adult neural cells.15, 23, 24, 25 Accordingly, 5‐hmC and TET proteins have been vigorously discussed from the aspect of cellular differentiation and pluripotency of ES cells.15, 23 Meanwhile, the biological significance of 5‐hmC and TETs remains elusive in human cancers. It was recently reported that myeloid cancers have the mutations of TET2 gene compromising the catalytic activity and show the lower levels of 5‐hmC.26, 27, 28, 29 In contrast, in human solid cancers, biological significance of TETs and 5‐hmC remains elusive. A recent study revealed that 5‐hmC levels were decreased in solid tumors compared to normal tissues by immunohistochemistry;30 however, there was no analysis comparing the 5‐hmC levels among matched‐pair samples.
Here, we semiquantitatively demonstrate the reduced level of 5‐hmC in human cancers by examining paired matched tissues. In addition, we found that the TET1 mRNA is suppressed under oncogene‐induced cellular transformation, resulting in loss of 5‐hmC.
Materials and Methods
Immunostaining
All procedures involving animals were approved by the institutional committee for animal research at the University of Tokyo and complied with the Guide for the Care and Use of Laboratory Animals. A frozen acetone‐fixed tumor and normal tissue arrays were purchased from BioChain (Hayward, CA, USA). Slides were treated with 2 M hydrochloric acid followed by blocking with 10% goat serum in PBS for 1 h at room temperature and incubated with primary anti‐5‐hmC polyclonal antibody (1:10 000; Active Motif, Carlsbad, CA, USA) in 1% goat serum and 0.1% Triton X‐100 in PBS at 4°C overnight, and were further labeled with secondary antibodies conjugated with Alexa 488 dyes (Invitrogen, Tokyo, Japan). Cell nuclei were counterstained with Hoechst 33342 dye (Dojindo, Kumamoto, Japan). All florescent images were taken using an Olympus AX80 microscope (Olympus, Tokyo, Japan).
Clinical human tissue samples
A total of 22 colorectal and 12 gastric adenocarcinoma samples were obtained from Motojima General Hospital (Gumma, Japan). All patients gave informed consent prior to specimen collection, and the study was approved by the medical ethics committee.
DNA samples and dot blot analysis
Genomic DNA samples were collected from frozen surgical specimens or cultured cells using a QIAamp DNA Mini Kit (Qiagen, Tokyo, Japan) according to the manufacturer's instructions. Unmethylated, 5‐mC‐DNA and 5‐hmC‐DNA standard samples were purchased from Active Motif.
Genomic DNA samples were prepared in 0.1 M NaOH and denatured at 95°C for 5 min, then placed on ice, and neutralized with 0.1 volume of 6.6 M ammonium acetate. The samples were spotted onto Hybond‐N+ nylon membrane (GE Healthcare, Tokyo, Japan), fixed with UV irradiation (Stratalinker 1800, auto crosslink‐mode; Stratagene, Tokyo, Japan), washed, blocked with 5% skim milk, and incubated with anti‐5‐hmC antibody (1:10 000) or anti‐5‐mC monoclonal antibody (5 μg/mL; Calbiochem, Tokyo, Japan) at 4°C overnight, followed by incubation with species‐specific HRP‐conjugated secondary antibody (1:2000), and dot signal was visualized with the ECL Plus chemiluminescence assay kit (GE Healthcare). To ensure equal spotting of total DNA on the membrane, the same blot was stained with 0.02% methylene blue in 0.3 M sodium acetate (pH 5.2).
Quantitative real‐time RT‐PCR
Total RNA was extracted from cells using the Fast‐Pure RNA Kit (Takara Bio, Shiga, Japan) or from clinical specimens using ISOGEN (Nippon Gene, Tokyo, Japan). Complementary DNA (cDNA) was synthesized using the ImProm II reverse transcription system (Promega, Tokyo, Japan) and then subjected to quantitative RT‐PCR with the ABI Prism 7000 Sequence Detection System (Applied Biosystems, Tokyo, Japan). The levels of gene expression were normalized in relation to that of β‐actin. The PCR primer sequences are listed in Table S1.
Mutational analysis
Mutational analysis of KRAS exon1 and BRAF exon15 were performed using PCR (primers used to amplify those loci are described in Table S2) and direct sequencing methods as described previously.31
Cell lines and lentiviral‐mediated Tet1 knockdown
NIH3T3BRAFV600E cells were generated by transfection of human BRAFV600E, as previously described.32 Lentiviral short hairpin RNA vectors were purchased from Open Biosystems (Huntsville, AL, USA). NIH3T3 cells were infected with the virus according to the manufacturer's protocol and selected by puromycin.
Basic fibroblast growth factor treatment and immunoblot analysis
NIH3T3 cells were serum‐starved for 24 h followed by basic fibroblast growth factor (bFGF; 1 μg/mL) stimulation for 30 min, and then lysed directly in Laemmli buffer. Blots were probed with anti‐phospho‐extracellular signal‐regulated kinase (Erk) 1/2 (Thr202/Tyr204) or Erk1/2 antibodies (1:1000) followed by incubation with species‐specific HRP‐conjugated secondary antibodies (1:2000). Proteins were visualized using the ECL Plus chemiluminescence assay kit (GE Healthcare). The antibodies were obtained from Cell Signaling Technology (Beverly, MA, USA).
Soft agar colony formation assay
The lower layer of 0.5% agar in DMEM was placed in a 35‐mm dish and permitted to solidify at room temperature. Then, 1.5 × 10⁴ cells were suspended in the upper layer of 0.35% agar in DMEM containing 10% calf serum. The number of colonies over 50 μm was counted at 2 weeks after plating.
Statistical analysis
The results are presented as the means ± SEM. Associations were tested using the Student t‐test and the Fisher exact test. P < 0.05 was considered statistically significant.
Results
Reduced 5‐hydroxymethylcytosine in human tumor tissues
First, to examine the specificity of the antibody against 5‐hmC, mouse liver tissues were stained with it. The signal was detected in the cell nuclei as expected, and the addition of 5‐hmC‐containing DNA to the reaction reduced the signal remarkably, indicating that the antibody specifically recognizes 5‐hmC (Fig. 1A). Then, we performed immunostaining of human tumor and normal tissues. As shown in Figure 1(B), the signal of 5‐hmC was scarcely detected in tumors compared to normal tissues, including colon, liver, brain, kidney, skeletal muscle and lung (Fig. 1B), suggesting that the loss of 5‐hmC is a common phenomenon in tumorous tissues. We showed a representative photograph indicating the difference in the level of 5‐hmC between the tumors and adjacent tissues derived from the mouse hepatic‐tumor model (Fig. S1).33
Figure 1.
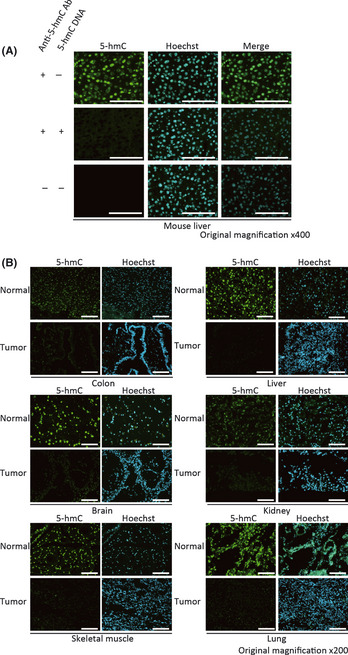
Immunostaining of 5‐hmC. Mouse liver tissues (A) and human tissue arrays (B) were stained with anti‐5‐hmC (green) antibody or Hoechst 33342 (blue). Scale bar: 100 μm.
Semiquantitative measurement of 5‐hmC in gastrointestinal cancers
To evaluate the 5‐hmC amount in many clinical specimens, the specificity of this antibody was also confirmed in blotting experiments (Fig. 2A). Serial dilution of genomic DNA extracted from mouse ES cells, in which a certain level of 5‐hmC is detected,14 were subjected to dot blot analysis. The good linearity between the signal density and DNA amount in a sufficient dynamic range supported the usefulness of this method for the quantification of 5‐hmC in genomic DNA samples (Fig. 2B). Consistent with the previous report that the amount of 5‐hmC decreases through differentiation in mouse ES cells,14 the dot blot analysis demonstrated a significant loss of 5‐hmC level in ES cells after withdrawal of leukemia inhibitory factor (LIF) (Fig. 2C).
Figure 2.
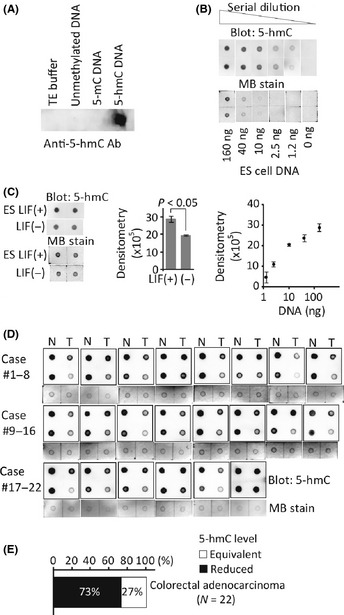
Measurement of 5‐hmC in colorectal cancers (CRCs). (A) Dot blot analysis using anti‐5hmC antibody. (B) Genomic DNA from embryonic stem (ES) cells was subjected to dot blot. Loading control is shown by the methylene blue (MB) staining. Densitometry measurements against logarithmic DNA amount were plotted. (C) Quantitative assessment of 5‐hmC in ES cell DNA (160 ng). ES cells were incubated with or without leukemia inhibitory factor (LIF) for 5 days. (D) Detection of 5‐hmC in 22 pairs of clinical CRCs (T; right column on each membrane) and adjacent non‐tumorous tissue (N; left) using dot blot. Twofold diluted DNA was also spotted in the second row on the same membrane. Loading control is shown by MB staining of undiluted DNA samples. (E) Classification of CRCs according to the 5‐hmC level.
Next, to assess the amount of 5‐hmC in colorectal cancers (CRCs), clinical samples of human CRC obtained from surgical resection (n = 22 cases) were subjected to analysis. To compare the level of 5‐hmC in tumors and the adjacent non‐tumorous tissues, undiluted and twofold diluted DNA samples were spotted on the same membrane (Figs 2D,S2A). According to the dot blotting results, we classified the tumors into three groups: “5‐hmC reduced” or “5‐hmC increased” tumors were defined when the level of 5‐hmC was 1/2‐fold decreased (Fig. S2B) or twofold increased compared to the non‐tumorous tissues, respectively. Others were classified into a “5‐hmC equivalent” group (Fig. S2C). Notably, many of the CRC tumors (72.7% [16/22]) were included in the “5‐hmC‐reduced” group, with the others in the “5‐hmC‐equivalent” group (Fig. 2E). There was no distinct clinical features in 5‐hmC‐reduced tumors; however, 63% (10/16) were located in the distal colon. These results were consistent with the finding that 5‐hmC levels commonly decrease in neoplasms (Fig. 1B). The 5‐hmC level was also reduced in the majority of gastric cancer specimens: 75% (9/12) (Fig. S3A,B).
Analysis of ten–eleven translocation (TET) and DNMT family genes expression in colorectal cancers
Given that the global level of 5‐methylcytosine (5‐mC) is frequently reduced in CRC tumors, we investigated whether the decrease in 5‐hmC is simply due to the smaller amount of substrates, 5‐mC. Then, the dot blot analysis using the anti‐5‐mC antibody was performed with the same sample sets applied to 5‐hmC quantification, based on the specificity of the anti‐5‐mC antibody (Fig. S4A). Different from 5‐hmC, the 1/2‐fold decrease of 5‐mC was detected in only 13.6% of cases (3/22), and the level of 5‐mC was equivalent in most cases (72.7% [16/22]) (Fig. S4B,C). These findings indicate that the reduction of 5‐hmC level in the CRC tumors is not always due to the lower amounts of 5‐mC.
Recent studies indicate that the TET family of proteins can catalyze the conversion of 5‐mC of DNA to 5‐hmC in mammalian cells.14, 15 We suspected that the expression patterns of TET family genes or DNMT family genes encoding DNA methyltransferases affect the 5‐hmC level in CRC samples. The expression of TET1, 2 and 3 and DNMT1, 3A and 3B was examined using quantitative real‐time PCR. When we set a cut‐off as twofold change, TET1 expression was decreased in half of the tumors (50%[11/22]) and a large part of them (73%[8/11]) demonstrated less 5‐hmC compared to the adjacent tissues (Fig. 3). We found that TET2 mRNA expression was very little both in CRC tumors and non‐tumorous tissues, and that reduced TET1 expression was tightly associated with decreased TET3 mRNA (P < 0.0006) (Table 1). In contrast, most of 5‐hmC‐reduced tumors without TET1 gene downregulation showed enhanced expression of DNMT genes (88%[7/8]) (Fig. 3). Although the reason why the upregulation of DNMT genes is associated with the loss of 5‐hmC is unknown, it is likely that various mechanisms, including suppression of TET1, affect the level of 5‐hmC in CRC tumors.
Figure 3.
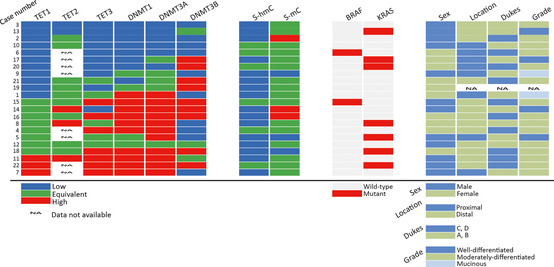
Gene expressions, presence of mutations, and covariate status of 22 colorectal cancers (CRCs). Clinicopathological and molecular factors of 22 CRCs were displayed on a heat map representing TET1,TET2,TET3,DNMT1,DNMT3A and DNMT3B gene expression, and 5‐hmC and 5‐mC levels compared to adjacent background tissues. Presence of BRAF and KRAS mutations and covariate status of each tumor are also shown. Location: site of the primary tumor. Dukes: Dukes classification of the tumor. Grade: pathological tumor grade system.
Table 1.
Correlation between TET1 gene expression and clinicopathological and molecular factors in colorectal cancer
| Characteristics |
Total n = 22 |
TET1 expression | P‐value | |
|---|---|---|---|---|
|
Downregulated n = 11 |
Upregulated/equivalent n = 11 |
|||
| Age at surgery | ||||
| Mean ± SD (years) | 65.3 ± 13.0 | 62.5 ± 13.4 | 67.8 ± 12.7 | 0.363 |
| Range (years) | 39–88 | 39–81 | 50–88 | |
| Sex, n (%) | ||||
| Male | 12 (54.5) | 5 (45.5) | 7 (63.6) | 0.392 |
| Female | 10 (45.5) | 6 (54.5) | 4 (36.4) | |
| Site of tumor, n (%) | ||||
| Proximal | 8 (38.1) | 6 (60.0) | 2 (18.2) | 0.049 |
| Distal | 13 (61.9) | 4 (40.0) | 9 (81.8) | |
| Dukes grade, n (%) | ||||
| A, B | 11 (52.4) | 6 (60.0) | 5 (45.5) | 0.505 |
| C, D | 10 (47.6) | 4 (40.0) | 6 (54.5) | |
| Tumor grade, n (%)a | ||||
| Well diff | 4 (19.0) | 2 (20.0) | 2 (18.2) | 0.916 |
| Moderately diff and mucinous | 17 (81.0) | 8 (80.0) | 9 (81.8) | |
| KRAS exon 2, n (%) | ||||
| Wild‐type | 15 (68.2) | 8 (72.7) | 7 (63.6) | 0.647 |
| Mutant | 7 (31.8) | 3 (27.3) | 4 (36.4) | |
| BRAF exon 15, n (%) | ||||
| Wild‐type | 20 (90.9) | 10 (90.9) | 10 (90.9) | 1 |
| Mutant | 2 (9.1) | 1 (9.1) | 1 (9.1) | |
| TET2 gene expression, n (%) | ||||
| Downregulated | 2 (14.3) | 2 (28.6) | 0 (0.0) | 0.127 |
| Upregulated or equivalent | 12 (85.7) | 5 (71.4) | 7 (100) | |
| TET3 gene expression, n (%) | ||||
| Downregulated | 10 (45.5) | 9 (81.8) | 1 (9.1) | 0.0006 |
| Upregulated or equivalent | 12 (54.5) | 2 (18.2) | 10 (90.9) | |
| DNMT1 gene expression, n (%) | ||||
| Downregulated | 8 (36.4) | 8 (72.7) | 0 (0.0) | 0.0004 |
| Upregulated or equivalent | 14 (63.6) | 3 (27.3) | 11 (100) | |
| DNMT3A gene expression, n (%) | ||||
| Downregulated | 7 (31.8) | 6 (54.5) | 1 (9.1) | 0.022 |
| Upregulated or equivalent | 15 (68.2) | 5 (45.5) | 10 (90.9) | |
| DNMT3B gene expression, n (%) | ||||
| Downregulated | 10 (45.5) | 6 (54.5) | 4 (36.4) | 0.392 |
| Upregulated or equivalent | 12 (54.5) | 5 (45.5) | 7 (63.6) | |
| 5‐hmC level, n (%) | ||||
| Reduced | 16 (72.7) | 8 (72.7) | 8 (72.7) | 1 |
| Equivalent | 6 (27.3) | 3 (27.3) | 3 (27.3) | |
| 5‐mC level, n (%) | ||||
| Reduced or equivalent | 19 (86.4) | 10 (90.9) | 9 (81.8) | 0.534 |
| Increased | 3 (13.6) | 1 (9.1) | 2 (18.2) | |
Tumor grade: diff, differentiated. Significant P‐values (< 0.05) are shown in bold.
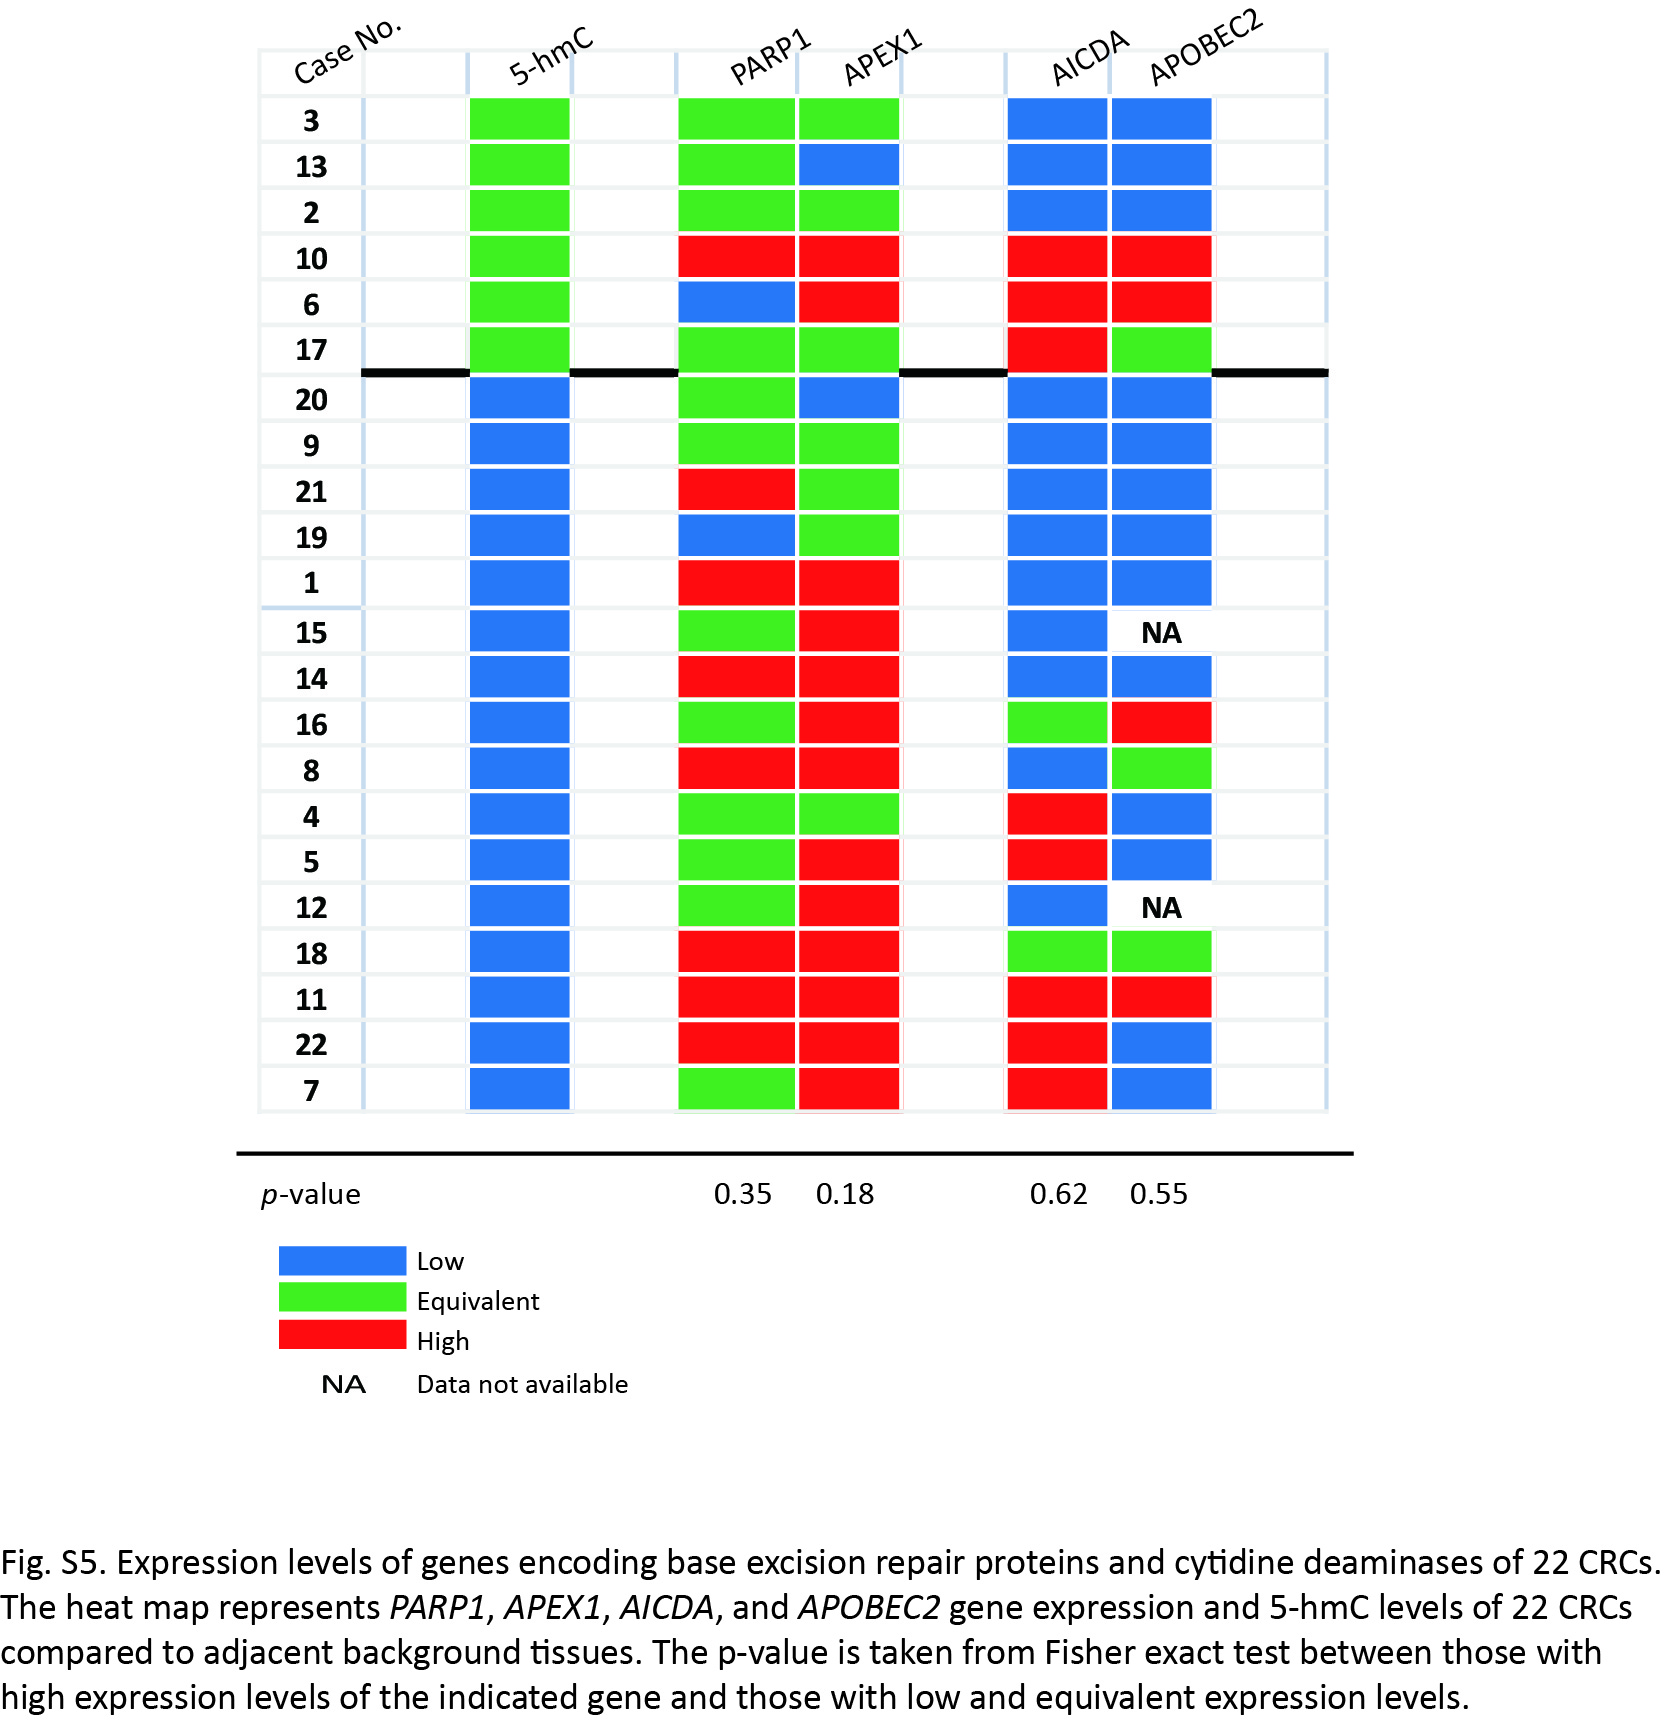
Next, we examined the expression level of genes implicated in the removal of 5‐hmC. Poly ADP‐ribose polymerase 1 (PARP1) and APEX1 are critical components of base excision repair (BER), and activation‐induced cytidine deaminase and apolipoprotein B mRNA editing enzyme, catalytic polypeptide‐like 2 (APOBEC2) are deaminases, of which overexpression are reported to enhance demethylation of 5‐hmC.20 As a result, the expression of APEX1 gene was relatively, but not statistically, high in the tumors with low levels of 5‐hmC (Fig. S5).
Reduced Tet1 expression during cellular malignant transformation
Our data in clinical samples indicated a possibility that reduced 5‐hmC is associated with malignant transformation. To address this notion, we performed an in vitro assay using NIH3T3 cells. We previously reported that the NIH3T3 cells stably expressing oncogenic BRAF (V600E) (3T3V600E cells) acquire transformation capability.32 In the 3T3V600E cells, the level of 5‐hmC was significantly decreased when compared to control cells (Fig. 4A). The expression level of Tet1, Tet2 and Tet3 was also reduced in the 3T3V600E cells compared to the control cells (Fig. 4B). To exclude the possibility that the downregulation of these genes is directly caused by the activation of MAPK signaling itself, we treated NIH3T3 cells with bFGF and analyzed the expression of Tet1 gene. As shown in Figure 4(C), the activity of MAPK was clearly enhanced by the treatment of bFGF; however, the expression of Tet1 was not affected (Fig. 4D). These findings indicated that the level of Tet1 mRNA and 5‐hmC was decreased in the process of cellular transformation in NIH3T3 cells.
Figure 4.
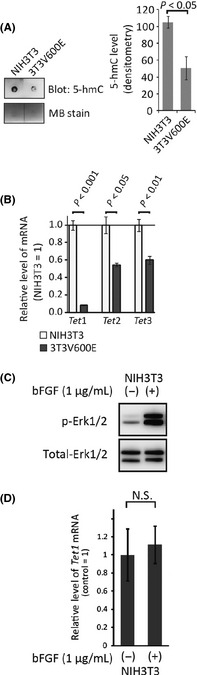
5‐hmC levels and ten–eleven translocation (TET) genes expression in transformed NIH3T3 cells. (A) Genomic DNA (20 ng) of wild‐type (NIH3T3) and transformed (3T3V600E) cells were subjected to dot blot analysis for 5‐hmC detection. Methylene blue (MB) staining is used for DNA loading control. The graph shows the average of signals of three independent experiments. (B) Quantification of Tet family genes expression using quantitative RT‐PCR in NIH3T3 cells and 3T3V600E cells. n = 3/each group. (C) Phosphorylation of Erk1/2 and (D) Tet1 gene expression in response to bFGF stimulation for 30 min on NIH3T3 cells. NS, not significant. n = 3/each group.
Reduced Tet1 expression itself is not sufficient for cellular transformation
The above data encouraged us to expect that the decrease of Tet1 plays a certain role in the mechanism of cellular transformation. Then, to examine whether the loss of Tet1 is sufficient for cellular transformation, we established Tet1 stably knockdowned NIH3T3 cells (Tet1KD NIH3T3 cells) using lentiviral‐vector shRNA (Fig. 5A). Tet1KD NIH3T3 cells showed a decreased 5‐hmC level compared to control cells (Fig. 5B). When the Tet1KD NIH3T3 cells were applied to colony formation assay, the cells did not demonstrate the colony‐forming ability (Fig. 5C), suggesting that the suppression of only Tet1 mRNA is not enough for oncogene‐induced cellular transformation.
Figure 5.
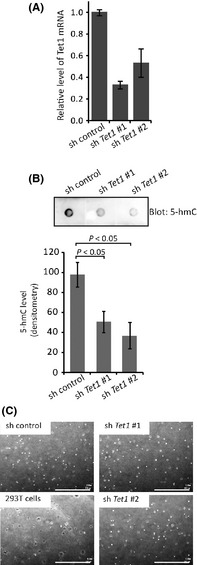
Colony formation assay on Tet1 stably knockdowned NIH3T3 cells. (A) Knockdown of Tet1 in NIH3T3 cells was confirmed at mRNA levels. (B) 5‐hmC levels in Tet1‐depleted NIH3T3 cells (sh Tet1 #1 and #2) were determined by dot blot and quantified by densitometry. n = 3/each group. (C) Neither line of Tet1‐depleted NIH3T3 cells acquired colony forming ability. 293T cells were used as positive control for colony formation. Scale bar, 1 mm.
Discussion
A previous report showed that myeloid tumors with TET2 gene mutations compromising the catalytic activity displayed lower levels of 5‐hmC when compared to bone marrow samples from healthy controls.26, 27 The finding suggests a possibility that lower 5‐hmC might be preferable for the emergence of leukemic cells. In solid tumors, one study revealed using immunohistochemistry that 5‐hmC levels were reduced in the carcinomas of prostate, breast and colon;30 however, the analysis using commercial tissue arrays did not compare the 5‐hmC level between tumors and adjacent normal tissues. Here, we provided confirmatory evidence of 5‐hmC loss in solid cancers by analyzing paired matched tissues. Also, we established the semi‐quantitative assay for 5‐hmC using dot blotting.
Based on data from HPLC, global hypomethylation of cytosine is widely accepted as a characteristic of malignancies, including CRC.1, 2 Since this study was based on the dot blot technique with a relatively narrow window of sensitivity, the difference in global 5‐mC level might be barely observed (Fig. S4B,C). Nonetheless, the difference in 5‐hmC level was obvious in most of the tumors, suggesting that loss of 5‐hmC is not just a secondary effect of global DNA hypomethylation in tumors. So far, the mutation of TET family genes abrogating the demethylating activity has not been found in solid cancers;34 however, our data suggest that there are mechanisms causing loss of 5‐hmC in solid tumors.
As a mechanism for loss of 5‐hmC in CRC, we demonstrated the downregulation of TET genes (Fig. 3 and Table 1). This is reasonable because they encode the proteins catalyzing the conversion from 5‐mC to 5‐hmC. Our data also suggest the existence of another mechanism underlying the 5‐hmC reduction because only half of CRC showed low expression of Tet mRNA. The other tumors demonstrated higher expression of DNMT genes. One possibility is that DNMT proteins functionally compete with TET proteins on DNA strands as reported.35 IDH1 and IDH2 generate α‐ketoglutarate, on which TET depend for their enzymatic activity. IDH mutations specifically produce 2‐hydroxylglutarate and impair the TET2 catalytic function in leukemic cells.36 The mutant IDH1 and IDH2 existed exclusively with TET2 loss‐of‐function mutations in acute myeloid leukemia, which suggested that the mutations of their genes are functionally similar.36, 37 Therefore, it is likely that IDH mutants, which are also found in CRC,38 induce the loss of 5‐hmC regardless of the normal level of TET genes.
In addition, we cannot exclude the possibility that elimination of 5‐hmC is enhanced by the active growth of cancer cells.22 It is possible that enhanced proliferation leads to a “passive” 5‐hmC reduction because the maintenance of methylcytosine catalyzed via DNMT1 is prevented by hydroxymethylation of the target cytosine.39 Moreover, it is reported that BER proteins and the AID/APOBEC family mediate the demethylation of 5‐hmC,20, 21 and that 5‐hmC is further oxidized to 5‐formylcytosine or 5‐carboxylcytosine by TET proteins.17, 18 We cannot exclude the possibility that the increased expression of APEX1 mRNA is implicated in the reduction of 5‐hmC in tumor cells (Fig. S5), and we intend to analyze this possibility in future research.
Our in vitro data demonstrated that TET1 was downregulated in the process of cellular transformation. Given the reports that TET1 is involved in the decision of ES cell lineage specification,15, 16 the downregulation of TET1 might achieve epigenetic profiles favorable for transformation. It is not clear whether TET function is always dependent of DNA demethylating activity. Indeed, we demonstrated that tumors with low TET expression did not always show lower 5‐hmC. It is noteworthy that TET1 directly binds to transcriptional machinery,40 and that TET can prevent DNMT activity without DNA demethylation.35 Hence, it is still unknown whether TET1 can play roles in cellular transformation in the enzymatic activity‐independent manner. Finally, the biological significance of the loss of 5‐hmC in tumors remains to be elucidated; however, loss of 5‐hmC could be a diagnostic marker for malignant transformation.
Disclosure Statement
The authors have no conflict of interest.
Supporting information
Fig. S1. Immunostaining of 5‐hmC in the genetic model of murine hepatic tumor.
Fig. S2. Definition and determination of 5‐hmC or 5‐mC level using dot blot analysis.
Fig. S3. Measurement of 5‐hmC in human gastric cancers using dot blot.
Fig. S4. Measurement of 5‐mC in colorectal cancer (CRC) using dot blot.
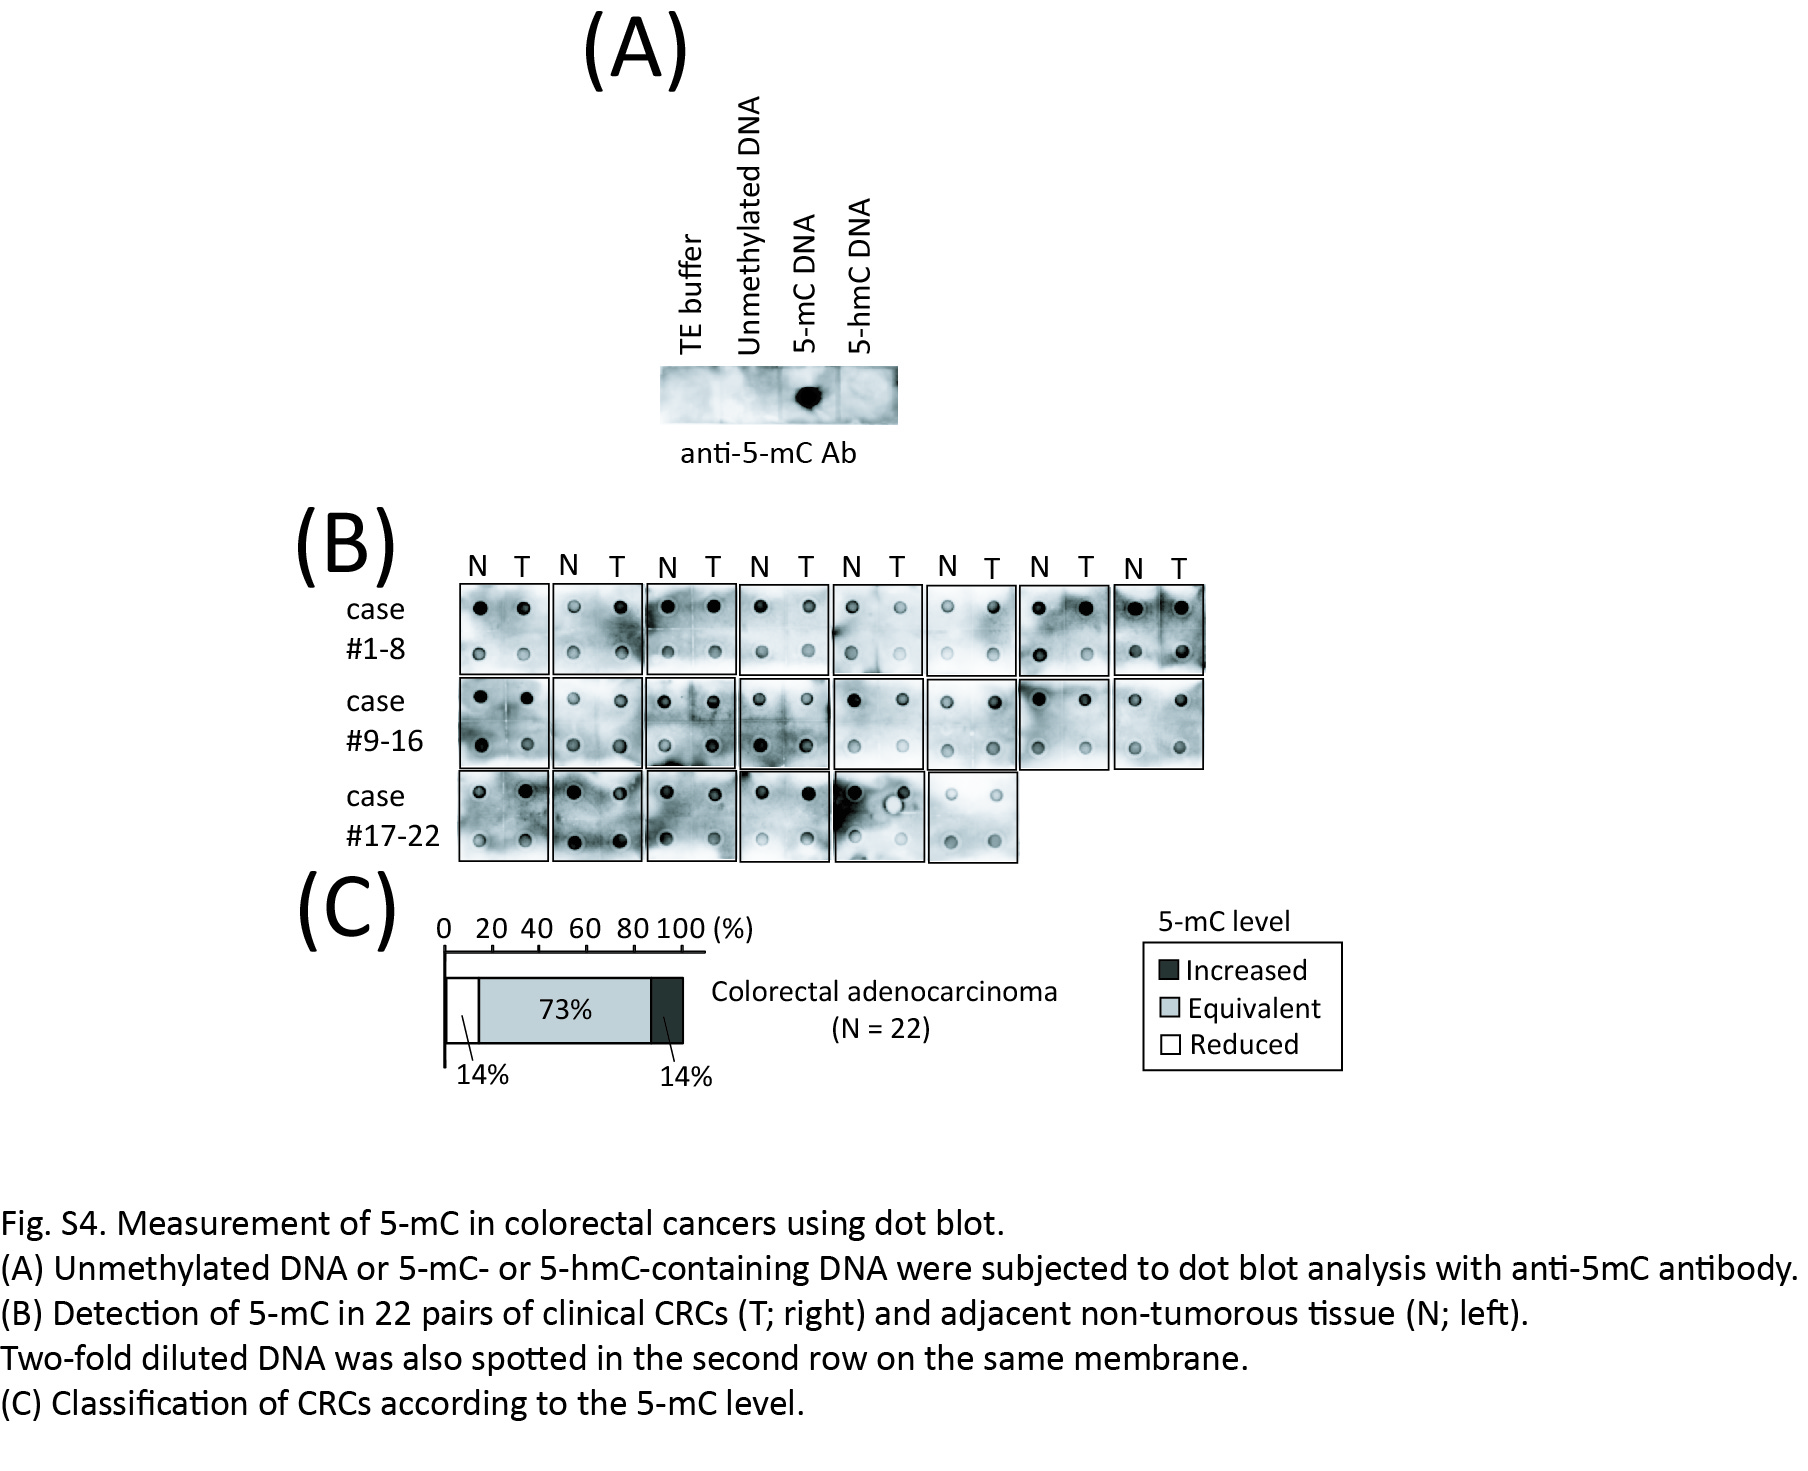
Fig. S5. Expression levels of genes encoding base excision repair proteins and cytidine deaminases of 22 colorectal cancers (CRC).
Table S1. Primer sequences for quantitative real‐time PCR analysis.
Table S2. Primers for mutational analysis.
Acknowledgments
We thank Dr Teiji Motojima (Division of Abdominal Surgery, Motojima General Hospital, Gumma, Japan) and Dr Takaaki Sano (Division of Pathology, Motojima General Hospital) for providing human tissue specimens. We also thank Mitsuko Tsubouchi of our laboratory for technical assistance.
References
- 1. Feinberg AP, Vogelstein B. Hypomethylation distinguishes genes of some human cancers from their normal counterparts. Nature 1983; 301: 89–92. [DOI] [PubMed] [Google Scholar]
- 2. Gama‐Sosa MA, Slagel VA, Trewyn RW et al The 5‐methylcytosine content of DNA from human tumors. Nucleic Acids Res 1983; 11: 6883–94. [DOI] [PMC free article] [PubMed] [Google Scholar]
- 3. Jones PA, Baylin SB. The fundamental role of epigenetic events in cancer. Nat Rev Genet 2002; 3: 415–28. [DOI] [PubMed] [Google Scholar]
- 4. Herman JG, Baylin SB. Gene silencing in cancer in association with promoter hypermethylation. N Engl J Med 2003; 349: 2042–54. [DOI] [PubMed] [Google Scholar]
- 5. Ushijima T. Detection and interpretation of altered methylation patterns in cancer cells. Nat Rev Cancer 2005; 5: 223–31. [DOI] [PubMed] [Google Scholar]
- 6. Jones PA, Laird PW. Cancer epigenetics comes of age. Nat Genet 1999; 21: 163–7. [DOI] [PubMed] [Google Scholar]
- 7. Baylin SB, Herman JG. DNA hypermethylation in tumorigenesis: epigenetics joins genetics. Trends Genet 2000; 16: 168–74. [DOI] [PubMed] [Google Scholar]
- 8. Herman JG. Hypermethylation of tumor suppressor genes in cancer. Semin Cancer Biol 1999; 9: 359–67. [DOI] [PubMed] [Google Scholar]
- 9. Ushijima T, Nakajima T, Maekita T. DNA methylation as a marker for the past and future. J Gastroenterol 2006; 41: 401–7. [DOI] [PubMed] [Google Scholar]
- 10. Sun L, Hui AM, Kanai Y, Sakamoto M, Hirohashi S. Increased DNA methyltransferase expression is associated with an early stage of human hepatocarcinogenesis. Jpn J Cancer Res 1997; 88: 1165–70. [DOI] [PMC free article] [PubMed] [Google Scholar]
- 11. Peng DF, Kanai Y, Sawada M et al Increased DNA methyltransferase 1 (DNMT1) protein expression in precancerous conditions and ductal carcinomas of the pancreas. Cancer Sci 2005; 96: 403–8. [DOI] [PMC free article] [PubMed] [Google Scholar]
- 12. Nakagawa T, Kanai Y, Saito Y, Kitamura T, Kakizoe T, Hirohashi S. Increased DNA methyltransferase 1 protein expression in human transitional cell carcinoma of the bladder. J Urol 2003; 170: 2463–6. [DOI] [PubMed] [Google Scholar]
- 13. Ley TJ, Ding L, Walter MJ et al DNMT3A mutations in acute myeloid leukemia. N Engl J Med 2010; 363: 2424–33. [DOI] [PMC free article] [PubMed] [Google Scholar]
- 14. Tahiliani M, Koh KP, Shen Y et al Conversion of 5‐methylcytosine to 5‐hydroxymethylcytosine in mammalian DNA by MLL partner TET1. Science 2009; 324: 930–5. [DOI] [PMC free article] [PubMed] [Google Scholar]
- 15. Ito S, D'Alessio AC, Taranova OV, Hong K, Sowers LC, Zhang Y. Role of Tet proteins in 5mC to 5hmC conversion, ES‐cell self‐renewal and inner cell mass specification. Nature 2010; 466: 1129–33. [DOI] [PMC free article] [PubMed] [Google Scholar]
- 16. Koh KP, Yabuuchi A, Rao S et al Tet1 and Tet2 regulate 5‐hydroxymethylcytosine production and cell lineage specification in mouse embryonic stem cells. Cell Stem Cell 2011; 8: 200–13. [DOI] [PMC free article] [PubMed] [Google Scholar]
- 17. Ito S, Shen L, Dai Q et al Tet proteins can convert 5‐methylcytosine to 5‐formylcytosine and 5‐carboxylcytosine. Science 2011; 333: 1300–3. [DOI] [PMC free article] [PubMed] [Google Scholar]
- 18. He YF, Li BZ, Li Z et al Tet‐mediated formation of 5‐carboxylcytosine and its excision by TDG in mammalian DNA. Science 2011; 333: 1303–7. [DOI] [PMC free article] [PubMed] [Google Scholar]
- 19. Ooi SK, Bestor TH. The colorful history of active DNA demethylation. Cell 2008; 133: 1145–8. [DOI] [PubMed] [Google Scholar]
- 20. Guo JU, Su Y, Zhong C, Ming GL, Song H. Hydroxylation of 5‐methylcytosine by TET1 promotes active DNA demethylation in the adult brain. Cell 2011; 145: 423–34. [DOI] [PMC free article] [PubMed] [Google Scholar]
- 21. Cortellino S, Xu J, Sannai M et al Thymine DNA glycosylase is essential for active DNA demethylation by linked deamination‐base excision repair. Cell 2011; 146: 67–79. [DOI] [PMC free article] [PubMed] [Google Scholar]
- 22. Inoue A, Zhang Y. Replication‐dependent loss of 5‐hydroxymethylcytosine in mouse preimplantation embryos. Science 2011; 334: 194. [DOI] [PMC free article] [PubMed] [Google Scholar]
- 23. Kriaucionis S, Heintz N. The nuclear DNA base 5‐hydroxymethylcytosine is present in Purkinje neurons and the brain. Science 2009; 324: 929–30. [DOI] [PMC free article] [PubMed] [Google Scholar]
- 24. Szwagierczak A, Bultmann S, Schmidt CS, Spada F, Leonhardt H. Sensitive enzymatic quantification of 5‐hydroxymethylcytosine in genomic DNA. Nucleic Acids Res 2010; 38: e181. [DOI] [PMC free article] [PubMed] [Google Scholar]
- 25. Song CX, Szulwach KE, Fu Y et al Selective chemical labeling reveals the genome‐wide distribution of 5‐hydroxymethylcytosine. Nat Biotechnol 2011; 29: 68–72. [DOI] [PMC free article] [PubMed] [Google Scholar]
- 26. Delhommeau F, Dupont S, Della Valle V et al Mutation in TET2 in myeloid cancers. N Engl J Med 2009; 360: 2289–301. [DOI] [PubMed] [Google Scholar]
- 27. Ko M, Huang Y, Jankowska AM et al Impaired hydroxylation of 5‐methylcytosine in myeloid cancers with mutant TET2. Nature 2010; 468: 839–43. [DOI] [PMC free article] [PubMed] [Google Scholar]
- 28. Moran‐Crusio K, Reavie L, Shih A et al Tet2 loss leads to increased hematopoietic stem cell self‐renewal and myeloid transformation. Cancer Cell 2011; 20: 11–24. [DOI] [PMC free article] [PubMed] [Google Scholar]
- 29. Quivoron C, Couronne L, Della Valle V et al TET2 inactivation results in pleiotropic hematopoietic abnormalities in mouse and is a recurrent event during human lymphomagenesis. Cancer Cell 2011; 20: 25–38. [DOI] [PubMed] [Google Scholar]
- 30. Haffner MC, Chaux A, Meeker AK et al Global 5‐hydroxymethylcytosine content is significantly reduced in tissue stem/progenitor cell compartments and in human cancers. Oncotarget 2011; 2: 627–37. [DOI] [PMC free article] [PubMed] [Google Scholar]
- 31. Ohta M, Seto M, Ijichi H et al Decreased expression of the RAS‐GTPase activating protein RASAL1 is associated with colorectal tumor progression. Gastroenterology 2009; 136: 206–16. [DOI] [PubMed] [Google Scholar]
- 32. Ikenoue T, Hikiba Y, Kanai F et al Functional analysis of mutations within the kinase activation segment of B‐Raf in human colorectal tumors. Cancer Res 2003; 63: 8132–7. [PubMed] [Google Scholar]
- 33. Kudo Y, Tanaka Y, Tateishi K et al Altered composition of fatty acids exacerbates hepatotumorigenesis during activation of the phosphatidylinositol 3‐kinase pathway. J Hepatol 2011; 55: 1400–8. [DOI] [PubMed] [Google Scholar]
- 34. Abdel‐Wahab O, Mullally A, Hedvat C et al Genetic characterization of TET1, TET2, and TET3 alterations in myeloid malignancies. Blood 2009; 114: 144–7. [DOI] [PMC free article] [PubMed] [Google Scholar]
- 35. Xu Y, Wu F, Tan L et al Genome‐wide regulation of 5hmC, 5mC, and gene expression by Tet1 hydroxylase in mouse embryonic stem cells. Mol Cell 2011; 42: 451–64. [DOI] [PMC free article] [PubMed] [Google Scholar]
- 36. Figueroa ME, Abdel‐Wahab O, Lu C et al Leukemic IDH1 and IDH2 mutations result in a hypermethylation phenotype, disrupt TET2 function, and impair hematopoietic differentiation. Cancer Cell 2010; 18: 553–67. [DOI] [PMC free article] [PubMed] [Google Scholar]
- 37. Prensner JR, Chinnaiyan AM. Metabolism unhinged: IDH mutations in cancer. Nat Med 2011; 17: 291–3. [DOI] [PubMed] [Google Scholar]
- 38. Yen KE, Bittinger MA, Su SM, Fantin VR. Cancer‐associated IDH mutations: biomarker and therapeutic opportunities. Oncogene 2010; 29: 6409–17. [DOI] [PubMed] [Google Scholar]
- 39. Valinluck V, Sowers LC. Endogenous cytosine damage products alter the site selectivity of human DNA maintenance methyltransferase DNMT1. Cancer Res 2007; 67: 946–50. [DOI] [PubMed] [Google Scholar]
- 40. Williams K, Christensen J, Pedersen MT et al TET1 and hydroxymethylcytosine in transcription and DNA methylation fidelity. Nature 2011; 473: 343–8. [DOI] [PMC free article] [PubMed] [Google Scholar]
Associated Data
This section collects any data citations, data availability statements, or supplementary materials included in this article.
Supplementary Materials
Fig. S1. Immunostaining of 5‐hmC in the genetic model of murine hepatic tumor.
Fig. S2. Definition and determination of 5‐hmC or 5‐mC level using dot blot analysis.
Fig. S3. Measurement of 5‐hmC in human gastric cancers using dot blot.
Fig. S4. Measurement of 5‐mC in colorectal cancer (CRC) using dot blot.
Fig. S5. Expression levels of genes encoding base excision repair proteins and cytidine deaminases of 22 colorectal cancers (CRC).
Table S1. Primer sequences for quantitative real‐time PCR analysis.
Table S2. Primers for mutational analysis.