Abstract
In most human cancers, somatic mutations have been identified in the mtDNA; however, their significance remains unclear. We recently discovered that NMuMG mouse mammary epithelial cells, when deprived of mitochondria or following inhibition of respiratory activity, undergo epithelial morphological disruption accompanied with irregular edging of E‐cadherin, the appearance of actin stress fibers, and an altered gene expression profile. In this study, using the mtDNA‐less pseudo ρ0 cells obtained from NMuMG mouse mammary epithelial cells, we examined the roles of two mitochondrial stress‐associated transcription factors, cAMP‐responsive element‐binding protein (CREB) and C/EBP homologous protein‐10 (CHOP), in the disorganization of epithelial phenotypes. We found that the expression of matrix metalloproteinase‐13 and that of GADD45A, SNAIL and integrin α1 in the ρ0 cells were regulated by CHOP and CREB, respectively. Of note, knockdown and pharmacological inhibition of CREB ameliorated the disrupted epithelial morphology. It is interesting to note that the expression of high mobility group AT‐hook 2 (HMGA2), a non‐histone chromatin protein implicated in malignant neoplasms, was increased at the protein level through the CREB pathway. Here, we reveal how the activation of the CREB/HMGA2 pathway is implicated in the repression of integrin α1 expression in HepG2 human cancer cells, highlighting the importance of the CREB/HMGA2 pathway in malignant transformation associated with mitochondrial dysfunction, thereby raising the possibility that the pathway indirectly interferes with the cell–cell adhesion structure by influencing the cell–extracellular matrix adhesion status. Overall, the data suggest that mitochondrial dysfunction potentially contributes to neoplastic transformation of epithelial cells through the activation of these transcriptional pathways.
Over the past decades, a range of somatic mutations and depletions have been identified in the mtDNA in most primary human cancers.1, 2, 3 However, the relationship between mtDNA instability and neoplastic cell development remains unclear. Recent studies with regard to mtDNA heteroplasmy in cancers have suggested that somatic mutations in mtDNA are enriched during tumorigenic processes, implying that they confer a selective advantage for the survival and growth of pre‐neoplastic cells.4, 5, 6 In other studies, several mutations in the mtDNA regions encoding polypeptides for the respiration and oxidative phosphorylation chain have been suggested to actively contribute to tumor progression and metastasis.7, 8 It is noteworthy that all such mutations are associated with increased levels of reactive oxygen species (ROS), suggesting the involvement of ROS in the development of malignant phenotypes.
Somatic mutations in mtDNA are found not only in the protein‐coding regions but also in the non‐coding regions. In human tumors, point mutations are frequently observed (39.7% of the cancerous tissues examined) in the D‐loop (non‐coding) region.3 Mutations in this region, which contains the important regulatory sequences for transcription and replication initiation, hypothetically affect the copy number and/or gene expression of the mitochondrial genome. One study supporting this assumption reports a decrease in mtDNA copy number in 17 hepatocellular carcinoma (HCC) cases out of 24 cases with somatic mutation(s) in the D‐loop region.9 Of note, instability in the mtDNA D‐loop region leading to decreased copy number has been suggested to be involved in human carcinogenesis.3 In most cases of HCC and gastric cancers, carcinogenesis is accompanied with an alteration in mitochondrial biogenesis and a repression of mtDNA replication.3, 10, 11 However, the effects of repression of mitochondrial biogenesis on tumorigenesis are poorly understood. The involvement of ROS in these processes remains an open question.
The present study examines the impact of decreased mitochondrial function on epithelial phenotypes associated with malignant transformations. We used the mtDNA‐less pseudo ρ0 cells with decreased mitochondrial function. The ρ0 state was attained by inhibiting mtDNA replication and transcription using ethidium bromide (EtBr) rather than by D‐loop mutations interfering with mtDNA replication and transcription.12 We obtained the ρ0 cells from NMuMG mouse mammary epithelial cells (NMuMG cells) and assessed their morphology and gene expression. In the ρ0 state, the typical cobblestone‐like epithelial morphology was disrupted, resulting in irregular cell–cell junctions. We also observed some alterations in gene expression, including alterations in integrin α1 (ITGA1) expression. In conclusion, we demonstrated the importance of the two mitochondrial stress‐associated transcription factors, particularly that of cAMP‐responsive element‐binding protein (CREB), in the disorganization of epithelial morphology.
Materials and Methods
Cell culture, ρ0 cell preparation and chemicals
NMuMG mouse mammary epithelial cells were obtained and maintained as described previously.13 ρ0 cells were obtained by culturing in a normal medium containing 250 ng/mL EtBr and 50 μg/mL uridine for 4–6 days.12
A panel of human cancer cell lines was maintained in DMEM (MCF‐7, A549, MDA‐MB‐231, HepG2, HOS, MIAPaca‐2, Colo205 and EJ‐1), F‐12 (Hela S3) and RPMI1640 (Lu65) supplemented with 10% FCS. A set of HCC cell lines was obtained from the Japanese Collection of Research Bioresources Bank (Osaka, Japan), and cultured in accordance with the accompanying instructions.
CREB–CREB binding protein (CBP) interaction inhibitor [N‐(4‐chlorophenyl)‐3‐hydroxy‐2‐naphthamide] was purchased from Merck KGaA (Darmstadt, Germany). Protein kinase inhibitors were obtained from Merck KGaA, except for H‐89 and LY294002, which were purchased from Sigma (St Louis, MO, USA) and LC Laboratories (Woburn, MA, USA), respectively.
Expression of shRNA
shRNA was expressed using a lentivirus vector, CS‐RfA‐ErTBsd, based on the CS‐RfA‐ETBsd plasmid and modified to include the Tet‐Off system.14 HEK293T cells were transfected with lentivirus vectors by the calcium phosphate method to obtain culture supernatants containing the lentivirus. Target cells were infected with the virus by culturing these in virus‐containing medium for 24 h. After another 24‐h incubation in the presence of doxycycline (Dox, 500 ng/mL), infected cells were selected and maintained in medium containing 10 μg/mL blasticidin for 2 days.
Antibodies and western blotting
Western blotting was performed as described previously.15 We used monoclonal antibodies to E‐cadherin, β‐catenin, p120 (BD Transduction Laboratories, Lexington, KY, USA), GAPDH (Chemicon, Temecula, CA, USA), C/EBP homologous protein‐10 or CHOP‐10 (GADD 153; Santa Cruz Biotechnology, Santa Cruz, CA, USA), and CREB (48H2; Cell Signaling, Beverly, MA, USA). Polyclonal antibodies included ZO‐1 (Zymed Laboratories, San Francisco, CA, USA), phosphor‐CREB (Ser133; Cell Signaling), high mobility group AT‐hook 2 (HMGA2) (R&D Systems, Minneapolis, MN, USA) and HMGA1 (Santa Cruz Biotechnology).
Real‐time RT‐PCR
Total RNA was extracted, and cDNA was synthesized and analyzed using methods described previously.16 The assay was performed in triplicate, and at least three independent samples were analyzed.
Attachment assay
Cells were washed, dissociated with trypsin, resuspended in the assay buffer (DMEM supplemented with 0.1% BSA), plated onto ECM‐coated wells and incubated for 20 min at 37°C. After 20–90 min, the cells were washed, fixed with 3.7% formalin, and stained with 0.5% crystal violet. An image of each well was acquired, and the number of cells was counted. The experiments were performed in triplicate and were repeated five times.
Results
Disorganized epithelial morphology in ρ0 cells
We treated NMuMG cells with EtBr for 4–6 days to obtain the ρ0 cells, as described previously.12 Interestingly, the cells were slowly flattened, and this was accompanied with obscure and disarranged cell–cell junctions concomitant with deterioration in mitochondrial activity (Fig. 1a). In particular, the cells exhibited irregular edging of E‐cadherin, and actin stress fibers were present in their cytoplasm (Fig. 1b,c). Pharmacological inhibition of respiratory activity caused a similar morphological change (Fig. S1), suggesting that interference with respiratory chain activity was the primary cause of disorganization at the cell–cell junctions. Expression levels of the cell–cell junction proteins, such as E‐cadherin and ZO‐1, were only marginally affected (Fig. 1d), whereas expression patterns of integrins (a group of cell–ECM receptors) were changed (Fig. 1e). In particular, ITGA1 mRNA expression was significantly repressed in the ρ0 cells (Fig. 1e). As described previously,12 levels of intracellular ROS were reduced along with the membrane potential in the ρ0 cells, suggesting that the involvement of ROS in the above changes was unlikely.
Figure 1.
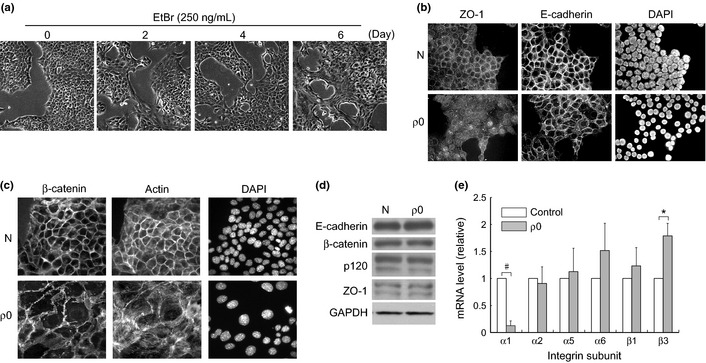
Disorganized epithelial morphology in the ρ0 cells. (a) NMuMG cells were treated with EtBr (250 ng/mL) for the indicated periods and observed by phase contrast microscopy. (b),(c) Treated cells were examined by indirect immunofluorescence labeling using specific antibodies. Actin fibers were stained with florescence‐labeled phalloidin and the nuclei with DAPI. N: Control. ρ0: 6‐day treatment with EtBr. (d) Cell lysate was examined by immunoblotting with the antibodies as indicated. GAPDH was used as the loading control. (e) Total RNA was extracted and analyzed by real‐time RT‐PCR, as described in the Materials and Methods section. The PCR products derived from each mRNA were normalized to that derived from GAPDH in the same sample and are shown as a ratio relative to the control. The difference in ITGA1 expression in control and ρ0 samples was assessed by t‐test. #P < 2 × 10⁻⁶, *P < 0.05.
Upregulation of C/EBP homologous protein‐10 and cAMP‐responsive element‐binding protein and their roles in the phenotypic disruption of ρ0 cells
We recently found a stress‐inducible transcription factor, CHOP, induced in murine myofibroblasts under conditions of mitochondrial dysfunction.16 Similarly, we found that CHOP expression was induced at the mRNA and protein levels in the NMuMG ρ0 cells (Figs S2,2a). Under the same conditions, CREB, which has been identified as a mitochondrial stress mediator in sarcoma cell lines,17 was either activated or heavily phosphorylated at Ser133 (Fig. 2b). In the current study, we assessed the roles of two transcription factors, CREB and CHOP, in epithelial cells under mitochondrial stress, focusing on their roles associated with morphological disruption.
Figure 2.
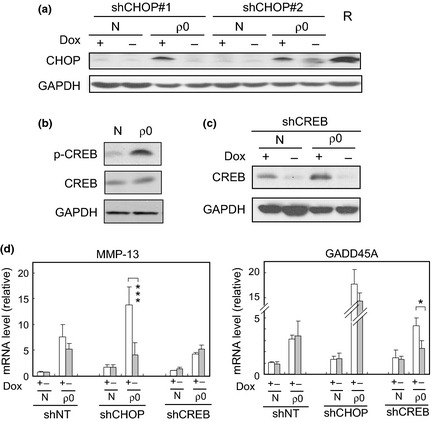
Upregulation of cAMP‐responsive element‐binding protein (CREB) and C/EBP homologous protein‐10 (CHOP) and their roles in gene expression. (a–d) Cell lysates from control (N) and EtBr‐treated cells (ρ0) (as shown in Fig. 1) with (Dox−) or without (Dox+) expression of shRNA for CHOP and CREB were subjected to immunoblotting using specific antibodies. shRNA was expressed by removal of Dox (0.5 μg/mL) from the culture medium for 48 h. R is a positive control for CHOP induction, exposed to rotenone (1 μM). In (d), total RNA extracted under the same conditions was analyzed by real‐time RT‐PCR. A ratio relative to the control (Dox+ sample of the control) is shown. shNT: negative control for shRNA (sequence was not found in mammals). *P < 0.05, ***P < 0.0005.
We established a cell line in which the expression of each transcription factor was inhibited by shRNA (using the Tet‐Off system) and observed the cellular responses following mitochondrial dysfunction. The knockdown effects of shRNA are shown in Supplementary Figure S2 (mRNA) and in Figure 2(a,c) (protein). We first studied the involvement of CREB and CHOP in gene expression in the ρ0 state, and found that induction of matrix metalloproteinase‐13 and GADD45A under mitochondrial stress was attenuated by the shRNA for CHOP and CREB, respectively (Fig. 2d).16 Of note, we observed a recovery of clear cell–cell junctions in the ρ0 cells after the knockdown of CREB (Fig. 3a). In parallel, the delocalization of E‐cadherin and ZO‐1 was alleviated under the same conditions (Fig. 3b). A low molecular weight chemical, designated CCI, interfered with the CREB–CBP interactions and was also effective in repressing the morphological disruption (Fig. 3c), thereby supporting the important role of CREB in this process. CREB was also implicated in regulating the expression of ITGA1 and zinc finger transcription factors, SNAIL and ZEB2, under conditions of mitochondrial dysfunction. In the CREB‐knockdown ρ0 cells, the originally downregulated ITGA1 expression was increased, whereas upregulated SNAIL and ZEB2 expression was decreased (Fig. 3d). These results suggest that CHOP and CREB have important functions in stress response signaling under mitochondrial dysfunction. In particular, CREB is likely to be implicated in the disruption of epithelial morphology.
Figure 3.
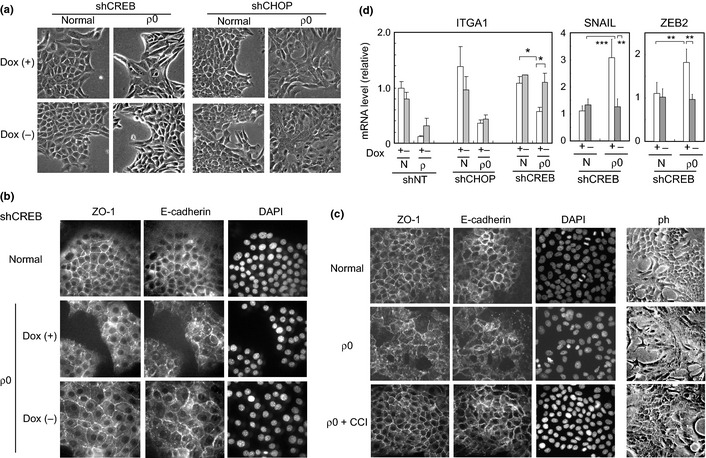
The involvement of cAMP‐responsive element‐binding protein (CREB) in the disruption of epithelial morphology. (a–c) Normal and ρ0 cells were examined by phase contrast microscopy (a) and (c) and by indirect immunofluorescence labeling (as described above) (b),(c). In (b), shRNA for CREB were expressed under Dox− conditions. DAPI stained nuclei. In (c; ρ0 + CCI), the ρ0 cells were treated with CCI [N‐(4‐chlorophenyl)‐3‐hydroxy‐2‐naphthamide)] (10 μM), a CREB‐CBP interaction inhibitor, for 48 h. (d) Total RNA from normal (N) and the ρ0 cells expressing conditional shRNA as in Figure 2 was examined by real‐time RT‐PCR, as above. A ratio relative to the control (Dox+ sample of the control) is shown. *P < 0.05, **P < 0.005, ***P < 0.0005.
High mobility group AT‐hook 2 as a downstream mediator in the cAMP‐responsive element‐binding pathway
To obtain insight into the mechanisms underlying the diverse effects of the CREB pathway ranging from gene expression to cellular morphology, we focused on HMGA2. HMGA2, a non‐histone nuclear protein with DNA binding ability, alters chromatin structure and/or interacts with several transcription factors, thereby regulating a wide range of transcriptions.18, 19 Our previous microarray analysis results (data not included) suggested that this protein is activated in the ρ0 cells. Indeed, as indicated in Figure 4(a), the protein level of HMGA2 in the ρ0 cells was elevated to the same extent as in the cells treated with transforming growth factor (TGF)‐β, a well‐known inducer of HMGA2. Of note, HMGA2 expression was mitigated by the shRNA for CREB, suggesting that HMGA2 was upregulated downstream in the CREB pathway. The effect of the shRNA was specific to the ρ0 state as the induction by TGF‐β was unaffected (Fig. 4a). CCI treatment also alleviated the induction of HMGA2 protein expression in the ρ0 cells (Fig. 4b), further supporting the important role of CREB in this process. Given that only marginal changes were observed in the mRNA levels (Fig. S3), we suggest that CREB may indirectly regulate HMGA2 expression at a post‐translational level. Supporting this view, the rate of degradation of the HMGA2 protein in the presence of cycloheximide (CHX) was lower in the ρ0 cells compared with the normal cells (Fig. 4c).
Figure 4.
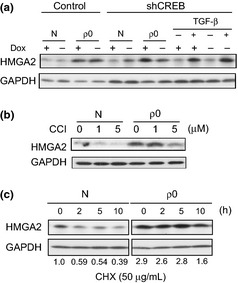
High mobility group AT‐hook 2 (HMGA2) upregulated downstream in the cAMP‐responsive element‐binding protein (CREB) pathway. (a–c) Cell lysates from control (N) and the ρ0 cells were subjected to immunoblotting using an antibody specific for HMGA2, as above. In (a), shRNA for CREB or the control was expressed under Dox− conditions. Cells were treated with TGF‐β1 (2 ng/mL) for 24 h (a; TGF‐β+), CCI at the indicated doses for 48 h (b) and cycloheximide at 50 μg/mL for the indicated times (c). Intensities of HMGA2 bands normalized to those of GAPDH are shown as ratios relative to the control (N, 0 h) at the bottom in the lower panel.
Activation of the cAMP‐responsive element‐binding protein/high mobility group AT‐hook 2 pathway in a human cancer cell line
To determine whether the CREB/HMGA2 pathway was activated in human cancer cells, 10 human cancer cell lines were examined in this study. As shown in Figure 5(a), in HepG2 cells, HMGA2 was highly expressed, and CREB appeared to be phosphorylated to a substantial level (taking the relatively low amount of the total CREB protein into account). Moreover, HMGA2 expression in HepG2 cells was sensitive to treatment with CCI, whereas the EJ‐1 line, which had no sign of CREB activation, was unaffected (Fig. 5a,c). HMGA1 was hardly detected in any of the cell lines tested in this study. Thus, we suggest that similar to the ρ0 cell model, CREB is activated, which, in turn, upregulates HMGA2 expression in HepG2 cells. Of interest, HMGA2 expression was observed along with CREB phosphorylation in five of the six HCC cell lines (Fig. 5b), suggesting that activation of the CREB/HMGA2 cascade is a prevalent trait in HCC.
Figure 5.
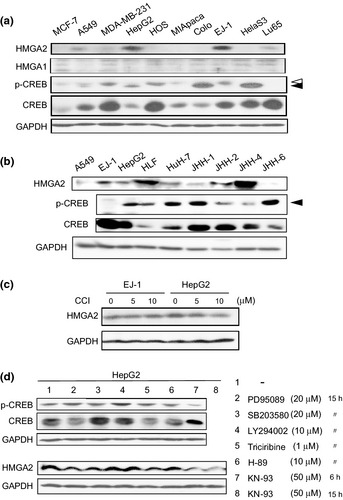
The cAMP‐responsive element‐binding protein (CREB)/high mobility group AT‐hook 2 (HMGA2) pathway activated in a human cancer cell line. (a) Cell lysates prepared from the human cancer cell lines (Materials and Methods) were studied to determine the expression levels of HMGA2, HMGA1, CREB (total) and p‐CREB (phosphorylated form) by immunoblotting with the specific antibodies. A solid arrowhead indicates ser‐133 phosphorylated CREB, and an empty arrowhead indicates nonspecific bands. (b) Cell lysates from HCC cell lines were processed as in (a). (c) HepG2 and EJ‐1 cells were treated with CCI at the indicated doses for 48 h, and the cell lysates were then subjected to immunoblotting. (d) HepG2 cells treated with a panel of protein kinase inhibitors (PD95089: MEK1/2, SB203580: p38MAPK, LY294002: PI3K, Triciribine: Akt1/2/3, H‐89: PKA, and KN‐93: CaMKII), as indicated, were lysed and examined by immunoblotting. Consistent with the decrease in phosphorylated CREB, double bands of CREB become single after treatment with KN‐93.
The similarity between the results for the ρ0 and HepG2 cells suggests a mitochondrial dysfunction underlying the activation of the CREB/HMGA2 pathway in HepG2 cells. In support of this notion, a recent study identified a pathogenic mtDNA mutation in HepG2 cells that resulted in reduced activity of respiratory complex I.20 We reinforce the involvement of mitochondrial stress signaling in the activation of CREB by demonstrating the involvement of calcium/calmodulin (CaM) kinase. In an earlier study, this kinase was identified as an activator of CREB under conditions of mitochondrial dysfunction.17 As shown in Figure 5(d), when HepG2 cells were treated with a panel of kinase inhibitors, only KN‐93, an inhibitor of CaM kinase, significantly decreased the level of CREB phosphorylation. This inhibitor also decreased HMGA2 expression in HepG2 cells (Fig. 5d). It should be noted that mutations were also found in the mtDNA of the other HCC, particularly in the D‐loop region, which is a mutational hotspot (Motoko Shibanuma, unpublished data, 2012).
We also attempted to define the biological roles of the CREB/HMGA2 pathway in HepG2 cells. Unlike in the ρ0 cells derived from NMuMG cells, CREB was unlikely to play a role in the gene expression of GADD45A, SNAIL and ZEB2, as well as in the subcellular distribution of E‐cadherin and ZO‐1 in this fully malignant human cancer cell line (data not shown). Only the expression of ITGA1 was dependent on the CREB/HMGA2 pathway. Treatment with both CCI and siRNA for HMGA2 (Fig. S4) caused an increase in ITGA1 expression (Fig. 6a). This suggests that in HepG2 cells, the activated CREB pathway mediates the downregulation of ITGA1 through the upregulation of HMGA2. In EJ‐1 cells, the level of ITGA1 was also increased by inhibiting HMGA2, but no such effect was observed with CCI (Fig. 6a). This observation is consistent with the above results suggesting that the expression of HMGA2 in EJ‐1 cells was regulated by mechanisms unrelated to CREB (Fig. 5b).
Figure 6.
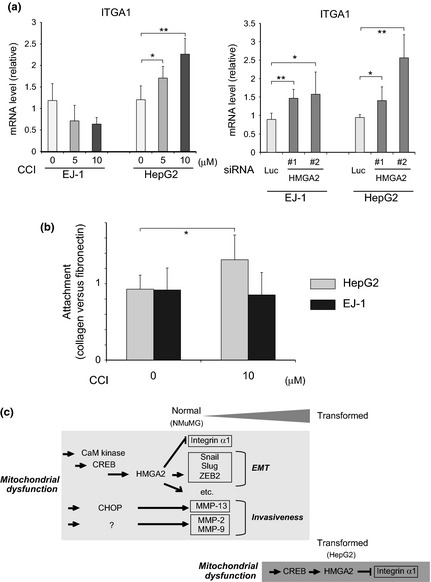
The cAMP‐responsive element‐binding protein (CREB)/high mobility group AT‐hook 2 (HMGA2) pathway decreases ITGA1 expression in HepG2 cells. (a) HepG2 and EJ‐1 cells were treated with CCI at the indicated doses for 20 h or with siRNA for HMGA2 (50 nM for 48 h) and examined by real‐time RT‐PCR to determine ITGA1 expression. The knockdown effects of the HMGA2 siRNA are shown in Figure S1c. A ratio relative to the control is shown. *P < 0.05, **P < 0.005. (b) Cells pretreated with CCI for 48 h were dissociated, plated onto collagen‐coated and fibronectin‐coated wells, and processed for the attachment assay, as described in the Materials and Methods section. A ratio of the cell number in the collagen‐coated wells to that in fibronectin‐coated wells is shown. *P < 0.05. (c) Contribution of mitochondrial dysfunction to malignant transformation of epithelial cells. Mitochondrial dysfunction propagated stress signaling by activating CREB‐mediated and C/EBP homologous protein‐10 (CHOP)‐mediated transcriptional networks. HMGA2 played an intermediary role in the CREB pathway and regulated a variety of transcriptional activities downstream. In non‐transformed NMuMG mouse mammary epithelial cells, the epithelial–mesenchymal transition (EMT) regulators and ITGA1 were regulated downstream of HMGA2. Together with previous findings.12 the cascades and their targets that potentially contribute to neoplastic transformation are shown. In the HepG2‐transformed cancer cell line, the CREB/HMGA2 axis is suggested to be active in regulating the expression of ITGA1, but not the EMT (see text). **P < 0.005, ***P < 0.00005.
Finally, we studied the effect of CREB/HMGA2 pathway activation on the cellular phenotypes of HepG2 cells. Keeping in mind the important role of the pathway in the expression of ITGA1, a subunit of cell adhesion receptors specific to collagen, we examined the attachment phenotype of HepG2 cells. We compared cell attachment to collagen and fibronectin with and without CCI. We found that the attachment preference of HepG2 cells was shifted in favor of collagen following CCI interference in CREB function (Fig. 6b); this is consistent with the observed recovery of ITGA1 expression (Fig. 6a).
Discussion
In general, lesions in the mtDNA coding or non‐coding regions result in deficiencies in the respiratory chain. In a defective respiratory chain, aberrant ROS production often occurs as a result of leakage of electrons to oxygen, and, consequently, a catastrophic cycle of respiratory function dysregulation is created because of additional mutations caused by ROS.21 During such a cycle, the cells are continuously exposed to ROS and are either at a risk of developing oncogenic somatic mutations, thereby activating the oncogenic pathways, or are at risk of increased genome instability. Thus, the aberrant production of ROS possibly accounts for some of the effects of mtDNA mutations on tumorigenesis, especially in the initial stages.
In the final phase of respiratory chain deficiency, however, mitochondria are assumed to be completely deprived of their ROS‐producing capability, regardless of the formation of the catastrophic cycle.12 In this phase, the impact of ROS and their signals presumably subsides. Instead, stress signals are likely to be elicited due to the sensing of the loss of normal mitochondrial functions. A recent study described such a stress response to mitochondrial dysfunction that was mediated by stress‐inducible transcription factors, including CHOP16 and CREB.17 Hypoxia‐inducible factor‐1 α signaling, which requires mitochondria‐derived ROS, appears to be dormant in the ρ0 cells.22
In the present study, we explored the potential contribution of mitochondrial dysfunction in tumorigenesis as a stress modulating intracellular signaling during the later stages of the process. It is noteworthy that the incidence of somatic mutations in the D‐loop of mtDNA is increased in late stage rather than early stage cancers.3 At the onset of neoplastic transformation in cells harboring mtDNA mutation(s), ROS are expected to be the dominant mutagens. However, we reasoned that in the resulting pre‐neoplastic cells, stress signaling activated by decreased mitochondrial function would play an increased role in tumorigenic progression. In the present study, we observed changes in cell–cell junction structures as well as altered gene expression in the ρ0 cells, and characterized the roles of the CHOP and CREB mitochondrial stress mediators in altering the cellular phenotypes. This is the first report to evaluate the impact of mitochondrial dysfunction on epithelial morphology; cells of mesenchymal origin and fully transformed cancer cells have been studied previously.16, 17, 23
The mechanisms by which CREB and CHOP are upregulated under ρ0 conditions remain an open question. Based on our previous study, ROS are unlikely to be involved in signaling.12 Indeed, the phosphorylation of CREB was insensitive to an antioxidant, N‐acetylcysteine (Motoko Shibanuma, unpublished data, 2012). The involvement of an unfolded protein response, which is a major stress inducing CHOP, is also unlikely.16 Instead, perturbed intracellular calcium distribution is the most likely mechanism.24 Mitochondria are implicated in intracellular calcium storage and homeostasis together with the endoplasmic reticulum (ER). In addition, they are physically associated, and the transport of calcium from one organelle to the other is highly efficient. In a previous report, ER calcium depletion and the consequent increase in the cytosolic fraction were shown to, respectively, induce CHOP and activate CREB.25 The inhibition of CREB phosphorylation by a CaM kinase inhibitor supports a similar involvement of calcium signaling in ρ0 cells (Fig. 5d).
Our findings revealed the critical role of CREB in the disorganization of epithelial phenotypes because of decreased mitochondrial functioning. The detailed mechanisms whereby the architecture of the cell–cell junctions of the ρ0 cells was disorganized downstream in the CREB pathway remain unclear. ATP depletion has been associated with disordered cell–cell adhesion.26 The upregulation of the SNAIL family members SNAIL, ZEB2 and SLUG16 may have contributed to this process through the induction of the epithelial–mesenchymal transition (EMT), as has been reported in some cases of adenocarcinoma.27 However, E‐cadherin, an EMT regulator target, remained highly expressed, and so activation of EMT was unlikely in the ρ0 state. In other studies, depletion of mtDNA has also been associated with tumorigenic phenotypes, although, again, the detailed mechanisms remain unclear.27, 28, 29, 30, 31, 32
Unexpectedly and interestingly, our study revealed a close relationship between CREB and HMGA2, namely, CREB regulation of HMGA2 expression, implying the existence of a novel transcriptional network organized by CREB and downstream HMGA2. HMGA2 is an oncofetal protein that is frequently amplified, rearranged and overexpressed in multiple human cancers,18, 19 and it is causally related to neoplastic cell transformation.33, 34 In this study, we originally identified ITGA1 as a potential transcriptional target of HMGA2. Given the possible interplay between cell–cell and cell–ECM adhesions, it is likely that the disorganized epithelial morphology that arises following mitochondrial dysfunction stems from a change in ITGA1 expression downstream in the CREB/HMGA2 cascade, which indirectly interferes with cell–cell adhesion structures by influencing cell–ECM adhesion status. Chen et al.35 report that ITGA1 serves as a negative regulator of epidermal growth factor receptor (EGFR) activity. This observation raises another interesting possibility that EGFR signaling, augmented by the repression of ITGA1 expression, is a primary cause of the disorganized epithelial structures in the ρ0 cells. Future studies should address the roles of the CREB/HMGA2 pathway in neoplastic transformation in more detail. The hypothetical contribution of mitochondrial dysfunction to malignant transformation in epithelial cells is illustrated in Figure 6(c), highlighting the roles of the CREB/HMGA2 pathway and the CHOP‐mediated transcriptional cascade.
We suggest that the CREB/HMGA2 pathway operates not only in the ρ0 model but also in HepG2 human cancer cells. However, we also noticed a difference between HepG2 and NMuMG ρ0 model cells. For example, activation of the CHOP pathway was not detected in the human cancer cell lines studied (data not shown). Moreover, SNAIL and ZEB2 were not regulated by the CREB/HMGA2 pathway in HepG2 cells. Given that HMGA2 is an architectural nuclear factor modulating transcription through interaction with DNA and/or canonical transcription factors, the difference may be ascribed to the profiles of the transcription factors present in cells.
Interestingly, among cancerous tissues, HCC is characterized by a high number of mutations in the D‐loop (42.6% of HCC carry the mutations) and a decreased mtDNA copy number (57.4%).3 Accordingly, the CREB/HMGA2 pathway deserves further research as a potential therapeutic target against HCC and other cancers that feature activated mitochondrial stress signaling.
Disclosure Statement
The authors have no conflict of interest to declare.
Supporting information
Fig. S1. Disorganization of epithelial morphology caused by respiratory chain interference.
Fig. S2. Knockdown of C/EBP homologous protein‐10 (CHOP) and cAMP‐responsive element‐binding protein (CREB) with shRNA.
Fig. S3. mRNA levels of HMGA2 in normal and ρ0 cells.
Fig. S4. Knockdown of HMGA2 with siRNA. EJ‐1 and HegG2 cells were treated with siRNA (50 nM) for two kinds of HMGA2 (#1, #2) and luciferase (control) for 48 h, and mRNA levels were examined by real‐time RT‐PCR.
Acknowledgments
We thank Ms A. Kanno, Ms R. Miura, and Ms K. Mogi for contributing to this study as part of their bachelor degrees. This study was supported in part by a Grant‐in‐Aid for Scientific Research (C) (21570205), a grant from the High‐Technology Research Center Project from the Ministry for Education, Culture, Sports, Science and Technology (MEXT) of Japan, and also by MEXT‐Supported Program for the Strategic Research Foundation at Private Universities, 2010–2012.
Cancer Sci, doi: 10.1111/j.1349‐7006.2012.02369.x, 2012
References
- 1. Chatterjee A, Dasgupta S, Sidransky D. Mitochondrial subversion in cancer. Cancer Prev Res (Phila) 2011; 4: 638–54. [DOI] [PMC free article] [PubMed] [Google Scholar]
- 2. Chatterjee A, Mambo E, Sidransky D. Mitochondrial DNA mutations in human cancer. Oncogene 2006; 25: 4663–74. [DOI] [PubMed] [Google Scholar]
- 3. Lee HC, Yin PH, Lin JC et al Mitochondrial genome instability and mtDNA depletion in human cancers. Ann N Y Acad Sci 2005; 1042: 109–22. [DOI] [PubMed] [Google Scholar]
- 4. He Y, Wu J, Dressman DC et al Heteroplasmic mitochondrial DNA mutations in normal and tumour cells. Nature 2010; 464: 610–4. [DOI] [PMC free article] [PubMed] [Google Scholar]
- 5. Mambo E, Gao X, Cohen Y, Guo Z, Talalay P, Sidransky D. Electrophile and oxidant damage of mitochondrial DNA leading to rapid evolution of homoplasmic mutations. Proc Natl Acad Sci U S A 2003; 100: 1838–43. [DOI] [PMC free article] [PubMed] [Google Scholar]
- 6. Polyak K, Li Y, Zhu H et al Somatic mutations of the mitochondrial genome in human colorectal tumours. Nat Genet 1998; 20: 291–3. [DOI] [PubMed] [Google Scholar]
- 7. Petros JA, Baumann AK, Ruiz‐Pesini EJ et al mtDNA mutations increase tumorigenicity in prostate cancer. Proc Natl Acad Sci U S A 2005; 102: 719–24. [DOI] [PMC free article] [PubMed] [Google Scholar]
- 8. Zhou S, Kachhap S, Sun W et al Frequency and phenotypic implications of mitochondrial DNA mutations in human squamous cell cancers of the head and neck. Proc Natl Acad Sci U S A 2007; 104: 7540–5. [DOI] [PMC free article] [PubMed] [Google Scholar]
- 9. Lee HC, Li SH, Lin JC, Wu CC, Yeh DC, Wei YH. Somatic mutations in the D‐loop and decrease in the copy number of mitochondrial DNA in human hepatocellular carcinoma. Mutat Res 2004; 547: 71–8. [DOI] [PubMed] [Google Scholar]
- 10. Nomoto S, Sanchez‐Cespedes M, Sidransky D. Identification of mtDNA mutations in human cancer. Methods Mol Biol 2002; 197: 107–17. [DOI] [PubMed] [Google Scholar]
- 11. Nomoto S, Yamashita K, Koshikawa K, Nakao A, Sidransky D. Mitochondrial D‐loop mutations as clonal markers in multicentric hepatocellular carcinoma and plasma. Clin Cancer Res 2002; 8: 481–7. [PubMed] [Google Scholar]
- 12. Shibanuma M, Inoue A, Ushida K et al Importance of mitochondrial dysfunction in oxidative stress response: a comparative study of gene expression profiles. Free Radic Res 2011; 45: 672–80. [DOI] [PubMed] [Google Scholar]
- 13. Kanome T, Itoh N, Ishikawa F et al Characterization of Jumping translocation breakpoint (JTB) gene product isolated as a TGF‐beta1‐inducible clone involved in regulation of mitochondrial function, cell growth and cell death. Oncogene 2007; 26: 5991–6001. [DOI] [PubMed] [Google Scholar]
- 14. Suga H, Kadoshima T, Minaguchi M et al Self‐formation of functional adenohypophysis in three‐dimensional culture. Nature 2011; 480: 57–62. [DOI] [PubMed] [Google Scholar]
- 15. Ishikawa F, Nose K, Shibanuma M. Downregulation of hepatocyte nuclear factor‐4alpha and its role in regulation of gene expression by TGF‐beta in mammary epithelial cells. Exp Cell Res 2008; 314: 2131–40. [DOI] [PubMed] [Google Scholar]
- 16. Ishikawa F, Akimoto T, Yamamoto H et al Gene expression profiling identifies a role for CHOP during inhibition of the mitochondrial respiratory chain. J Biochem 2009; 146: 123–32. [DOI] [PubMed] [Google Scholar]
- 17. Arnould T, Vankoningsloo S, Renard P et al CREB activation induced by mitochondrial dysfunction is a new signaling pathway that impairs cell proliferation. EMBO J 2002; 21: 53–63. [DOI] [PMC free article] [PubMed] [Google Scholar]
- 18. Fusco A, Fedele M. Roles of HMGA proteins in cancer. Nat Rev Cancer 2007; 7: 899–910. [DOI] [PubMed] [Google Scholar]
- 19. Cleynen I, Van de Ven WJ. The HMGA proteins: a myriad of functions (Review). Int J Oncol 2008; 32: 289–305. [PubMed] [Google Scholar]
- 20. Gao W, Xu K, Li P, Tang B. Functional roles of superoxide and hydrogen peroxide generated by mitochondrial DNA mutation in regulating tumorigenicity of HepG2 cells. Cell Biochem Funct 2011; 29: 400–7. [DOI] [PubMed] [Google Scholar]
- 21. Ralph SJ, Rodriguez‐Enriquez S, Neuzil J, Saavedra E, Moreno‐Sanchez R. The causes of cancer revisited: “Mitochondrial malignancy” and ROS‐induced oncogenic transformation – Why mitochondria are targets for cancer therapy. Mol Aspects Med 2010; 31: 145–70. [DOI] [PubMed] [Google Scholar]
- 22. Chandel NS, McClintock DS, Feliciano CE et al Reactive oxygen species generated at mitochondrial complex III stabilize hypoxia‐inducible factor‐1alpha during hypoxia: a mechanism of O2 sensing. J Biol Chem 2000; 275: 25130–8. [DOI] [PubMed] [Google Scholar]
- 23. Amuthan G, Biswas G, Ananadatheerthavarada HK, Vijayasarathy C, Shephard HM, Avadhani NG. Mitochondrial stress‐induced calcium signaling, phenotypic changes and invasive behavior in human lung carcinoma A549 cells. Oncogene 2002; 21: 7839–49. [DOI] [PubMed] [Google Scholar]
- 24. Biswas G, Adebanjo OA, Freedman BD et al Retrograde Ca2+ signaling in C2C12 skeletal myocytes in response to mitochondrial genetic and metabolic stress: a novel mode of inter‐organelle crosstalk. EMBO J 1999; 18: 522–33. [DOI] [PMC free article] [PubMed] [Google Scholar]
- 25. Copanaki E, Schurmann T, Eckert A et al The amyloid precursor protein potentiates CHOP induction and cell death in response to ER Ca2+ depletion. Biochim Biophys Acta 2007; 1773: 157–65. [DOI] [PubMed] [Google Scholar]
- 26. Tsukamoto T, Nigam SK. Tight junction proteins form large complexes and associate with the cytoskeleton in an ATP depletion model for reversible junction assembly. J Biol Chem 1997; 272: 16133–9. [DOI] [PubMed] [Google Scholar]
- 27. Naito A, Cook CC, Mizumachi T et al Progressive tumor features accompany epithelial‐mesenchymal transition induced in mitochondrial DNA‐depleted cells. Cancer Sci 2008; 99: 1584–8. [DOI] [PMC free article] [PubMed] [Google Scholar]
- 28. Kulawiec M, Arnouk H, Desouki MM, Kazim L, Still I, Singh KK. Proteomic analysis of mitochondria‐to‐nucleus retrograde response in human cancer. Cancer Biol Ther 2006; 5: 967–75. [DOI] [PubMed] [Google Scholar]
- 29. Kulawiec M, Safina A, Desouki MM et al Tumorigenic transformation of human breast epithelial cells induced by mitochondrial DNA depletion. Cancer Biol Ther 2008; 7: 1732–43. [DOI] [PMC free article] [PubMed] [Google Scholar]
- 30. van Waveren C, Sun Y, Cheung HS, Moraes CT. Oxidative phosphorylation dysfunction modulates expression of extracellular matrix–remodeling genes and invasion. Carcinogenesis 2006; 27: 409–18. [DOI] [PMC free article] [PubMed] [Google Scholar]
- 31. Mambo E, Chatterjee A, Xing M et al Tumor‐specific changes in mtDNA content in human cancer. Int J Cancer 2005; 116: 920–4. [DOI] [PubMed] [Google Scholar]
- 32. Xing J, Chen M, Wood CG et al Mitochondrial DNA content: its genetic heritability and association with renal cell carcinoma. J Natl Cancer Inst 2008; 100: 1104–12. [DOI] [PMC free article] [PubMed] [Google Scholar]
- 33. Wood LJ, Maher JF, Bunton TE, Resar LM. The oncogenic properties of the HMG‐I gene family. Cancer Res 2000; 60: 4256–61. [PubMed] [Google Scholar]
- 34. Di Cello F, Hillion J, Hristov A et al HMGA2 participates in transformation in human lung cancer. Mol Cancer Res 2008; 6: 743–50. [DOI] [PMC free article] [PubMed] [Google Scholar]
- 35. Chen X, Abair TD, Ibanez MR et al Integrin alpha1beta1 controls reactive oxygen species synthesis by negatively regulating epidermal growth factor receptor‐mediated Rac activation. Mol Cell Biol 2007; 27: 3313–26. [DOI] [PMC free article] [PubMed] [Google Scholar]
Associated Data
This section collects any data citations, data availability statements, or supplementary materials included in this article.
Supplementary Materials
Fig. S1. Disorganization of epithelial morphology caused by respiratory chain interference.
Fig. S2. Knockdown of C/EBP homologous protein‐10 (CHOP) and cAMP‐responsive element‐binding protein (CREB) with shRNA.
Fig. S3. mRNA levels of HMGA2 in normal and ρ0 cells.
Fig. S4. Knockdown of HMGA2 with siRNA. EJ‐1 and HegG2 cells were treated with siRNA (50 nM) for two kinds of HMGA2 (#1, #2) and luciferase (control) for 48 h, and mRNA levels were examined by real‐time RT‐PCR.


