

Abstract
Class A scavenger receptor member 5 (SCARA5) is a new member of the Class A scavenger receptors that has been proposed recently as a novel candidate tumor suppressor gene in human hepatocellular carcinoma. In the present study, we found that SCARA5 expression was frequently downregulated in various cancer cell lines and tumor samples. In addition, upregulation of SCARA5 expression in human cancer cell line (U251) led to a significant decrease in cell proliferation, clone formation, migration, and invasion in vitro. Furthermore, systemic treatment of tumor‐bearing mice with SCARA5–cationic liposome complex not only reduced the growth of subcutaneous human glioma tumors, but also markedly suppressed the spontaneous formation of lung metastases. Similar results were obtained in another experiment using mice bearing experimental A549 lung metastases. Compared with the untreated control group, mice treated with SCARA5 exhibited reductions in both spontaneous U251 and experimental A549 lung metastases rates of 77.3% and 70.2%, respectively. Western blot analysis was used to explore the molecular mechanisms involved and revealed that SCARA5 physically associated with focal adhesion kinase. Interestingly, upregulation of SCARA5 inactivated signal transducer and activator of transcription 3, as well as downstream signaling including cyclinB1, cyclinD1, AKT, survivin, matrix metalloproteinase‐9 and vascular endothelial growth factor‐A. Overall, the findings of the present study provide the first evidence that SCARA5 might be a promising target for the development of new antimetastatic agents for the gene therapy of cancer.
Cancer is a major public health problem in worldwide. Although surgery, radiation therapy, and chemotherapy can eliminate primary tumors, these conventional treatments only lead to temporary control of the disease.1, 2 Metastases remain the fundamental cause of cancer deaths.3 Numerous studies4 have shown that metastases are passively controlled by tumor suppressor genes whose function occurred concurrent with inhibited tumorigenicity as well. However, to date only a few genes had been identified that clearly meet controlled metastases and diminished tumorigenicity (e.g. KAI ‐1 [the product of which is a member of the transmembrane‐4 superfamily and is a suppressor of metastasis], Gelsolin and SERPINB5 [the serine proteinase inhibitor family which contains a flexible reactive site loop that interacts with, and is cleaved by the target proteinase]).4
Class A scavenger receptor member 5 (SCARA5) is expressed on the plasma membrane of selected epithelial cells of the testis, trachea, lung, bladder, and small intestine,5 and has been found to bind serum ferritin and to be involved in iron delivery.6 Recently, Huang et al.7 showed that upregulation of SCARA5 expression suppresses hepatocellular carcinoma (HCC) tumorigenesis and metastasis through the focal adhesion kinase (FAK) signaling pathway in MHCC‐LM3 cells. However, whether upregulated SCARA5 expression can contribute to the treatment of tumors remains unclear. Because FAK plays a significant role in cell survival, migration, and invasion,8 we speculated that SCARA5 may be a potential target for effective gene therapy.
In the present study, the methylation status of SCARA5 was evaluated in 10 cancer cell lines and immunohistochemical staining was performed to investigate SCARA5 expression in two tissue arrays, namely glioma tissue and non‐small cell lung cancer (NSCLC) tissue. We also examined the therapeutic effects of SCARA5 in a U251 tumor‐bearing mouse model by evaluating tumor growth and metastasis in vivo, and analyzed the effects of SCARA5 on the cell cycle, apoptosis, migration, invasion, and angiogenesis in vitro. Finally, we evaluated the therapeutic effects of SCARA5 in an experimental A549 lung metastasis model in vivo, as well as its effects on the cell proliferation and apoptosis of A549 cells.
Materials and Methods
Cell lines
Human glioma U251 and U87 cells, human embryonic kidney (HEK)‐293 cells, human colon cancer SW620 cells, human breast carcinoma MDA‐MB‐231 and MDA‐MB‐435s cells, human hepatic carcinoma HepG2 and SK‐hep‐1 cells, human ovarian carcinoma HO‐8910 cells, and human prostate cancer DU145 cells (American Tissue Culture Collection [ATCC], Rockville, MD, USA) were cultured in DMEM supplemented with 10% FBS. Human pulmonary epithelial A549 and NCI‐H460 cells (ATCC) were grown in RPMI‐1640 supplemented with 10% FBS at 37°C in a humidified incubator containing 5% CO2 and 95% air. The HUVEC used in the present study were isolated from human umbilical cord veins using a standard procedure, as described previously,9 and were grown in EBM‐2 medium with Single Quots (Lonza, Walkersville, MD, USA) containing vascular endothelial growth factor (VEGF) and other growth factors.
Reverse transcription–polymerase chain reaction
Total RNA was extracted from cells and tumors using Trizol reagent (Invitrogen, Carlsbad, CA, USA) according to the manufacturer's instructions. The mRNA expression of SCARA5 was detected by RT‐PCR using the following primer pair: 5′‐CTG CTG GTC TTC CTG ATT CTT GTG‐3′ (forward) and 5′‐TGC CTT CCT TTC CTT CAT CCC‐3′ (reverse). The product length was 766 bp and the annealing temperature was 61°C with 30 cycles.
Preparation of DNA and methylation‐specific PCR
Genomic DNA was extracted from cells using a Wizard Genomic DNA Purification Kit (Promega, San Luis Obispo, CA, USA). Bisulfite modification of the genomic DNA was performed according to the protocol provided with the BisulDream–Methylation Universal Kit (Qiwu Bioscience, Shanghai, China). To analyze the DNA methylation status of the cytosine–phosphorous–guanine (CpG) islands of the SCARA5 promoter in various tumor cell lines, a methylation‐specific PCR (MSP) was performed using bisulfite‐treated genomic DNA. The specific primers for methylated and unmethylated DNA were as follows:7 CpG island I methylated, 5′‐GTT TAG CGG GCG TTT TTA TACG‐3′ (forward) and 5′‐AAC AAA ACC ACA AAA ACA CTTC‐3′ (reverse); and unmethylated, 5′‐AGT GGG TGT TTT TAT ATG GGG TT‐3′ (forward) and 5′‐ACT CCC TAT CCT TAA TAC CTA ATC CT‐3′ (reverse).
Tissue array assay
A tissue array (Alenabio, Xian, China) was to detect SCARA5 expression in primary human tumor samples. The glioma tissue array consisted of 71 glioma and four normal brain tissues, whereas the NSCLC tissue array consisted of 52 NSCLC tissues and eight normal lung tissues. Slides of tissue samples were simultaneously subjected to immunohistochemical staining using an anti‐SCARA5 antibody.7 Images were observed under a light microscope. Positive staining was defined as the presence of brown granules. All slides were reviewed independently by two researchers blinded to each other's ratings. The intensity of staining was graded as follows:7 0, negative; 1, low expression; 2, moderate expression; 3, high expression; 4, strong expression.
Construction of a SCARA5 expression vector
The full‐length SCARA5 ORF (nucleotides [nt] 441–1928; GenBank Accession no. NM_173833) was amplified by RT‐PCR from the total RNA of HEK‐293 cells10 using the following primers: 5′‐CGC GGA TCC AAG ATG GAG AAC AAA GCT ATG TAC‐3′ (forward) and reverse, 5′‐CGG AAT TCT CAG TGT CTG TTG CAT GTC ACG ‐3′ (reverse). The RT‐PCR product was inserted into the EcoRI and BamHI sites of the multiple cloning site of the plasmid expression vector (pVAX1). The recombinant plasmid was named p‐SCARA5.
Cell transfection, proliferation, and apoptosis assays
All in vitro assays were performed on three groups: (i) an untreated group; (ii) the pVAX1 group; and (iii) the p‐SCARA5 group. The U251 and A549 cells were seeded in culture plates for 24 h and transfected with either the recombinant plasmid p‐SCARA5 or the empty vector pVAX1 using FuGene HD transfection reagent (Roche, Indianapolis, IN, USA) according to the manufacturer's instructions.
The antiproliferative effect of SCARA5 in U251and A549 cells was determined using the MTT and colony formation assays, as described previously.11, 12 To observe apoptotic cells, transfected U251 cells were stained with Hoechst 33258 (1 μg/mL).13 Briefly, 48 h after transfection, U251 cells were washed twice with PBS and then stained with Hoechst 33258 for 10 min. The resulting images were photographed under a fluorescent microscope. Furthermore, cytometric analysis was used to confirm apoptosis, as described previously.14 Each assay was replicated three times.
Wound‐healing assay
The antimigration effect of SCARA5 in U251 cells was determined using the wound‐healing assay. Briefly, 24 h after transfection, monolayer cells were wounded by scratching with pipette tips and then washed with PBS. Phase contrast images of the wounds were recorded after 0, 24 and 48 h from three independent experiments.
Invasion and tube formation assay
The invasion of HUVEC invasion was evaluated using 24‐well transwells (8‐μm pore size; Millipore, Billerica, MA, USA), as described previously15 with some modification. Briefly, the filter of the transwell plate was covered with 50 μL matrigel (BD Biosciences, Franklin Lakes, NJ, USA). After matrigel polymerization, 500 μL EBM‐2 medium containing various growth factors was placed in the lower chamber and 100 μL HUVEC suspension (2 × 10⁴ cells/well; in EBM‐2 without growth factors) was placed in the upper chamber. In addition, the upper chamber contained 100 μL supernatant medium from transfected U251 cells. After 24 h incubation, cells on the back surface were fixed in 100% methanol, stained with 0.05% crystal violet, counted in at least six randomly chosen fields and photographed. For the tumor cell invasion assay, 100 μL U251 suspension (5 × 10⁴ cells/well) was added to the upper chamber and 500 μL medium with 20% FBS was added to the lower chamber. After 30 h incubation, cells on the back surface were fixed in 100% methanol and stained with 0.05% crystal violet.
The tube formation assay was performed to assess the inhibitory effect of SCARA5 on HUVEC activity. Briefly, 96‐well plates were coated with 50 μL matrigel per well and seeded with 100 μL HUVEC suspension in EBM‐2 medium (2 × 10⁴ cells/well). In addition, 100 μL supernatant fluid of transfected U251 cells was added to each of the wells. After 6 h incubation, images were photographed using a microscope.
Xenograft mouse models
U251 tumors were established in female athymic (nu/nu) mice by s.c. injection of 3 × 10⁶ cells. When tumor size reached approximately 70 mm3 (4 days after injection), mice were randomized to one of three groups (seven mice per group) as follows: (i) 5% glucose (GS); (ii) 5 μg pVAX1/30 μg liposome complex; and (iii) 5 μg p‐SCARA5 (pVAX1‐hSCARA5)/30 μg liposome complex. The plasmid DNA/liposome complex were prepared as described previously16 and was injected through the tail vein in a total volume of 100 μL. Tumor dimensions were measured every 3 days for 4 weeks using calipers. Tumor volume (V) was calculated as follows:
where L is the largest diameter and W is the smallest diameter. After treatment for 5 weeks, tumors were removed and processed for paraffin embedding or frozen sections. Because mice were assessed for spontaneous lung metastases of U251 tumors, the lungs were also removed and metastatic nodules counted. In addition, lung tissues were placed in 4% formaldehyde for paraffin embedding and further pathological analysis.
An experimental A549 lung metastasis model was used to investigate the effects of SCARA5 on the development of metastases. Briefly, nu/nu mice were inoculated with A549 cells (1.5 × 10⁶) in 100 μL PBS via tail vein injection. Seven days after tumor injection, mice were treated according to the protocol described above. After 5 weeks treatment, the lungs were removed and the number of metastatic nodules was counted under a dissecting microscope. Lung tissues were also placed in 4% formaldehyde for paraffin embedding and further pathological analysis.
Histological analysis
Paraffin‐embedded sections of tumor tissue were stained with signal transducer and activator of transcription (STAT) 3 antibody (Cell Signaling Technology, Beverly, MA, USA), proliferating cell nuclear antigen (PCNA) antibody (Santa Cruz Biotechnology, Santa Cruz, CA, USA) and H&E. The TUNEL assay (Promega) was performed according to the manufacturer's instructions. Frozen sections were stained with a CD31 antibody (BD Biosciences, Franklin Lakes, NJ, USA) to assess the effects of SCARA5 on angiogenesis.
Western blot analysis
After 48 h transfection, total protein from U251 cells was extracted using RIPA buffer with 1% proteinase inhibitor cocktail (Sigma, St Louis, MO, USA). Proteins (50 μg) were separated by SDS‐PAGE and blotted with specific antibodies, namely those against SCARA5 (Santa Cruz Biotechnology), FAK, phosphorylated (p‐) FAK (Y397), Src, p‐Src (Y416), STAT3, p‐STAT3 (Y705), AKT, p‐AKT (S473), cyclin B1, cyclinD1, survivin, matrix metalloproteinase (MMP)‐9 (Cell Signaling Technology) and VEGF‐A (Millipore). Anti‐GAPDH antibody (Sigma) was used as a loading control. Blots were developed with HRP‐conjugated secondary antibodies and chemiluminescent substrate on Kodak X‐Ray films (Rochester, NY, USA).
Statistical analysis
Where appropriate, data are presented as the mean ± SEM. Data were analyzed using spss 11.5 (SPSS, Chicago, IL, USA). The significance of differences and variances was evaluated using one‐way anova followed by Tukey's test. P < 0.05 was considered significant.
Results
Downregulation of SCARA5 in various cell lines and tissues
Different tumor cells were used to investigate the profile of SCARA5 mRNA expression. Expression of SCARA5 was downregulated in all tumor cells, except HEK‐293 cells (Fig. 1A). In those tumor cell lines in which SCARA5 mRNA expression was downregulated, the MSP was performed using genomic DNA to uncover the mechanisms involved. The results of the MSP indicated that eight of 10 cell lines had DNA methylation in the promoter region of the SCARA5 gene, which may explain SCARA5 downregulation in these cell lines (Fig. 1B).
Figure 1.
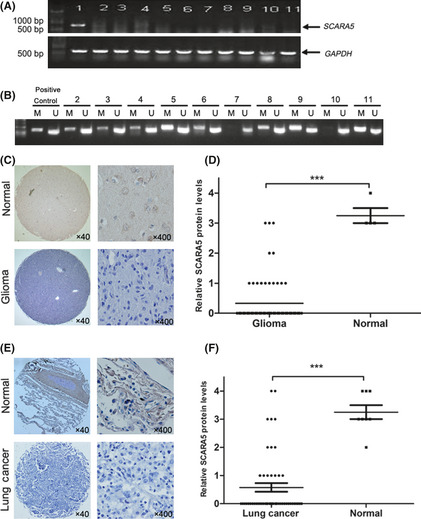
Expression of Class A scavenger receptor member 5 (SCARA5) in various cell lines and tissues. (A) A series of tumor cell lines was used to investigate SCARA5 mRNA expression using RT‐PCR. (B) Representative results of methylation‐specific PCR (MSP) of genomic DNA to determine the methylation status of the SCARA5 promoter in different cell lines. M, MSP product (343 bp); U, USP product (231 bp); lane 1, HEK‐293 cells; lane 2, U87 cells; lane 3, HepG2 cells; lane 4, A549 cells; lane 5, MDA‐MB‐231 cells; lane 6, MDA‐MB‐435S cells; lane 7, SW620 cells; lane 8, SK‐hep‐1 cells; lane 9, DU145 cells; lane 10, H460 cells; lane 11, HO‐8910 cells. (C,E) Representative immunohistochemical staining using an anti‐SCARA5 antibody of one pair of glioma specimens and normal brain tissue (C) and one pair of non‐small cell lung cancer (NSCLC) tissue and normal lung tissue (E). Nuclei were counterstained with hematoxylin. Original magnification ×40 and ×400, as indicated. (D,F) Statistical analyses were performed using GraphPad Prism 5 (GraphPad Software Inc., La Jolla, CA, USA) to compare relative SCARA5 levels in normal and cancer tissues. Data show that there are significant differences of SCARA5 expression between the tumor and normal tissues, with horizontal lines indicating mean values. ***P < 0.001.
Immunohistochemical staining using the anti‐SCARA5 antibody was performed on two tissue arrays, namely glioma and NSCLC tissue arrays. Similar to the observations in tumor cell lines, SCARA5 levels were significantly lower in 56 of 71 (78.8%) of the glioma tissues compared with normal brain tissues (Fig. 1C,D). Similarly, SCARA5 levels were significantly lower in 37 of 52 (71.1%) NSCLC tissues compared with normal lung tissue (Fig. 1E,F).
Inhibition of cell proliferation and induction of apoptosis in tumor cells by SCARA5
As shown in Figure S1, available as Supplementary Material to this paper, a GFP plasmid was used to confirm the efficacy of transfection in tumor cells. Upregulation of SCARA5 expression with transfection of the p‐SCARA5 plasmid significantly suppressed cell proliferation, as determined by the MTT and colony formation assays (Fig. 2A,B). The inhibition of cell proliferation and colony formation of U251 cells in the p‐SCARA5 compared with the empty vector group was 37.7% and 54.5%, respectively. Results of western blot analysis evaluating SCARA5 expression in transfected U251 and A549 cells revealed significant upregulation of expression in the p‐SCARA5 compared with the empty vector group (Fig. 2A).
Figure 2.
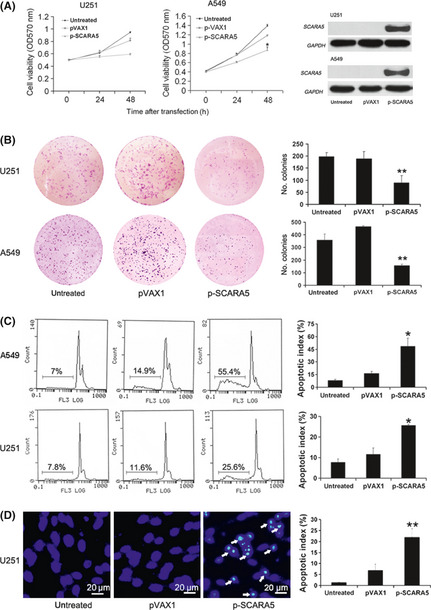
Upregulation of Class A scavenger receptor member 5 (SCARA5) expression inhibits cell proliferation and induces cells apoptosis. (A) There were significant differences between the p‐SCARA5 and empty vector (pVAX1) groups in the MTT assays. The inhibition of cell proliferation of A549 cells in the p‐SCARA5 group compared to the untreated group was 66.1% (n = 3). *P < 0.05 (anova). Western blot analysis was used to confirm SCARA5 expression. (B) After transfection for 48 h, U251 and A549 cells were scraped, counted, and plated into six‐well plates (1000 cells/well) for 7–10 days. The histograms on the right show colony in the different groups. The number of colony formation of A549 cells in the p‐SCARA5 group was 156 ± 9 compared to the untreated group, which was 359 ± 46 (n = 3). **P < 0.01 compared with the pVAX1 group (anova). (C) Flow cytometry analysis after transfection of A549 and U251 cells for 48 h was used to determined the percentage of cells in the sub‐G1 region. The apoptotic index of U251 and A549 cells were 25.6% and 55.4%, respectively, in the p‐SCARA5 group. (D) The histograms show cell apoptosis in the different groups, as determined by Hoechst staining. The apoptotic index of U251 cells was 22.6% in the p‐SCARA5 group compared to the untreated group, which was 1.9% (n = 3). **P < 0.01 compared with the pVAX1 group (anova). The apoptotic index was calculated by dividing the number of Hoechst‐positive cells by the total number of cells.
We speculated that upregulated SCARA5 expression may induce apoptosis. Apoptosis was evaluated by Hoechst 33258 staining, with further quantitative assessment by flow cytometry to estimate the number of apoptotic cells. These assays indicated that there was a higher proportion of apoptotic cells in the p‐SCARA5 group (Fig. 2C,D).
Suppression of cell migration, invasion, and tube formation by SCARA5
Wound‐healing, invasion, and tube formation assays were used to determined whether SCARA5 functions as a suppressor for tumor metastasis. Indeed, SCARA5 inhibited cell migration in U251 cells, migration rats in the untreated group and p‐SCARA5 groups being 96.3% and 21.7%, respectively (Fig. 3A–C). The invasive index of U251 and HUVEC cells in the p‐SCARA5 group was approximately 16.7% and 4.3%, respectively, compared with 100% in the control group (Fig. 3D). Similarly, the tube formation rate was lower in the p‐SCARA5 compared with the control group (10.25% vs 91.8%, respectively). Thus, upregulation of SCARA5 expression suppresses cell migration, both in invasion U251 cells and HUVEC, and inhibits tube formation in HUVEC. In vitro ELISA results (Fig. S2) revealed that VEGF‐A expression was downregulated in the p‐SCARA5 group, which may be the mechanism responsible for the anti‐angiogenesis effects of SCARA5 overexpression in tumor cells.
Figure 3.
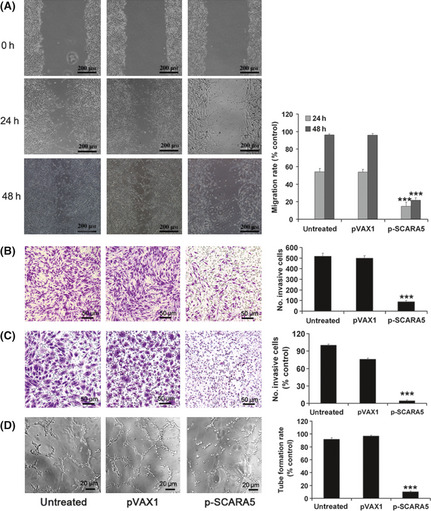
Upregulation of the expression of Class A scavenger receptor member 5 (SCARA5) inhibited cell migration, invasion, and tube formation. (A) The migration rate was calculated by dividing the number of the closed width by the primary width of the wounds. Upregulation of SCARA5 (p‐SCARA5 group) significantly suppressed migration compared with that in the empty vector (pVAX1)‐transfected group. The migration rates in the untreated group and p‐SCARA5 group were 96.3% and 21.7% respectively (n = 3). ***P < 0.001 compared with the pVAX1 group (anova). (B) Cell invasion, evaluated using transwell chambers, in U251 cells. (C,D) Invasion and tube formation assays in HUVEC. The tubular structure in each group was quantified by manual counting. The number of invasive U251 cells and HUVEC and the tube formation rate in HUVEC differed significantly between the p‐SCARA5 and empty vector groups. The invasive index of U251 and HUVEC cells in the p‐SCARA5 group was about 16.7% and 4.3% respectively, compared to 100% in the untreated group. Similarly, the tube formation rate was lower in the p‐SCARA5 group compared to the untreated group (10.25% vs 91.8% respectively) (n = 3). ***P < 0.001 with the pVAX1 group (anova).
Inhibition of primary tumor growth by upregulated SCARA5 expression
The tumor suppressor role of SCARA5 in U251 xenografts was evaluated in the present study (Fig. 4A). In the p‐SCARA5 group, tumor suppression reached up to 69.4% compared with 5% in the GS control group (average tumor volumes of 529 ± 132 vs 1529 ± 390 mm3, respectively; P < 0.01). Western blot analysis and RT‐PCR were used to detect the protein and mRNA expression of SCARA5, respectively. Higher SCARA5 expression, at both the protein and mRNA levels, was seen in the p‐SCARA5 compared with the empty vector and 5% GS groups. The proliferation index, as determined by PCNA staining, was 23.3% in the p‐SCARA5 group compared with 100% in the empty vector group (Fig. 4C). Using the TUNEL assay and H&E staining (Fig. 4D,E) to evaluate tumor cell apoptosis revealed an apoptotic index of 47.3% in p‐SCARA5 group compared with 5.5% in the empty vector group. In addition, tumor angiogenesis, as determined by CD31 staining, was significantly decreased in the p‐SCARA5 group compared with that in the other groups (Fig. 4F). Generally, SCARA5 gene upregulation inhibited tumor growth, induced tumor cell apoptosis and reduced tumor angiogenesis.
Figure 4.
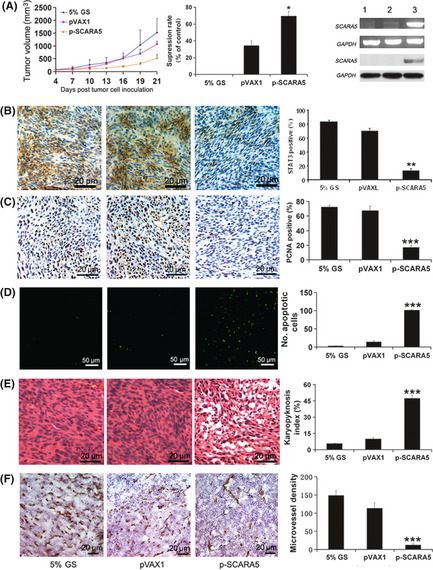
Upregulation of the expression of Class A scavenger receptor member 5 (SCARA5) inhibited primary tumor growth. (A) Growth curves and the histogram on the right show that tumor growth was markedly inhibited by upregulation of SCARA5 (p‐SCARA5 group) compared with that in the empty vector (pVAX1) group 21 days after inoculation of mice with U251 cells. In the p‐SCARA5 group, tumor suppression rate was 69.4% compared to the 5% GS group (average tumor volumes of 529 ± 132 vs 1529 ± 390 mm3 respectively) (n = 7). **P < 0.01 compared with the pVAX1 group (anova). Both RT‐PCR and western blot analysis (far right‐hand panel) were used to detect mRNA and protein expression of SCARA5 in three treatment groups: 1, 5% glucose (GS); 2, pVAX1; and 3, p‐SCARA5. Both RNA and protein were extracted from the tumors. (B) Staining for signal transducer and activator of transcription (STAT) 3 revealed that upregulation of SCARA5 expression downregulated STAT3 expression. Histograms show quantification of the results. The STAT3 positive rate was higher in 5% GS group compared to the p‐SCARA5 group (83.5% vs 16.9% respectively) (n = 7). **P < 0.01 compared with the pVAX1 group (anova). (C) Immunohistochemistry for proliferating cell nuclear antigen (PCNA), (D) the TUNEL assay and (E) H&E staining in primary U251 xenografts revealed that increased SCARA5 expression inhibited cell proliferation and induced apoptosis, which is correlated with the inhibition of tumor growth. The proliferation index was calculated by dividing the number of PCNA‐positive cells by the total number of cells. The number of apoptotic nuclei in the TUNEL assay was quantified by manual counting. The karyopyknosis index was calculated by dividing the number of karyopyknosis‐positive cells by the total number of cells. The karyopyknosis index in the p‐SCARA5 group was 47.3% compared to the 5% GS group, which was 5.5% (n = 7). ***P < 0.01 compared with the pVAX1 group (anova). (F) Intratumoral vessels in primary U251 xenografts were indicated by CD31 staining. The histogram shows angiogenesis in the different groups. The microvessel density in the p‐SCARA5 group was 12 ± 4/mm2 compared to the 5% GS group, which was 148 ± 13/mm2 (n = 7). ***P < 0.01 compared with the pVAX1 group (anova).
Effects of systemic SCARA5 delivery on metastasis
The spontaneous U251 lung metastasis model and experimental A549 lung metastasis model were used to explore the effects of SCARA5 on tumor metastasis. After 5 weeks treatment, three of five mice in the p‐SCARA5 group in the spontaneous U251 lung metastasis model had no metastatic nodules in the lungs. In contrast, mice in both the empty vector and blank control groups contained metastatic nodules in the lungs (Fig. 5). There were more than five large (>4 mm diameter) metastatic nodules in each mouse in the 5% GS control group, but fewer than one large metastatic nodule in the p‐SCARA5 group. The suppression of metastasis in the p‐SCARA5 group compared with the 5% GS control group in the spontaneous U251 lung metastasis model was 77.3% (average no. metastatic nodules in the lung: 2 ± 2 for p‐SCARA5 vs 9 ± 3, respectively; P < 0.0001). In the experimental A549 lung metastasis model, there was an average of 16.8 ± 3.8 and 5.1 ± 0.4 metastatic nodules in the lungs of mice exposed to 5% GS and p‐SCARA5, respectively (P < 0.001; Fig. 5F).
Figure 5.
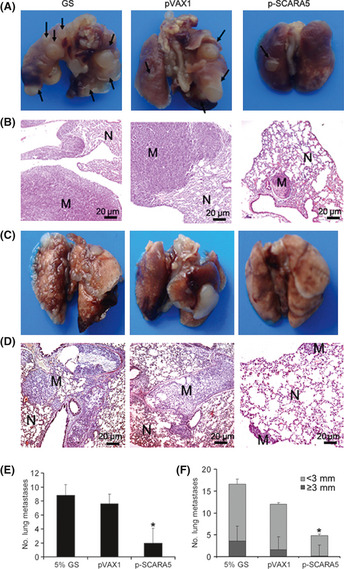
Class A scavenger receptor member 5 (SCARA5) inhibits distant metastases. (A) Representative images of metastases that formed in the lungs of each nude mouse (n = 5) 5 weeks after the s.c. injection of U251 cells. Black arrows indicate metastatic nodules in the lungs. (B,D) Representative H&E‐stained sections of lungs isolated from mice in the three treatment groups. N, normal lung; M, metastatic nodule. (C) Representative images of metastases that formed in the lungs of each nude mouse (n = 5) 5 weeks after the s.c. injection of A549 cells. (e,f) In the p‐SCARA5‐transfected group, lung metastasis was inhibited significantly compared with that in the 5% glucose (GS) group. The suppression of metastasis in the p‐SCARA5 group, compared to the 5% GS group in spontaneous U251 lung metastasis model and in the experimental A549 lung metastasis model, were 77.3% and 79.6% respectively (n = 5). *P < 0.05 compared with the pVAX1 group (anova).
Inhibition of the FAK and STAT3 signaling pathways by SCARA5
Therapeutic upregulation of SCARA5 expression inhibits tumor growth and metastasis. To explore the molecular mechanisms involved, western blot analysis was used to determine cell signaling in SCARA5‐mediated inhibition of cancer progression and metastasis. The results demonstrate that SCARA5 is physically associated with multiple cell signals. Significant reductions were seen in the phosphorylation of FAK and Src in U251 cells in the presence of SCARA5 upregulation (Fig. 6A). Interestingly, SCARA5 upregulation inactivated STAT3 (Fig. 4B) and other downstream signaling, such as cyclinB1, cyclinD1, AKT, survivin (associated with cell survival), MMP‐9 (associated with metastasis), and VEGF‐A (associated with angiogenesis; Fig. 6B).
Figure 6.
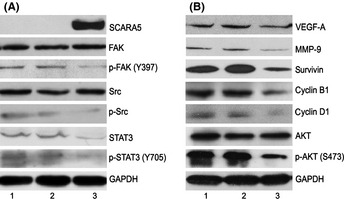
Class A scavenger receptor member 5 (SCARA5) regulates the signal transducer and activator of transcription (STAT) 3 and focal adhesion kinase (FAK) signaling pathways. Forty‐eight hours after transfection of U251 cells, protein expression was determined in each group by western blots. (A) Compared with the empty vector (pVAX1) and untreated groups, the phosphorylation of FAK and Src, as well as STAT3 expression, were decreased in the p‐SCARA5. (B) Upregulation of SCARA5 downregulated the expression of some downstream molecular signals, namely AKT, cyclin B1, cyclin D1, survivin, vascular endothelial growth factor (VEGF)‐A and matrix metalloproteinase (MMP)‐9 in three treatment groups: 1, 5% glucose (GS); 2, pVAX1; and 3, p‐SCARA5. We hypothesize that SCARA5 contributes to cancer metastasis as a result of interactions with the STAT3 and FAK signaling pathways. Inhibition by SCARA5 of tumor growth and metastasis is achieved via inactivation of STAT3 and/or FAK, which are critical to cell survival, cell proliferation, invasion, angiogenesis, and tumor immune evasion.
Discussion
The results of the present study indicate that therapeutic upregulation of SCARA5 expression inhibits lung metastasis in the spontaneous U251 lung metastasis model, as well as in the experimental A549 lung metastasis model in vivo. Glioma is the most common primary tumor of the central nervous system, accounting for 80% of adult primary brain tumors.17 Extraneural metastases from malignant gliomas are believed to be rare,18 but the metastatic behavior of human glioblastoma multiforme xenografts do not differ significantly from a variety of other histological xenografts when evaluated at the same transplantation site in the SCID model.19 In addition, glioma has a characteristically high proliferation index and a highly invasive nature, which prevents complete tumor resection and contributes to rapid relapse.20 In the present study, we found that lung metastasis were present 4 weeks after the s.c. injection of U251 cells, which provides a model of spontaneous metastases in athymic mice.
Delivery of therapeutic genes to disseminated tumor sites has been a major challenge in the field of cancer gene therapy,21 delivery of therapeutic genes plays a critical role in the therapeutic effect of SCARA5 overexpression. Cationic liposomes are the most extensively investigated vectors and they have been used successfully to deliver genes, proteins, oligonucleotides and antibiotics in several cell types.22, 23, 24 In the present study, we used DOTAP : Chol liposomes to form complexes with DNA in vivo, which resulted in enhanced expression of targeted genes in most tissues examined.21 Indeed, a study of lung cancer proved that extruded DOTAP : Chol cationic liposome‐mediated gene delivery effectively transfects both primary and disseminated murine tumors and human lung tumor xenografts.21 The validity of this delivery system to deliver tumor suppressors has been proven in previous studies.25 Furthermore, the DOTAP : Chol‐FUS1 (where FUS1 is a novel tumor suppressor gene identified in the human chromosome 3p21.3 region where allele losses and genetic alterations occur early and frequently for many human cancers) complex has entered Phase I clinical trials in the treatment of advanced lung cancers.26 Therefore, the DOTAP : Chol cationic liposome vector system appears to be attractive.26
Interestingly, western blot analysis showed that SCARA5 overexpression led to suppressed tumor growth and metastasis via inhibition of FAK, Src, STAT3, and other downstream molecular signals such as AKT, cyclin B1, cyclin D1, survivin, VEGF‐A and MMP‐9 in U251 cells. Focal adhesion kinase is a non‐receptor tyrosine kinase that resides at focal adhesions, sites of integrin‐mediated cell attachment to extracellular matrix components,27 and transmits important signals to modulate several cell functions, including proliferation, migration, and survival.28, 29, 30, 31 The Src family of protein tyrosine kinases is another group of important mediators of the growth of tumor cells. Src activity is regulated by tyrosine phosphorylation at two sites: Tyr416 phosphorylation in the activation loop of the kinase domain upregulates enzyme activity, whereas Tyr527 phosphorylation renders the enzyme less active.33 It has been reported that upregulation of SCARA5 inactivates FAK and Src in MHCC‐LM3 cells.7 In addition, STAT3 is a key signaling molecule for many cytokines and growth factor receptors, and is persistently activated in a number of human tumors.34, 35 Signal transducer and activator of transcription three possesses oncogenic potential by promoting cell proliferation, differentiation, and cell cycle progression, as well as inhibition of apoptosis via incessant induction of genes such as cyclin B1, cyclin D1, c‐Myc, Bcl‐xL, Bcl‐2, Mcl‐1. It also promotes tumor cells migration and invasion by activating MMP‐9. More importantly, STAT3 induces angiogenesis by upregulating VEGF‐A expression.32, 34, 35, 36 We believe that SCARA5 exhibits powerful antitumor effects against the highly invasive U251 glioma as a result of interactions with multiple pathways, including the FAK and STAT3 signaling pathways.
To our knowledge, the results presented here are the first evidence that SCARA5 can be used as a therapeutic approach to treat mice bearing U251 and A549 xenograft tumors. The present study is also the first to demonstrate that SCARA5 induces tumor cells apoptosis and inhibits angiogenesis. However, the biological interaction between SCARA5 and STAT3 are not completely clear. In the future, we will extend the present studies to investigate the interaction between SCARA5 and STAT3. Because STAT3 plays an important role in tumorigenesis and metastasis in various human tumors, we propose that SCARA5 may have promising therapeutic application in other tumors in which STAT3 signaling is activated.
Disclosure Statement
The authors have no conflicts of interest to declare.
Supporting information
Fig. S1. A plasmid containing GFP was used to check the efficiency of transfection in tumor cells.
Fig. S2. Results of ELISA of VEGF‐A protein concentrations in the culture supernatant of U251 cells.
Acknowledgments
This work was supported by the National Natural Science Foundation of China (30973451) and The National Key Basic Research Program (973 Program) of China (2010CB529900 and 2012CB917104).
(Cancer Sci, 2012; 103: 1631–1639)
References
- 1. Steeg PS. Tumor metastasis: mechanistic insights and clinical challenges. Nat Med 2006; 12: 895–904. [DOI] [PubMed] [Google Scholar]
- 2. Ma L, Reinhardt F, Pan E et al Therapeutic silencing of miR‐10b inhibits metastasis in a mouse mammary tumor model. Nat Biotechnol 2010; 28: 341–7. [DOI] [PMC free article] [PubMed] [Google Scholar]
- 3. Bandyopadhyay S, Wang Y, Zhan R et al The tumor metastasis suppressor gene Drg‐1 down‐regulates the expression of activating transcription factor 3 in prostate cancer. Cancer Res 2006; 66: 11983–90. [DOI] [PubMed] [Google Scholar]
- 4. Shevde LA, Welch DR. Metastasis suppressor pathways: an evolving paradigm. Cancer Lett 2003; 198: 1–20. [DOI] [PubMed] [Google Scholar]
- 5. Jiang Y, Oliver P, Davies KE, Platt N. Identification and characterization of murine SCARA5, a novel class A scavenger receptor that is expressed by populations of epithelial cells. J Biol Chem 2006; 281: 11834–45. [DOI] [PubMed] [Google Scholar]
- 6. Li JY, Paragas N, Ned RM et al Scara5 is a ferritin receptor mediating non‐transferrin iron delivery. Dev Cell 2009; 16: 35–46. [DOI] [PMC free article] [PubMed] [Google Scholar]
- 7. Huang J, Zheng DL, Qin FS et al Genetic and epigenetic silencing of SCARA5 may contribute to human hepatocellular carcinoma by activating FAK signaling. J Clin Invest 2010; 120: 223–41. [DOI] [PMC free article] [PubMed] [Google Scholar]
- 8. Halder J, Lin YG, Merritt WM et al Therapeutic efficacy of a novel focal adhesion kinase inhibitor TAE226 in ovarian carcinoma. Cancer Res 2007; 67: 10976–83. [DOI] [PubMed] [Google Scholar]
- 9. Jaffe EA, Nachman RL, Becker CG, Minick CR. Culture of human endothelial cells derived from umbilical veins. Identification by morphologic and immunologic criteria. J Clin Invest 1973; 52: 2745–56. [DOI] [PMC free article] [PubMed] [Google Scholar]
- 10. Shaw G, Morse S, Ararat M, Graham FL. Preferential transformation of human neuronal cells by human adenoviruses and the origin of HEK 293 cells. FASEB J 2002; 16: 869–71. [DOI] [PubMed] [Google Scholar]
- 11. Schuebel KE, Chen W, Cope L et al Comparing the DNA hypermethylome with gene mutations in human colorectal cancer. PLoS Genet 2007; 3: e157. [DOI] [PMC free article] [PubMed] [Google Scholar]
- 12. Tan SM‐L, Li F, Rajendran P, Kumar AP, Hui KM, Sethi G. Identification of β‐escin as a novel inhibitor of signal transducer and activator of transcription 3/janus‐activated kinase 2 signaling pathway that suppresses proliferation and induces apoptosis in human hepatocellular carcinoma cells. J Pharmacol Exp Ther 2010; 334: 285–93. [DOI] [PubMed] [Google Scholar]
- 13. Liu J, Huang R, Lin D et al Expression of survivin and bax/bcl‐2 in peroxisome proliferator activated receptor‐α ligands induces apoptosis on human myeloid leukemia cells in vitro. Ann Oncol 2005; 16: 455–9. [DOI] [PubMed] [Google Scholar]
- 14. Wan Y, Huang A, Yang Y et al A vector‐based short hairpin RNA targeting Aurora A inhibits breast cancer growth. Int J Oncol 2010; 36: 1121–8. [PubMed] [Google Scholar]
- 15. Kawasaki K, Smith RS Jr, Hsieh CM, Sun J, Chao J, Liao JK. Activation of the phosphatidylinositol 3‐kinase/protein kinase Akt pathway mediates nitric oxide‐induced endothelial cell migration and angiogenesis. Mol Cell Biol 2003; 23: 5726–37. [DOI] [PMC free article] [PubMed] [Google Scholar]
- 16. Deng H, Jiang Q, Yang Y et al Intravenous liposomal delivery of the short hairpin RNAs against Plk1 controls the growth of established human hepatocellular carcinoma. Cancer Biol Ther 2011; 11: 401–9. [DOI] [PubMed] [Google Scholar]
- 17. Wang H, Shen W, Huang H et al Insulin‐like growth factor binding protein 2 enhances glioblastoma invasion by activating invasion‐enhancing genes. Cancer Res 2003; 63: 4315. [PubMed] [Google Scholar]
- 18. Yung W, Tepper S, Young D. Diffuse bone marrow metastasis by glioblastoma: Premortem diagnosis by peroxidase‐antiperoxidase staining for glial fibrillary acidic protein. Ann Neurol 1983; 14: 581–5. [DOI] [PubMed] [Google Scholar]
- 19. Huang P, Allam A, Taghian A, Freeman J, Duffy M, Suit HD. Growth and metastatic behavior of five human glioblastomas compared with nine other histological types of human tumor xenografts in SCID mice. J Neurosurg 1995; 83: 308–15. [DOI] [PubMed] [Google Scholar]
- 20. Fidler IJ. The pathogenesis of cancer metastasis: the ‘seed and soil’ hypothesis revisited. Nat Rev Cancer 2003; 3: 453–8. [DOI] [PubMed] [Google Scholar]
- 21. Ramesh R, Saeki T, Templeton NS et al Successful treatment of primary and disseminated human lung cancers by systemic delivery of tumor suppressor genes using an improved liposome vector. Mol Ther 2001; 3: 337–50. [DOI] [PubMed] [Google Scholar]
- 22. Zelphati O, Szoka FC. Mechanism of oligonucleotide release from cationic liposomes. Proc Natl Acad Sci U S A 1996; 93: 11493–8. [DOI] [PMC free article] [PubMed] [Google Scholar]
- 23. Sangaré L, Morisset R, Omri A, Ravaoarinoro M. Incorporation rates, stabilities, cytotoxicities and release of liposomal tetracycline and doxycycline in human serum. J Antimicrob Chemother 1998; 42: 831–4. [DOI] [PubMed] [Google Scholar]
- 24. Jiao X, Wang RYH, Qiu Q, Alter HJ, Shih J. Enhanced hepatitis C virus NS3 specific Th1 immune responses induced by co‐delivery of protein antigen and CpG with cationic liposomes. J Gen Virol 2004; 85: 1545–53. [DOI] [PubMed] [Google Scholar]
- 25. Christensen CL, Gjetting T, Poulsen TT, Cramer F, Roth JA, Poulsen HS. Targeted cytosine deaminase‐uracil phosphoribosyl transferase suicide gene therapy induces small cell lung cancer‐specific cytotoxicity and tumor growth delay. Clin Cancer Res 2010; 16: 2308–19. [DOI] [PMC free article] [PubMed] [Google Scholar]
- 26. Lu C, Stewart D, Ji L, Ramesh R, Jayachandran G, Erasmus J. A phase I trial of intravenous therapy with tumor suppressor Fus1‐nanoparticles for recurrent/metastatic lung cancer. J Clin Oncol 2009; 27: 00–00. [Google Scholar]
- 27. Hiscox S, Barnfather P, Hayes E et al Inhibition of focal adhesion kinase suppresses the adverse phenotype of endocrine‐resistant breast cancer cells and improves endocrine response in endocrine‐sensitive cells. Breast Cancer Res Treat 2011; 125: 659–69. [DOI] [PubMed] [Google Scholar]
- 28. McLean GW, Carragher NO, Avizienyte E, Evans J, Brunton VG, Frame MC. The role of focal‐adhesion kinase in cancer: a new therapeutic opportunity. Nat Rev Cancer 2005; 5: 505–15. [DOI] [PubMed] [Google Scholar]
- 29. Hecker TP, Gladson CL. Focal adhesion kinase in cancer. Front Biosci 2003; 8: 705–14. [DOI] [PubMed] [Google Scholar]
- 30. Chen JY, Tang YA, Huang SM et al A novel sialyltransferase inhibitor suppresses FAK/paxillin signaling and cancer angiogenesis and metastasis pathways. Cancer Res 2011; 71: 473–83. [DOI] [PubMed] [Google Scholar]
- 31. Golubovskaya VM, Cance W. Focal adhesion kinase and p53 signal transduction pathways in cancer. Front Biosci 2010; 15: 901–12. [DOI] [PMC free article] [PubMed] [Google Scholar]
- 32. Xu W, Doshi A, Lei M, Eck MJ. Crystal structures of c‐Src reveal features of its autoinhibitory mechanism. Molecular Cell 1999; 3: 629–38. [DOI] [PubMed] [Google Scholar]
- 33. Groner B, Lucks P, Borghouts C The function of Stat3 in tumor cells and their microenvironment. Semin Cell Dev Biol 2008; 19: 341–50. [DOI] [PubMed] [Google Scholar]
- 34. Xie T, Huang FJ, Aldape KD et al Activation of stat3 in human melanoma promotes brain metastasis. Cancer Res 2006; 66: 3188–96. [DOI] [PubMed] [Google Scholar]
- 35. Niu G, Wright KL, Huang M et al Constitutive Stat3 activity up‐regulates VEGF expression and tumor angiogenesis. Oncogene 2002; 21: 2000–8. [DOI] [PubMed] [Google Scholar]
- 36. Altieri DC. Validating survivin as a cancer therapeutic target. Nat Rev Cancer 2003; 3: 46–54. [DOI] [PubMed] [Google Scholar]
Associated Data
This section collects any data citations, data availability statements, or supplementary materials included in this article.
Supplementary Materials
Fig. S1. A plasmid containing GFP was used to check the efficiency of transfection in tumor cells.
Fig. S2. Results of ELISA of VEGF‐A protein concentrations in the culture supernatant of U251 cells.