

Abstract
Increasing evidence suggests that malignant transformation can result from chronic infection, and Toll‐like receptors (TLRs) may play an important role in this process. We have previously reported that the increased expression of TLR‐9 is associated with tumor cell proliferation in oral cancer. However, the mechanisms involved have not been elucidated. The aim of this study was to investigate whether CpG‐oligodeoxynucleotides (CpG‐ODN), a special TLR‐9 agonist, is able to exert the proliferation‐promoting effect in human oral squamous cell carcinoma (OSCC), and to explore the possible underlying molecular mechanism. Flow cytometry, MTT, and colony formation assay were used to evaluate cell proliferation and cell cycle distribution. The mRNA and protein levels were analyzed by quantitative RT‐PCR and Western blot assay. Luciferase reporter gene, EMSA, and ChIP assays were used to detect the activity of activator protein‐1 (AP‐1) and nuclear factor‐κB (NF‐κB) in HB cells. Results showed that CpG‐ODN could stimulate proliferation of HB cells in a dose‐ and time‐dependent manner with a promoted G 1/S cell cycle progression. Increased cyclin D1 expression was detected in the nuclear region after CpG‐ODN treatment. Moreover, CpG‐ODN promoted nuclear translocation and activation of AP‐1, which appeared to be required for TLR‐9‐mediated cyclin D1 expression and subsequently cell proliferation, but seemed to have little impact on NF‐κB activity. Our results indicate that CpG‐ODN stimulates tumor cell proliferation through TLR‐9‐mediated AP‐1‐activated cyclin D1 expression in OSCC HB cells. Pharmacologic inhibition of the TLR‐9/AP‐1/cyclin D1 pathway may be a new therapeutic approach for prevention as well as treatment of OSCC.
Oral squamous cell carcinoma is the sixth most common malignancy worldwide, with 264 000 new cases and 128 000 deaths reported annually.1, 2 Despite improved detection and local control with surgery and/or radiotherapy and new chemotherapeutic regimens, survival rates over the last several decades have not improved significantly.3 This grim prognosis underlines the urgent need for the early identification of new approaches for the prevention and treatment of OSCC.
Although the cause of OSCC is multifactorial, it is likely that chronic inflammation of the oral mucosa plays a key role in the development of this disease.4 Epidemiologic studies also suggest that men with a history of inflammation‐related mucosa diseases, such as leukoplakia, have a higher incidence of oral cancer than age‐matched controls.5, 6, 7
Toll‐like receptors are members of the interleukin‐1 receptor superfamily and play a crucial role in the activation of innate immunity and the subsequent inflammatory process.8, 9 As the only intracellular distributed TLR, TLR‐9 can directly activate antigen‐presenting cells, B cells, and human neutrophils, leading to secretion of various cytokines through recognition of special bacterial DNA sequences, which could enter the cell through endocytosis.9 In our previous study, a gradually increasing expression of TLR‐9 protein was found in inflammatory oral mucosa and OSCC tissues, which suggests that TLR‐9 may play a key role in malignant transformation of oral mucosa with chronic inflammation.10 However, little is known about the molecular or cellular mechanisms involved in TLR‐9‐mediated oral squamous cell carcinogenesis.
The purpose of this study is to investigate the effect of TLR‐9 agonist on cell proliferation during the carcinogenesis of oral squamous cells in vitro, with special emphasis on cell cycle regulation, and to investigate the possible molecular mechanisms underlying TLR‐9‐mediated oral mucosa carcinogenesis, with emphasis on the AP‐1 signaling pathway.
Materials and Methods
Reagents and cell culture
Unmethylated phosphorothioate‐modified, human specific CpG‐ODN 2006 (5′‐TCGTCGTTTTGTCGTTTTGTCGTT‐3′) was purchased from InvivoGen (San Diego, CA, USA) and dissolved into endotoxin‐free sterile distilled deionized H2O according to the manufacturer's instructions and used at the indicated concentrations. The anti‐TLR‐9 antibody was purchased from Imgenex (San Diego, CA, USA). Both AP‐1‐specific inhibitor curcumin and the NF‐κB‐specific inhibitor PDTC were obtained from Calbiochem (San Diego, CA, USA).
Human immortalized oral epithelial cells and cancerous HB cells in the cellular carcinogenesis model of OSCC were used as previous described.11, 12 The HIOECs were cultured in defined keratinocyte‐SFM (Gibco, Grand Island, NY, USA). The HB cells were cultured in DMEM (Gibco) supplemented with 10% FBS, 1% glutamine, and 1% penicillin–streptomycin. Normal oral epithelial cells were obtained from surgical resections of non‐cancer patients and cultured routinely. All cells were cultured in a humidified atmosphere of 5% CO2 at 37°C.
Cell growth assay
The normal oral epithelial cells, HIOEC cells, and HB cells, were seeded in a 96‐well plate (Corning, Tokyo, Japan) with 1.0 × 10³ cells per well in 200 μL medium (defined keratinocyte‐SFM for HIOEC cells; and 10% FBS‐DMEM for HB cells). The cells were subcultured at 37°C in a 5% CO2 incubator for 12, 24, 48, and 72 h with different concentrations of CpG‐ODN. At the end of subculture, 20 μL MTT solution (5 mg/mL in PBS) was added to each well, and the cells were incubated for a further 4 h. Then the supernatant was removed and 200 μL DMSO was added to each well. The plate was shaken at room temperature for 10 min. Cellular viability was determined by measuring the absorbance of each well at a wavelength of 570 nm. In parallel with the MTT assay, the phase‐contrast images of the cells were acquired with an automatic inverse microscope (Leica, Solms, Germany). All experiments were repeated independently at least three times.
Cell cycle analysis
The HB cells were treated with CpG‐ODN for 12, 24, 36, and 48 h, dispersed by trypsinization, and suspended in PBS. The cells were then stained with propidium iodide using the Cycletest Plus DNA reagent kit (BD Biosciences, Franklin Lakes, NJ, USA). The fluorescence of DNA was measured using a flow cytometer (FACSCalibur; BD Biosciences), and the cell cycle distribution was analyzed by computer software (ModFit LT; BD Biosciences). The procedure was carried out according to the manufacturer's protocol. Each experiment was done three times and the average values were reported.
Colony formation assay
Anchorage‐independent growth was evaluated by the colony formation assay according to the method previously reported.13 Cells were first preincubated with or without CpG‐ODN for 24 h, then seeded into 6‐well dishes in 2 mL medium and cultured for 2 weeks to allow colonies to form. Colonies (>50 cells) were observed and photographed using a light microscope, and the number of colonies in each well was measured. Each data point represents the mean of at least three independent experiments.
Quantitative real‐time RT‐PCR
The method for qRT‐PCR has been described.14 The total RNA of the cells was isolated using the Isogen RNA extraction reagent (Nippon Gene, Tokyo, Japan). Synthesis of cDNA was done with 5 μg total RNA, 1 μg oligo(dT) primer, and 0.2 μmol dNTP, and 10 U RNase inhibitor using M‐MLV Reverse Transcriptase (Invitrogen, Carlsbad, CA, USA). Quantitative PCR was carried out using the QuantiTect SYBR Green PCR kit (Qiagen, Valencia, CA, USA) and analyzed on an iCycler iQ Real‐Time PCR Detection System (Bio‐Rad Laboratories, Hercules, CA, USA). Primer sequences were: cyclin D1 sense primer, 5′‐TACTACCGCCTCACACGCTTC‐3′; cyclin D1 antisense primer, 5′‐TTCGATCTGCTCCTGGCAG‐3′; probe, 5′‐(6‐FAM)‐ATCAAGTGTGACCCAGACTGCCTCCG‐(TAMARA)‐3′. Standard curves were generated by a serial dilution of cDNA and relative mRNA levels were measured. Expression levels were normalized against β‐actin. Results shown are representative of at least three independent experiments.
Western blot analysis
The procedure was carried out as previously described.15 Briefly, cells treated with 0.8 μM CpG‐ODN for the indicated time periods (0–24 h) were washed with PBS and incubated with lysis buffer (50 mM Tris‐HCl [pH 8.0], 150 mM NaCl, 0.1% SDS, 1% Nonidet P‐40, 0.5% sodium deoxycholate, 100 mg/mL PMSF, 1 mg/mL aprotinin) for 1 h on ice. Cell lysates were then centrifuged at 14 000g for 10 min at 4°C. The protein concentrations were determined using Bio‐Rad protein analysis (Bio‐Rad Laboratories). After SDS‐PAGE, proteins were transferred to PVDF membranes for 2 h at 80 mA. The membrane was blocked in 5% non‐fat dry milk overnight at 4°C then incubated with primary antibody for 2 h with constant shaking. The blots were washed three times with TBST followed by treatment with alkaline phosphatase‐conjugated anti‐mouse IgG (1:2000 dilutions in PBST) at room temperature for 1 h. Protein bands were detected by chemiluminescence with ECL Plus Western Blotting Detection Reagents (GE Healthcare, Piscataway, NJ, USA). β‐actin was used as the internal control protein. Experiments were repeated at least three times. The following antibodies were used: anti‐cyclin D1 antibody (dilution 1:200), anti‐cyclin E antibody (dilution 1:200), anti‐cdk2 antibody (dilution 1:300), anti‐cdk4 antibody (dilution 1:200), anti‐cdk6 antibody (dilution 1:300), anti‐c‐Jun antibody (dilution 1:200), anti‐Jun‐B antibody (dilution 1:150), anti‐Jun‐D antibody (dilution 1:200; all Santa Cruz Biotechnology, Santa Cruz, CA, USA), anti‐c‐Fos antibody (dilution 1:200), anti‐Fos‐B antibody (dilution 1:250; both Oncogene Science, Cambridge, MA, USA), anti‐phosphorylation of pRB antibody (dilution 1:250; Epitomics, Burlingame, CA, USA) and anti‐β‐actin antibody (dilution 1:10 000; Sigma, St. Louis, MO, USA).
Small interfering RNA preparation and cell transfection
Based on our previous research,16 cyclin D1 Mission shRNA Lentiviral Transduction Particles were purchased from Sigma, which included shRNA‐pLKO.1‐puro‐38. The insert sequence was CCGGGCCAGGATGATAAGTTCCTTTCTCGAGAAAGGAACTTATCATCCTGGCTTTTTG. Mission shRNA‐pLKO.1‐puro Control Transduction Particles were used as negative controls. Cell transfection was carried out on HB cells according to the manufacturer's protocol. Chemically synthesized human TLR‐9‐specific siRNAs (sense, CUGUCCUUCAAUUACCAAAtt; antisense, GUAAUUGAAGGACAGgt) and the control non‐silencing siRNA (sense, UUCUCCGAACGUGUCACGUtt; antisense, ACGUGACACGUUCGGAGAA) were purchased from MWG (Ebersberg, Germany). For siRNA transfection, 3 × 10⁵ HB cells/well were plated in 6‐well plates and transfected using Amaxa Nucleofector (Amaxa, Cologne, Germany) according to the manufacturer's protocol (Nucleofector Solution V, Nucleofector program G‐16) with 2 μg siRNA per 106 cells. After 48 h of transfection, TLR‐9 expression was tested by Western blot and further experiments were carried out.
Luciferase reporter gene assay
The AP‐1 luciferase assay was carried out as previously described.17 The HB cells were transfected with the pAP‐1‐Luciferase reporter construct using Lipofectamine 2000 (Invitrogen). After transfection, the medium was replaced and cells were cultured for 24 h. Cells were plated in 24‐well plates and treated with 0.8 μM CpG‐ODN for 0–24 h. Luciferase activities were measured by a luminometer (Berthold Detection Systems, Oak Ridge, TN, USA) using the Dual‐Luciferase Reporter Assay (Promega, Madison, WI, USA) according to the manufacturer's instructions. The transfected efficiency was normalized by cotransfection with phRL‐TK as an internal control, and all transient transfections were repeated in three independent experiments.
Confocal microscopy
The HB cells were cultured on coverslips for 24 h, then fixed in 4% paraformaldehyde for 15 min, washed in PBS, and treated for 15 min with PBS containing 0.1% TritonX‐100. The cells were then washed, blocked with 10% BSA for 1 h at room temperature and incubated at 4°C overnight with anti‐cyclin D1 mAb (dilution 1:150; Santa Cruz Biotechnology) diluted in 0.1% BSA. After extensive washing, a 1:200 dilution of FITC‐conjugated goat anti‐mouse IgG was applied as the secondary antibody for 1 h at room temperature. The slides were then washed and photographed with a laser scanning confocal microscope (TCS SP2; Leica). The negative control was treated with PBS instead of TLR‐9 antibody.
Nuclear extract and EMSA
The HB cells were treated with 0.8 μM CpG‐ODN for the indicated time period (0–24 h), and nuclear extracts were prepared as described previously.18 Synthetic complementary oligonucleotides were 3′‐biotinylated using the biotin 3′‐end DNA labeling kit (Pierce, Rockford, IL, USA), according to the manufacturer's instructions, and annealed for 2 h at room temperature. The sequences of the oligonucleotides used were 5′‐CGCTTGATGAGTCAGCCGGAA‐3′ and 5′‐AGTTGAGGGGACTTTCCCAGG‐3′ for AP‐1 and NF‐κB, respectively. Binding reactions were carried out for 20 min at room temperature in the presence of 50 ng/μL poly(dI‐dC), 0.05% Nonidet P‐40, 5 mM MgCl2, 10 mM EDTA, and 2.5% glycerol in 1× binding buffer (LightShift Chemiluminescent EMSA Kit; Pierce) using 20 μmol biotin end‐labeled target DNA and 5 μg nuclear extract. Unlabeled target DNA (4 pmol) or 2 μL anti‐CREB or anti‐ATF‐1 antibody (TransCruz; Santa Cruz Biotechnology) was added per 20 μL binding reaction where indicated. Assays were loaded onto native 4% polyacrylamide gels pre‐electrophoresed for 60 min in 0.5× Tris borate/EDTA and electrophoresed at 100 V before being transferred onto a positively charged nylon membrane (Hybond‐N+; GE Lifesciences) in 0.5× Tris borate/EDTA at 100 V for 30 min. Transferred DNAs were cross‐linked to the membrane at 120 mJ/cm2 and detected using HRP‐conjugated streptavidin (LightShift Chemiluminescent EMSA Kit, Pierce) according to the manufacturer's instructions. Specific binding was controlled by competition with a 100‐fold excess of non‐labeled AP‐1 or NF‐κB oligonucleotide probes.
Chromatin immunoprecipitation assays
The ChIP assays and subsequent real‐time PCR analysis were carried out as described.19 Briefly, cells were washed twice with PBS and cross‐linked with 1% formaldehyde at room temperature for 10 min. Cells were rinsed with ice‐cold PBS twice and resuspended into 100 mmol/L Tris‐HCl (pH 9.4) and 10 mmol/L DTT, and incubated for 15 min at 30°C. Cells were washed and resuspended in lysis buffer (1% SDS, 10 mmol/L EDTA, 50 mmol/L Tris‐HCl [pH 8.1], 1× protease inhibitor cocktail [Roche Diagnostics, Mannheim, Germany]) and sonicated three times for 10 s each pulse at the maximum setting (Model 300 Sonic Dismembrator; Fisher Scientific, Pittsburgh, PA, USA), followed by centrifugation for 10 min. Immunoprecipitations were carried out overnight at 4°C with anti‐c‐Fos, anti‐Jun‐D, anti‐p50, or anti‐p65 (Santa Cruz Biotechnology). Precipitates were washed and heated at 65°C to reverse cross‐linking and DNA fragments purified using the QIAquick Spin Kit (Qiagen) for subsequent PCR. The PCR primers specific to the AP‐1 binding region of the human cyclin D1 promoter were: 5′‐ATTCAGTCCCAGGGCAAATTCTAAA‐3′ and 5′‐CCTTCATCTTGT‐CCTTCTAGCCTGG‐3′. The PCR primers specific to the NF‐κB binding region of cyclin D1 promoter were: 5′‐AGTCCGTGTGACGTTACTGTTGT‐3′ and 5′‐CTCCCGCTCCCATTCTCT‐3′.
Statistics
Data are presented as the mean ± standard errors from at least three independent experiments. The anova test was used to evaluate the differences among the groups treated with each concentration of CpG‐ODN, and the differences between two groups were assessed using Student's t‐test. Statistical significance was defined as P < 0.05 for all tests.
Results
Increased growth of HIOEC and HB cells
To determine the effect of CpG‐ODN on the growth of normal oral epithelial cells, HIOEC cells and HB cells, the cell viability was assessed by MTT assay. As shown in Figure 1(a,b), CpG‐ODN only slightly promotes normal oral epithelial cell proliferation, but CpG‐ODN treatment could significantly stimulate cell proliferation in HIOEC and HB cells in a dose‐dependent manner, with a 30% and 50% increase, respectively, in cells treated with 0.8 μM CpG‐ODN for 48 h. The effect was further confirmed by a time course study (Fig. 1c). In addition, the typical phase‐contrast images of HB cells (Fig. 2) revealed a remarkable proliferation‐promoting effect of CpG‐ODN treatment.
Figure 1.
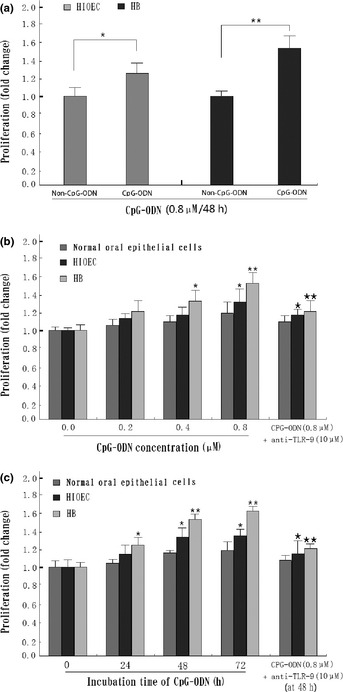
Effect of CpG‐oligonucleotides (CpG‐ODN) on growth of human immortalized oral epithelial cells (HIOEC) and cancerous HB cells. (a) CpG‐ODN treatment led to enhanced proliferation of HIOEC and HB cells compared with the non‐CpG‐ODN group. *P < 0.05; **P < 0.01. (b) Exponentially growing HIOEC/HB cells were treated with various concentrations of CpG‐ODN for 24 h and analyzed by MTT assay. *P < 0.05; **P < 0.01, compared with panel 1 (0 μM CpG‐ODN). *P < 0.05; **P < 0.01, compared with panel 4 (0.8 μM CpG‐ODN). (c) Time‐dependent effects on cell viability in the presence of 0.8 μM CpG‐ODN by MTT assay. *P < 0.05; **P < 0.01, compared with panel 1 (0 h group). *P < 0.05; **P < 0.01, compared with panel 3 (48 h group). The data shown are the mean ± SD of three independent experiments. TLR‐9, Toll‐like receptor‐9.
Figure 2.
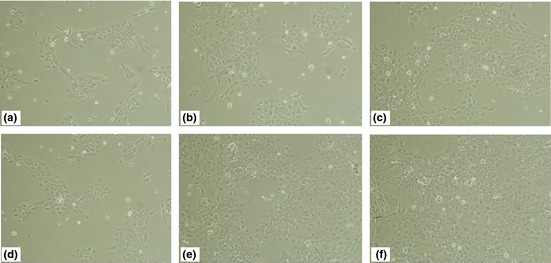
Typical phase‐contrast images of cancerous HB cells treated with 0.8 μM CpG‐oligonucleotide for 24–72 h, taken using a light microscope. Images taken at 24 h (d), 48 h (e), and 72 h (f). Original magnification, ×100. Images of untreated HB cells at 24 h (a), 48 h (b), and 72 h (c) were used as the control. Original magnification, ×100.
Promotion of G 1/S cell cycle progression in HB cells
To gain insights into the mechanisms of CpG‐ODN‐promoted cell growth, the cell cycle distribution of HB cells was analyzed by flow cytometry. Representative flow histograms depicting cell cycle distribution in HB cultures following a 48 h exposure to non‐CpG‐ODN or CpG‐ODN (0.2–0.8 μM) are shown in Figure 3(a). Exposure of HB cells to CpG‐ODN resulted in the promotion of G1/S cell cycle progression, which was accompanied by a decrease in G1 phase and a subsequent increase in S phase (Fig. 3b). These results suggested that CpG‐ODN‐mediated growth stimulation of HB cells had a close relationship with G1/S phase cell cycle promotion.
Figure 3.
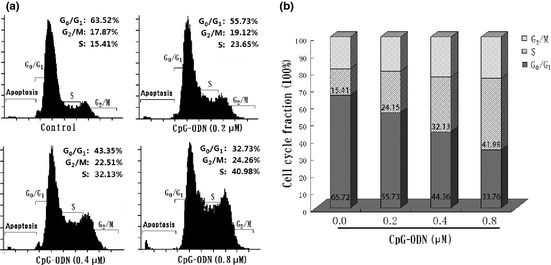
Effects of CpG‐oligonucleotides (CPG‐ODN) on HB cell cycle progression. (a) Representative flow histograms depicting cell cycle distribution in HB cells treated for 48 h with non‐CpG‐ODN (control) or CpG‐ODN (0.2–0.8 μM). (b) Cell cycle distribution in HB cells shows a decreased G 1 phase accompanied with the increased S phase after CpG‐ODN treatment. Results shown are the mean ± SD from three independent experiments. The fraction of cells in the G 0/G 1, S, and G 2/M phases are indicated.
Cyclin D1/CDK4 and phospho‐pRB expression upregulated by CpG‐ODN
To further investigate the possible mechanism of CpG‐ODN‐induced cell cycle promotion in HB cells, the protein levels of G1/S‐specific cyclins and CDKs were tested by Western blot, including cyclin D1, cyclin E, CDK2, CDK4, and CDK6, and quantified using densitometric analysis. Results show that CpG‐ODN‐treated HB cells showed an increase in protein levels of cyclin D1, whereas constitutive expression of cyclin E was not changed in this cell line. In addition, a marked increase in protein levels of CDK4 as well as phospho‐pRb were observed in CpG‐ODN‐treated HB cells (Fig. 4a,b). Furthermore, qRT‐PCR analysis showed that CpG‐ODN treatment could increase cyclin D1 expression from the transcription level in line with the protein level (Fig. 4c). Evaluated expression of cyclin D1 was found mainly distributed in the nuclear region of HB cells treated with 0.8 μM CpG‐ODN by confocal detection, especially 24 h after treatment. Further densitometric analysis shows a significant difference between the experimental and control group (Fig. 4e). In addition to the increased expression of cyclin D1, CpG‐ODN treatment could also significantly promote colony formation of HB cells in vitro, and this effect could partly be inhibited by the addition of anti‐TLR‐9 mAb (Fig. 4f). We also showed that the blockage of cyclin D1 expression by shRNA can abolish the effects of CpG‐ODN treatment in HB cells (Fig. 4d).
Figure 4.
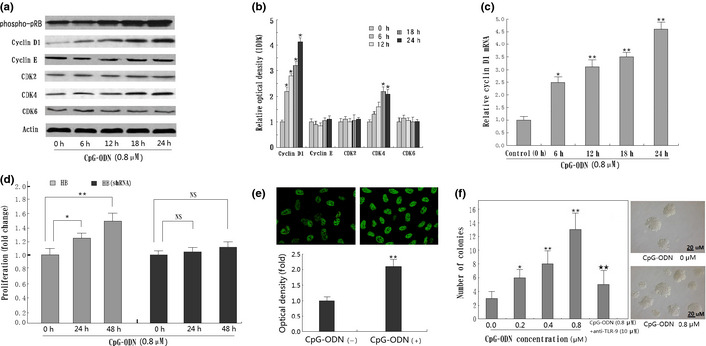
CpG‐oligonucleotides (CpG‐ODN) increase cyclin D1 expression as well as colony formation in HB cells. (a) Western blot for cyclin D1, cyclin E, cyclin‐dependent kinase (CDK)2, CDK4, CDK6, and phospho‐pRB using lysates from HB cells treated with 0.8 μM CpG‐ODN for the indicated time periods (0–24 h). Immunoblotting for each protein was done three times or more using independently prepared lysates, with similar results. (b) Changes in protein levels compared with control as determined by densitometric scanning of the immunoreactive bands. *P < 0.05; **P < 0.01. (c) Detection of cyclin D1 mRNA by quantitative RT‐PCR in CpG‐ODN‐treated HB cells. Result shows CpG‐ODN treatment increased the cyclin D1 transcriptive level in a time‐dependent manner. *P < 0.05; **P < 0.01, compared to the non‐treatment group. (d) Blockage of cyclin D1 expression by RNA interference can significantly abolish the effects of CpG‐ODN treatment in HB cells. *P < 0.05; **P < 0.01. NS, not significant. (e) Detection of cyclin D1 protein in HB cells nuclear by confocal microscope. Semiquantitative analysis based on optical density shows significantly increased cyclin D1 in CpG‐ODN‐treated HB cells than in the non‐treatment group. *P < 0.05; **P < 0.01. (f) Colony formation of HB cells treated with various concentrations of CpG‐ODN (0–0.8 μM) for 24 h. Results shown are the mean ± SD from three independent experiments. TLR‐9, Toll‐like receptor‐9. *P < 0.05; **P < 0.01, compared with panel 1 (0 μM CpG‐ODN). *P < 0.05; **P < 0.01, compared with panel 4 (0.8 μM CpG‐ODN).
Cyclin D1 expression enhanced by CpG‐ODN through AP‐1 pathway
In order to examine the transcription factors mediating CpG‐ODN‐induced cyclin D1 expression, we used the AP‐1 luciferase gene reporter assay. Results showed that treatment with CpG‐ODN significantly increased the relative promoter activities of the HB cells, which were almost 2.75‐fold higher compared to the same vector‐transfected cells without CpG‐ODN treatment (Fig. 5a). The EMSA assay also showed increased AP‐1 activity in CpG‐ODN‐treated HB cells, especially at 24 h after treatment, and this effect could be significantly decreased by anti‐TLR‐9 protein or special siRNA against TLR‐9 (Fig. 5b,c). To find the exact subunits changed in this procedure, Western blot analysis was used with antibodies against c‐Jun, Jun‐B, Jun‐D, c‐Fos, and Fos‐B using proteins from nuclear extracts. Results showed that treatment with CpG‐ODN significantly increased the expression of c‐Fos and Jun‐D, indicating that complexes composed of these two proteins may play a more important role in CpG‐ODN‐induced AP‐1 activation in HB cells (Fig. 5d). Further ChIP analysis also showed that CpG‐ODN treatment enhanced the DNA‐binding activity of AP‐1 (c‐Fos/Jun‐D) to the promoter of cyclin D1 in a time‐dependent manner (Fig. 5e). Moreover, the increased cyclin D1 expression induced by CpG‐ODN, as well as cell growth, was significantly suppressed by treatment with curcumin (an AP‐1 inhibitor). Blockade of TLR‐9 with RNA interference could significantly decrease CpG‐ODN‐stimulated cyclin D1 expression as well as cell growth, which further confirmed that AP‐1 activation was involved in CpG‐ODN‐induced cyclin D1 expression and subsequent cell proliferation (Fig. 5f).
Figure 5.
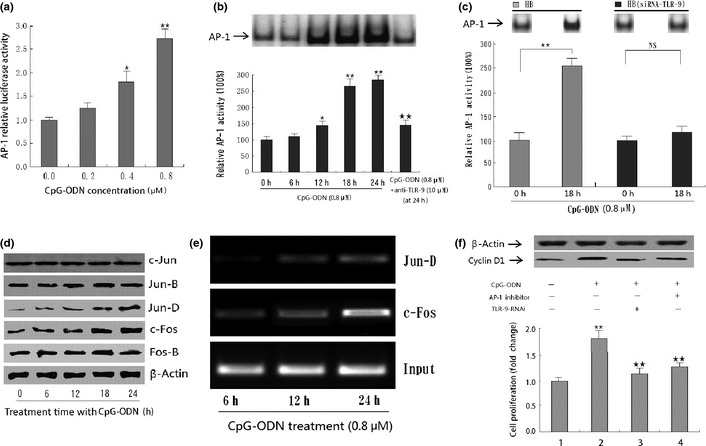
Effect of CpG‐oligonucleotides (CpG‐ODN) on activator protein‐1 (AP‐1) activity in HB cells. (a) CpG‐ODN increased the AP‐1 activity in a dose‐dependent manner in HB cells by luciferase gene report assay. The graphs represent the means and standard deviations from three individual experiments. Statistically significant difference: *P < 0.05; **P < 0.01. (b) EMSA analysis of AP‐1 in HB cell lines before and after treatment with 0.8 μM CpG‐ODN for the indicated time period (0–24 h). *P < 0.05; **P < 0.01, compared with panel 1 (0 h group). **P < 0.01, compared with panel 5 (24 h group). (c) CpG‐ODN treatment did not enhance AP‐1 activity in HB cells transfected with special siRNA against Toll‐like receptor‐9 (TLR‐9). *P < 0.05; **P < 0.01. NS, not significant. (d) Effects of CpG‐ODN on the expression of AP‐1 subunit. HB cells were treated with 0.8 μM CpG‐ODN for the indicated time period (0–24 h) and the protein levels were determined using Western blot. β‐actin served as an internal control. (e) ChIP analysis showing that CpG‐ODN treatment enhances the DNA binding activity of AP‐1 (c‐Fos/Jun‐D) to the promoter of cyclin D1 in a time‐dependent manner. (f) Interferon effect of AP‐1 inhibitor and/or special siRNA against TLR‐9 on the CpG‐ODN‐induced cyclin D1 expression as well as cell growth in HB cells. **P < 0.01, compared with panel 1 (first column); **P < 0.01, compared with panel 2 (second column). All data are the mean ± SD of three repeats from one independent study.
Nuclear factor‐κB contributes little to CpG‐ODN‐stimulated cyclin D1 expression
To further determine whether the NF‐κB pathway contributes to CpG‐ODN‐stimulated cyclin D1 expression in HB cells, EMSA and ChIP assay on NF‐κB activity were carried out. As shown in Figure 6(a,b), treatment with 0.8 μM CpG‐ODN did not result in an increase in NF‐κB DNA‐binding activity in HB cells for almost 48 h when compared with the non‐treatment group. In contrast, use of PDTC (a special NF‐κB inhibitor) could significantly decrease the NF‐κB activity in HB cells. Moreover, the results of MTT and subsequent Western blot assays showed that CpG‐ODN‐stimulated cyclin D1 expression as well as cell proliferation could not be downregulated by special NF‐κB inhibitor, which suggests that the NF‐κB pathway contributes little to CpG‐ODN‐stimulated cyclin D1 expression (Fig. 6c).
Figure 6.
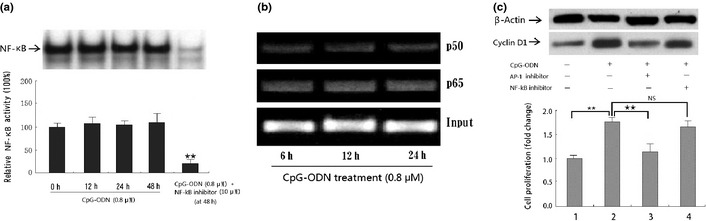
Effect of CpG‐oligonucleotides (CpG‐ODN) on nuclear factor‐κB (NF‐κB) activity in HB cells. (a) EMSA analysis of NF‐κB in HB cells before and after treatment with 0.8 μM CpG‐ODN or pyrrolidinedithiocarbamate for the indicated time period (0–48 h). **P < 0.01, compared with panel 4 (48 h group). (b) ChIP analysis showing that CpG‐ODN treatment does not enhance the DNA binding activity of NF‐κB (p65/p50) to the promoter of cyclin D1 in HB cells. (c) Interferon effect of NF‐κB inhibitor on CpG‐ODN‐induced cyclin D1 expression as well as cell growth in HB cells. **P < 0.01, compared with panel 1 (first column). **P < 0.01, compared with panel 2 (second column). All data presented are the mean ± SD of three repeats from one independent study.
Discussion
Our previous studies have shown a gradually increasing expression of TLR‐9 protein in inflammatory oral mucosa and OSCC tissues, which suggest that TLR‐9 could play a key role in malignant transformation of oral mucosa.10 However, the exact molecular mechanism by which TLR‐9 contributes to this process has not been defined. In the present study, based on our previously established HIOEC and HB cells,11, 12 we had the opportunity to further investigate the role TLR‐9 plays in oral mucosa carcinogenesis in vitro.
The present study clearly showed that proliferation of both HIOEC and HB cells was significantly stimulated by TLR‐9 agonist CpG‐ODN, which was accompanied by G1/S phase cell cycle promotion, especially in HB cells. Given the fact that uncontrolled cell proliferation is always the hallmark of malignant transformation of normal tissue, and inhibition of such action may be taken as a mechanism to suppress carcinogenesis,20 the present study indicates that TLR‐9 could be recognized as a potential biomarker for OSCC prevention and treatment.
Cyclin D1 is an important protein in cell cycle regulation. It binds to and activates its kinase partners CDK4 and CDK6, resulting in effecting transcription of genes that promote progression to cyclin D1.21 In the 1990s, Bartkova and Akervall first reported the abnormal expression of cyclin D1 in head and neck squamous cell carcinoma (HNSCC) and its close relationship with patient survival. 22, 23 In 2001, Rousseau and Shintani found that these aberrations are not only present in OSCC but also in precancerous oral epithelial dysplastic lesions, which suggested that cyclin D1 deregulation is an early event in the neoplastic process.24, 25 Consistent with their study, at the cellular level, we showed that cyclin D1 was significantly overexpressed in HB cells, especially after CpG‐ODN stimulation. We also found that the CpG‐ODN‐mediated promotion of the G1/S fraction is accompanied by increased CDK4 and phospho‐pRB expression, and anti‐TLR‐9 protein could inhibit this effect. Thus, we draw the conclusion that increased HB cell proliferation by CpG‐ODN was most likely caused by the TLR‐9‐mediated activation of the CDK4/cyclin D1 kinase complex.
The cyclin D1 promoter contains two important transcriptional elements, which are the binding sites of AP‐1 and NF‐κB.26, 27 As the most frequently involved inflammatory signal transduction pathways, both NF‐κB and AP‐1 were shown to participate in the development of OSCC.28, 29 In the present work, CpG‐ODN was found to induce AP‐1 DNA binding activity, which is a potential activator of cyclin D1 in HB cells. Use of anti‐TLR‐9 antibody could reduce the CpG‐ODN‐stimulated increase in cyclin D1 expression as well as AP‐1 DNA binding activity. Moreover, blockade of AP‐1 activity with a special inhibitor significantly reduced CpG‐ODN‐stimulated TLR‐9‐mediated cyclin D1 expression and subsequent cell proliferation. These results are consistent with previous reports, in that special stimulators can upregulate the cyclin D1 protein level and promote tumor cell cycle transit through activation of the AP‐1 signal transduction pathway in human glioblastoma cells.30 In fact, accumulating evidence suggests a close relationship between AP‐1 activity and oral mucosa carcinogenesis. Constitutive AP‐1 activation by transfection or induction of c‐Jun and c‐Fos has been shown to induce malignant conversion of squamous cell carcinoma in murine models.31, 32 Conversely, transfection of a competitive dominant negative c‐Jun or treatment with inhibitors of AP‐1 activation can block the malignant conversion of promotion‐sensitive cell lines.33, 34 Thus, it is noteworthy that TLR‐9 might play a key role in this procedure and TLR‐9 targeted molecular therapy could provide a new approach in OSCC prevention among high risk populations, such as people with leukoplakia or lichen planus.
Nuclear factor‐κB is another important regulator for cyclin D1 expression and is widely accepted to have a close relation with OSCC.35, 36, 37 In human prostate cancer, Kundu et al. reported that the NF‐κB pathway was significantly activated after treatment with TLR‐9 agonist CpG‐ODN.38 Di et al. also found that CpG‐ODN could stimulate prostate cancer invasion through the activation of NF‐κB‐mediated cyclooxygenase‐2 expression.39 However, contrary to these reports, the present study shows that CpG‐ODN only led to a tenuous change in NF‐κB activity in HB cells, with no statistical significance. Also, inhibition of NF‐κB activity with PDTC did not significantly decrease CpG‐ODN‐stimulated cyclin D1 expression or subsequent cell proliferation, indicating that the NF‐κB pathway contributes little to CpG‐ODN‐stimulated cyclin D1 expression in OSCC HB cells.
In summary, our results show that CpG‐ODN stimulates tumor cell proliferation through TLR‐9‐mediated AP‐1‐activated cyclin D1 expression in oral squamous cell carcinoma HB cells (Fig. 7). The results presented here provide not only a new insight into the molecular mechanism underlying CpG‐ODN‐stimulated OSCC cell proliferation but also a new therapeutic approach for targeting the TLR‐9/AP‐1/cyclin D1 pathway in the prevention as well as treatment of OSCC.
Figure 7.
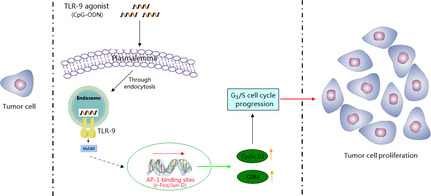
Schematic diagram of the role of Toll‐like receptor‐9 (TLR‐9) on CpG‐oligonucleotide (CpG‐ODN)‐stimulated proliferation of oral squamous cell carcinoma cells. AP‐1, activator protein‐1; CDK, cyclin‐dependent kinase.
Disclosure Statement
The authors have no conflict of interest.
Abbreviations
- AP‐1
activator protein‐1
- CDK
cyclin‐dependent kinase
- CpG‐ODN
CpG‐oligonucleotides
- HIOEC
human immortalized oral epithelial cells
- NF‐κB
nuclear factor‐κB
- OSCC
oral squamous cell carcinoma
- PDTC
pyrrolidine dithiocarbamate
- phospho‐pRB
phosphorylated‐retinoblastoma protein
- qRT‐PCR
quantitative RT‐PCR
- TLR‐9
Toll‐like receptor‐9
Acknowledgments
We thank Dr Guoqing Zhang for statistical analysis and Dr Amy Guo for language correction. This study was supported by the National Natural Science Foundation of China (Grant No. 81102049), the Natural Science Foundation of Shanghai (Grant No. 11ZR1420600), and the Shanghai Leading Academic Discipline Project (Project No. S30206).
(Cancer Sci 2012; 103: 1938–1945)
References
- 1. Jemal A, Siegel R, Ward E et al Cancer statistics. CA Cancer J Clin 2006; 56: 106–30. [DOI] [PubMed] [Google Scholar]
- 2. Ferlay J, Shin HR, Bray F, Forman D, Mathers C, Parkin DM. Globocan 2008, Cancer Incidence and Mortality Worldwide: IARC Cancer Base No. 10 Internet. Lyon, France: International Agency for Research on Cancer, 2010. Available from URL: http:// globocan.iarc.fr. [Google Scholar]
- 3. Scully C, Bagan J. Oral squamous cell carcinoma overview. Oral Oncol 2009; 45: 301–8. [DOI] [PubMed] [Google Scholar]
- 4. Mignogna MD, Fedele S, Lo Russo L, Lo Muzio L, Bucci E. Immune activation and chronic inflammation as the cause of malignancy in oral lichen planus: is there any evidence? Oral Oncol 2004; 40: 120–30. [DOI] [PubMed] [Google Scholar]
- 5. Waldron CA, Shafer WG. Leukoplakia revisited: a clinicopathologic study 3256 oral leukoplakias. Cancer 1975; 36: 1386–92. [DOI] [PubMed] [Google Scholar]
- 6. Sigurgeirsson B, Lindelöf B. Lichen planus and malignancy. An epidemiologic study of 2071 patients and a review of the literature. Arch Dermatol 1991; 127: 1684–8. [DOI] [PubMed] [Google Scholar]
- 7. Ragin CC, Modugno F, Gollin SM. The epidemiology and risk factors of head and neck cancer: a focus on human papillomavirus. J Dent Res 2007; 86: 104–14. [DOI] [PubMed] [Google Scholar]
- 8. O'Neill LA. Signal transduction pathways activated by the IL‐1 receptor/Toll‐like receptor super family. Curr Top Microbiol Immunol 2002; 270: 47–61. [PubMed] [Google Scholar]
- 9. Takeda K, Akira S. Toll‐like receptors in innate immunity. Int Immunol 2005; 17: 1–14. [DOI] [PubMed] [Google Scholar]
- 10. Ruan M, Zun Z, Siyi L, Wenjun Y, Lizheng W, Chenping Z. Increased expression of Toll‐like receptor‐9 has close relation with tumour cell proliferation in oral squamous cell carcinoma. Arch Oral Biol 2011; 56: 877–84. [DOI] [PubMed] [Google Scholar]
- 11. Sdek P, Zhang ZY, Cao J, Pan HY, Chen WT, Zheng JW. Alteration of cell‐cycle regulatory proteins in human oral epithelial cells immortalized by HPV16 E6 and E7. Int J Oral Maxillofac Surg 2006; 35: 653–7. [DOI] [PubMed] [Google Scholar]
- 12. Zhong LP, Pan HY, Zhou XJ et al Characteristics of a cancerous cell line, HIOEC‐B(a)P‐96, induced by benzo(a)pyrene from human immortalized oral epithelial cell line. Arch Oral Biol 2008; 53: 443–52. [DOI] [PubMed] [Google Scholar]
- 13. Jin X, Song X, Li L et al Blockade of AP‐1 activity by dominant‐negative TAM67 can abrogate the oncogenic phenotype in latent membrane protein 1‐positive human nasopharyngeal carcinoma. Mol Carcinog 2007; 46: 901–11. [DOI] [PubMed] [Google Scholar]
- 14. Medeiros LJ, Hai S, Thomazy VA, Estalilla OC, Romaguera J, Luthra R. Real‐time RT‐PCR assay for quantifying cyclin D1 mRNA in B‐cell non‐Hodgkin's lymphomas. Mod Pathol 2002; 15: 556–64. [DOI] [PubMed] [Google Scholar]
- 15. Min R, Tong J, Wenjun Y et al Growth inhibition and induction of apoptosis in human oral squamous cell carcinoma Tca‐8113 cell lines by Shikonin was partly through the inactivation of NF‐κB pathway. Phytother Res 2008; 22: 407–15. [DOI] [PubMed] [Google Scholar]
- 16. Zhou X, Zhang Z, Yang X, Chen W, Zhang P. Inhibition of cyclin D1 expression by cyclin D1 shRNAs in human oral squamous cell carcinoma cells is associated with increased cisplatin chemosensitivity. Int J cancer 2009; 124: 483–9. [DOI] [PubMed] [Google Scholar]
- 17. Lin CW, Hou WC, Shen SC et al Quercetin inhibition of tumor invasion via suppressing PKC delta /ERK/AP‐1‐dependent matrix metalloproteinase‐9 activation in breast carcinoma cells. Carcinogenesis 2008; 29: 1807–15. [DOI] [PubMed] [Google Scholar]
- 18. Kaomongkolgit R, Cheepsunthorn P, Pavasant P, Sanchavanakit N. Iron increases MMP‐9 expression through activation of AP‐1 via ERK/Akt pathway in human head and neck squamous carcinoma cells. Oral Oncol 2008; 44: 587–94. [DOI] [PubMed] [Google Scholar]
- 19. Toualbi‐Abed K, Daniel F, Güller MC et al Jun D cooperates with p65 to activate the proximal kB site of the cyclin D1 promoter: role of PI3K/PDK‐1. Carcinogenesis 2008; 29: 536–43. [DOI] [PubMed] [Google Scholar]
- 20. Hanahan D, Weinberg RA. The hallmarks of cancer. Cell 2000; 100: 57–70. [DOI] [PubMed] [Google Scholar]
- 21. Knudsen KE, Diehl JA, Haiman CA, Knudsen ES. Cyclin D1: polymorphism, aberrant splicing and cancer risk. Oncogene 2006; 25: 1620–8. [DOI] [PubMed] [Google Scholar]
- 22. Bartkova J, Lukas J, Muller H, Strauss M, Gusterson B, Bartek J. Abnormal patterns of D‐type cyclin expression and G1 regulation in human head and neck cancer. Cancer Res 1995; 55: 949–56. [PubMed] [Google Scholar]
- 23. Akervall JA, Michalides RJ, Mineta H et al Amplification of cyclin D1 in squamous cell carcinoma of the head and neck and the prognostic value of chromosomal abnormalities and cyclin D1 overexpression. Cancer 1997; 79: 380–9. [PubMed] [Google Scholar]
- 24. Rousseau A, Lim MS, Lin Z, Jordan RC. Frequent cyclin D1 gene amplification and protein overexpression in oral epithelial dysplasias. Oral Oncol 2001; 37: 268–75. [DOI] [PubMed] [Google Scholar]
- 25. Shintani S, Mihara M, Nakahara Y et al Expression of cell cycle control proteins in normal epithelium, premalignant and malignant lesions of oral cavity. Oral Oncol 2002; 38: 235–43. [DOI] [PubMed] [Google Scholar]
- 26. Shen Q, Uray IP, Li Y et al The AP‐1 transcription factor regulates breast cancer cell growth via cyclins and E2F factors. Oncogene 2008; 27: 366–77. [DOI] [PubMed] [Google Scholar]
- 27. Klein EA, Assoian RK. Transcriptional regulation of the cyclin D1 gene at a glance. J Cell Sci 2008; 121: 3853–7. [DOI] [PMC free article] [PubMed] [Google Scholar]
- 28. Mishra A, Bharti AC, Saluja D, Das BC. Transactivation and expression patterns of Jun and Fos/AP‐1 super‐family proteins in human oral cancer. Int J Cancer 2010; 126: 819–29. [DOI] [PubMed] [Google Scholar]
- 29. Rao SK, Pavicevic Z, Du Z et al Pro‐inflammatory genes as biomarkers and therapeutic targets in oral squamous cell carcinoma. J Biol Chem 2010; 285: 32512–21. [DOI] [PMC free article] [PubMed] [Google Scholar]
- 30. Ouafik L, Berenguer‐Daize C, Berthois Y. Adrenomedullin promotes cell cycle transit and up‐regulates cyclin D1 protein level in human glioblastoma cells through the activation of c‐Jun/JNK/AP‐1 signal transduction pathway. Cell Signal 2009; 21: 597–608. [DOI] [PubMed] [Google Scholar]
- 31. Yuspa SH. The pathogenesis of squamous cell cancer: lessons learned from studies of skin carcinogenesis‐thirty‐third G.H.A. Clowes memorial award lecture. Cancer Res 1994; 54: 1178–89. [PubMed] [Google Scholar]
- 32. Li JJ, Westergaard C, Ghosh P, Colburn NH. Inhibitors of both nuclear factor‐kappaB and activator protein‐1 activation block the neoplastic transformation response. Cancer Res 1997; 57: 3569–76. [PubMed] [Google Scholar]
- 33. Thompson EJ, Gupta A, Stratton MS, Bowden GT. Mechanism of action of a dominant negative c‐jun mutant in inhibiting activator protein‐1 activation. Mol Carcinog 2002; 35: 157–62. [DOI] [PubMed] [Google Scholar]
- 34. Eferl R, Wagner EF. AP‐1: a double‐edged sword in tumorigenesis. Nat Rev Cancer 2003; 3: 859–68. [DOI] [PubMed] [Google Scholar]
- 35. Guttridge DC, Albanese C, Reuther JY, Pestell RG, Baldwin AS Jr. NF‐kappaB controls cell growth and differentiation through transcriptional regulation of cyclin D1. Mol Cell Biol 1999; 19: 5785–99. [DOI] [PMC free article] [PubMed] [Google Scholar]
- 36. Myo K, Uzawa N, Miyamoto R, Sonoda I, Yuki Y, Amagasa T. Cyclin D1 gene numerical aberration is a predictive marker for occult cervical lymph node metastasis in TNM Stage I and II squamous cell carcinoma of the oral cavity. Cancer 2005; 104: 2709–16. [DOI] [PubMed] [Google Scholar]
- 37. Mishra R, Das BR. Cyclin D1 expression and its possible regulation in chewing tobacco mediated oral squamous cell carcinoma progression. Arch Oral Biol 2009; 54: 917–23. [DOI] [PubMed] [Google Scholar]
- 38. Kundu SD, Lee C, Billips BK et al The toll‐like receptor pathway: a novel mechanismof infection‐induced carcinogenesis of prostate epithelial cells. Prostate 2008; 68: 223–9. [DOI] [PubMed] [Google Scholar]
- 39. Di JM, Pang J, Sun QP et al Toll‐like receptor 9 agonists up‐regulates the expression of cyclooxygenase‐2 via activation of NF‐κB in prostate cancer cells. Mol Biol Rep 2010; 37: 1849–55. [DOI] [PubMed] [Google Scholar]