

Abstract
Both the Notch1 and PI3K/Akt pathways are aberrantly activated in clear cell renal cell carcinoma (CCRCC) and involved in the tumorigenesis. The aim of this study was to test our hypothesis that elevated Notch1 signaling activity exerts its growth‐promoting effects via the PI3K/Akt pathway in CCRCC. To investigate the relationship between the two pathways, we enhanced and suppressed the Notch1 activity respectively in a CCRCC cell line through diverse means, and then evaluated ensuing phosphorylated Akt (pAkt) levels. To further study their collaboration in promoting tumor growth, cell proliferation assay, colony formation assay and cell cycle analysis were conducted under several different conditions. Immunostaining of the tissue microarrays was used to determine whether the phenomena we observed also existed in vivo. The results showed that Notch1 signaling was activated in CCRCC tissue samples and cell lines. Notch1 activation increased CCRCC cell proliferation, enhanced anchorage‐independent growth, and accelerated G1/S cell cycle progression. Such effects of the Notch1 signaling were, at least in part, mediated by the PI3K/Akt pathway. Correlations between Notch1, pAkt and Ki‐67 protein levels in tissue microarrays reinforced our in vitro findings. Taken together, the current study established a functional link between the Notch1 and PI3K/Akt pathways in CCRCC. (Cancer Sci 2012; 103: 1253–1258)
Renal cell carcinoma (RCC), which accounts for 2–3% of all adult malignant neoplasms, is the most lethal urologic cancer. It afflicts about 150 000 people and causes nearly 78 000 deaths annually worldwide.1 Unfortunately, 25–30% of patients present with metastatic RCC when diagnosed.2 Although surgery is the primary curative therapy for patients with localized RCC, the prognosis for patients with metastatic disease is poor, with a 5‐year survival rate of <10%.3 Effective therapy for patients with metastatic RCC is still limited, even though recent advances in molecular biology have led to the development of novel agents.
Remarkably, defects in the von Hippel–Lindau tumor suppressor gene (VHL) appear to be responsible for about 60% of sporadic clear cell RCC (CCRCC) patients,4 which represents a major portion of all cases of RCC. VHL protein (pVHL) promotes the ubiquitination and destruction of α‐subunits of hypoxia inducible factors (HIF‐α) in an oxygen‐dependent manner. HIF‐α is a transcription factor that is crucial in cellular responses to hypoxia. Loss of functional pVHL leads to oxygen‐independent stabilization of HIF‐α and upregulation of a range of hypoxia‐inducible genes that regulate metabolism, glucose transport, proliferation, and angiogenesis.5 Obviously, aberrant HIF‐α stabilization contributes to malignant transformation, but sophisticated and thorough molecular analysis failed to reveal VHL gene abnormalities in a proportion of CCRCC, and the search for additional regulatory elements has continued.6, 7
Recently, a study revealed that the components of the Notch pathway are expressed and active in CCRCC independent of the function of VHL and that Notch inhibition perturbs growth of CCRCC cells in vitro.8 The Notch signaling controls a variety of cellular processes that involve cell fate determination, differentiation, proliferation, apoptosis, adhesion, epithelial‐mesenchymal transition, migration, and angiogenesis.9 In mammals, four Notch molecules (Notch1 through Notch4) are single‐pass, heterodimeric transmembrane proteins that serve as receptors for the five ligands (Jagged1, Jagged2, DLL1, DLL3, and DLL4) expressed on the neighboring cells.10 Ligand binding renders the Notch receptor susceptible to two consecutive proteolytic cleavages mediated by metalloprotease and γ‐secretase, respectively. The intracellular domain of Notch (ICN), the active form of the Notch receptor, is then cleaved from the plasma membrane and translocate into the nucleus, leading to transcription of its downstream target genes such as Hes and Hey.10, 11 Notch signaling will be either oncogenic or tumor suppressive depending on cell type and context.
In this study, we sought to elucidate how Notch1 activation serves an oncogenic function in CCRCC. Our results showed that Notch1 activation promotes renal cell carcinoma growth via the PI3K/Akt signaling, which has been proven to be constitutively activated in CCRCC.12 This may serve as an important molecular mechanism for Notch1‐mediated carcinogenesis of CCRCC.
Materials and Methods
Patients and samples
In the present study, all patients diagnosed with sporadic RCC underwent a radical nephrectomy or nephron‐sparing surgery at the Department of Urology, Zhongshan Hospital, Fudan University, and were later pathologically confirmed to be clear‐cell type. Sample collection protocols were approved by the hospital's ethics committee and informed consent was obtained from each patient. For Western blot, 16 pairs of fresh tumor tissues and corresponding macroscopically normal kidney tissues were collected intra‐operatively. The samples were then snap‐frozen in liquid nitrogen and stored at −80°C until analysis. For immunostaining, tissue microarrays containing samples from 125 patients were constructed. Two tissue cores, 1.0 mm in diameter, were taken from representative formalin‐fixed, paraffin‐embedded tumor tissue for each patient.
Cell culture, reagents, constructs, and transfections
Three CCRCC cell lines ACHN (VHL+/+), 786‐0 (VHL−/−) and OS‐RC‐2 were purchased from the Type Culture Collection, Chinese Academy of Sciences (Shanghai, China), and one immortalized human renal proximal tubular epithelial cell line HKC was kindly provided by Dr. Donghai Wen (Fudan University, Shanghai, China). Cells were maintained in Dulbecco's modified eagle medium (DMEM) supplemented with 10% fetal bovine serum (FBS) and 1% penicillin‐streptomycin. All cultures were maintained in a humidified incubator at 37°C and 5% CO2. Ten μM γ‐secretase inhibitor N‐(N‐[3,5‐difluorophenacetyl]‐L‐alanyl)‐S‐phenylglycine t‐butyl ester (DAPT) and 25 μM PI3K inhibitor LY‐294002 (Sigma‐Aldrich, St. Louis, MO, USA) were used in the experiments. pcDNA3‐intracellular domain of Notch1 (ICN1) plasmid was kindly provided by Dr Jon C. Aster (Brigham and Women's Hospital, Boston, MA, USA). HA‐tagged dominant negative Akt (DN‐Akt) plasmid was a generous gift from Dr Mien‐Chie Hung (MD Anderson Cancer Center, Houston, TX, USA). Plasmid transfections were performed using Lipofectamine 2000 (Invitrogen, Carlsbad, CA, USA). Cells were harvested 48 h later for further experiments and analyses. Control and Notch1 siRNA (Santa Cruz Biotechnology, Santa Cruz, CA, USA) transfections were conducted with X‐tremeGENE (Roche Applied Science, Mannheim, Germany). Cells were harvested 72 h after siRNA transfection for Western blot analysis. For stimulation with ligand Jagged1, cells were seeded in six‐well plates pre‐coated with 10 μg/mL human IgG or recombinant human Jagged1 Fc chimera (R&D Systems, Minneapolis, MN, USA) in PBS overnight at 4°C. Cells were harvested 48 h later to evaluate protein expression.
Western blot analysis
Protein extraction from cultured cells or human tissues and western blot analysis were performed as described previously.13 Antibodies that recognize Jagged1, Hes1 and HA‐tag were purchased from Santa Cruz Biotechnology. Antibodies against ICN1, phospho‐Akt (Ser473), and total Akt were from Cell Signaling Technology (Danvers, MA, USA). Western blot bands were quantified using ImageJ software.
Cell proliferation assay
Cell proliferation was measured using the Cell Counting Kit‐8 (Dojindo, Kumamoto, Japan) according to the manufacturer's instructions. Cells were incubated with CCK‐8 for 1 h at indicated time points 2 days after transfection. Proliferation rate was assessed by measuring the absorbance at 450 nm.
Cell‐cycle analysis
Cell‐cycle analysis was performed via fluorescence‐activated cell sorting. Two days after transfection and/or LY‐294002 administration (25 μM), cells were trypsinized and fixed with ice‐cold 70% ethanol. For DNA content analysis, cells were incubated with 40 μg/mL propidium iodide (Sigma‐Aldrich) in the presence of 100 μg/mL RNase for 30 min at 37°C. DNA content was determined on a BD FACSCalibur system. The percentage of cells in each phase of the cell cycle was calculated using the Cell Fit Program.
Soft agar colony formation assay
Two days after transfection, 3 × 10³ tumor cells per well were resuspended in DMEM or Roswell Park Memorial Institute (RPMI) 1640 containing 0.3% agarose (Promega, Madison, WI, USA). This suspension was laid over DMEM or RPMI 1640 containing 0.6% noble agarose in 6‐well plates and further overlaid with DMEM or RPMI 1640 containing 800 μg/mL G418 with or without 25 μM LY‐294002. The plates were then incubated for 14 days in a 5% CO2 incubator at 37°C, with replenishment of medium containing 800 μg/mL G418 with or without 25 μM LY‐294002 every other day. Colonies were imaged using Nikon ECLIPSE TE300 and macroscopically visible colonies in three randomly chosen fields per well were counted for quantification.
Immunohistochemistry and evaluation of staining
Immunostaining was carried out as described before.13 Primary antibodies against Notch1 (Abcam, Cambridge, MA, USA), pAkt, and Ki‐67 (DAKO, Glostrup, Denmark) were used in the procedure. Semi‐quantitative evaluation of Noch1 and pAkt expression was performed for each tumor in terms of intensity (negative, 0; weak, 1; moderate, 2; and strong, 3) and extent (absent, 0; <10%, 1; 10–50%, 2; >50%, 3). The total score of each patient was calculated by the sum of two parameters. We then designated low expression as total score 0–3, and high expression as 4–6. For Ki‐67 expression, the percentage of Ki‐67‐positive cells among the total number of cancer cells was determined. Cells were considered Ki‐67‐positive regardless of the intensity of nuclear Ki‐67 staining. In each case, the Ki‐67 staining was evaluated by counting an average number of 100 cells in three different fields at high magnification. A minimum of 300 cells were evaluated. The cutoff level of Ki‐67 was set at 5% (<5, low; ≥5%, high). The intensity of immunohistochemistry staining in tumor cells was scored independently by two pathologists.
Statistical analysis
Experimental data were presented as mean ± standard deviation (SD). Values and percentages between groups were compared using Student's t‐test and chi‐squared test, respectively. The relationships between variables were analyzed using Spearman correlation coefficient for correlation and chi‐squared test for trend. P < 0.05 was considered statistically significant.
Results
Notch1 signaling is activated in CCRCC samples
To evaluate the status of the Notch1 signaling in CCRCC tissues, we performed Western blot analysis using 16 paired tumor and normal kidney samples. Three components of the pathway were tested, Jagged1, ICN1, and Hes1. Of the 16 patients, 14 (87.5%) exhibited elevated protein levels of Jagged1, 15 (93.8.5%) increased ICN1, and 11 (68.8%) raised Hes1 in tumors compared with corresponding normal tissues (Fig. 1). These data showed that all the elements of the Notch1 cascade, from the ligand to the activated form of receptor, and to the primary downstream target, are upregulated in the majority of CCRCC samples indicating the Notch1 signaling is activated and may therefore play a role in the disease.
Figure 1.
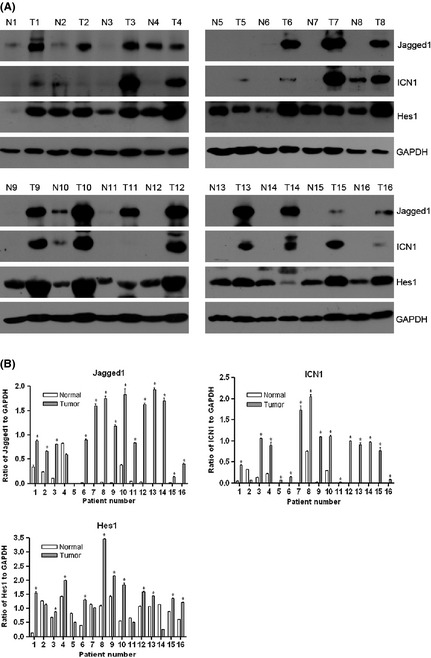
Notch1 pathway components are upregulated in primary clear cell renal cell carcinomas (CCRCCs). (A) Western blot analysis of Jagged1, ICN1, Hes1 and glyceraldehyde 3‐phosphate dehydrogenase (GAPDH) in paired normal (N) and tumor (T) tissues from 16 CCRCC patients. GAPDH was used as loading control. (B) Densitometric quantification of the Western blot bands. The ratios of the intensity of Jagged1, ICN1 and Hes1 to that of GAPDH are shown as mean ± standard deviation (SD) of three independent experiments. *P < 0.05, significant increases (tumor versus normal tissue).
PI3K/Akt pathway is regulated by Notch1 activation
Major signaling pathways altered in CCRCC include the nuclear factor‐κB (NF‐κB),14 mitogen‐activated protein kinase (MAPK)15 and PI3K/Akt12 pathways besides the VHL‐HIF pathway. It was previously shown that Notch1 signaling promotes malignant progression by activating the PI3K/Akt pathway in other tumor models.16, 17 We, therefore, sought to determine whether Notch1 activation is also associated with alterations of the PI3K/Akt pathway in CCRCC. To measure the activity of the PI3K/Akt pathway, we examined total Akt (tAkt) expression and phosphorylated Akt (pAkt) at Ser473 in different cell lines. Western blot analysis revealed that both the Notch1 and PI3K/Akt pathways are activated in 786‐0 and ACHN regardless of the VHL status compared with HKC (Fig. 2A).
Figure 2.
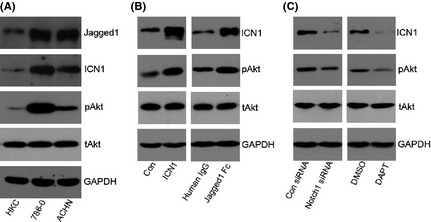
PI3K/Akt pathway is regulated by Notch1 activation. (A) Western blot analysis of Jagged1, ICN1, pAkt, tAkt and glyceraldehyde 3‐phosphate dehydrogenase (GAPDH) in HKC, 786‐0 and ACHN cells. (B) ACHN cells with Notch1 activation were assessed for Akt activity. Western blot analysis of ICN1, pAkt, tAkt and GAPDH in cells transfected with pcDNA3 empty vector control (Con) or pcDNA3‐ICN1 (ICN1), and cells stimulated with human IgG or Jagged1 Fc. (C) ACHN cells with Notch1 inhibition were assessed for Akt activity. Western blot analyses of ICN1, pAkt, tAkt and GAPDH in cells transfected with control (Con) siRNA or Notch1 siRNA, and cells treated with dimethylsulfoxide (DMSO) or N‐(N‐[3,5‐difluorophenacetyl]‐L‐alanyl)‐S‐phenylglycine t‐butyl ester (DAPT). In A–C, GAPDH was used as loading control.
Constitutive activation of Notch1 signaling, either by overexpression of ICN1 or by stimulation of the ligand Jagged1, increased the amount of pAkt in ACHN cells (Fig. 2B). Then we used Notch1 specific siRNA and DAPT, a γ‐secretase inhibitor that blocks the processing of transmembrane Notch1 to ICN1, to suppress Notch1 signaling. Likewise, both genetic and chemical inhibition of Notch1 signaling reduced the phosphorylation of Akt (Fig. 2C). Collectively, these results suggested that the PI3K/Akt pathway is downstream of Notch1 signaling in CCRCC cells.
Notch1 activation promotes CCRCC cell growth via PI3K/Akt signaling
Because Notch1 signaling was found to exert a growth‐promoting effect on the tumorigenesis of CCRCC, we hypothesized that Notch1 activation might enhance CCRCC cell growth through the PI3K/Akt signaling, which is related mostly, in some fashion, to cell proliferation and survival.18 Prior to the functional experiments, we verified transfection efficiency by transfecting ACHN cells with ICN1 plasmids at various doses. Western blot data showed that ICN1 transfection increased pAkt protein level in a dose‐dependent manner (Fig. 3A).
Figure 3.
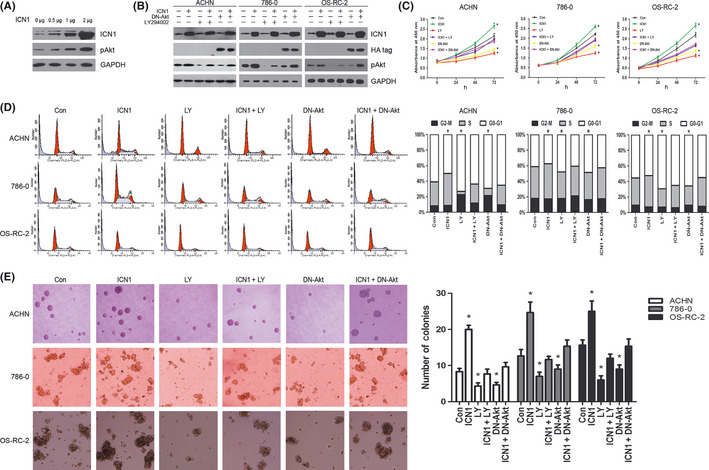
Notch1‐induced clear cell renal cell carcinomas (CCRCCs) cell growth is mediated by regulating PI3K/Akt pathway. (A) The confirmation of transfection efficiency. Western blot analysis of ICN1, pAkt in ACHN cells transiently transfected with increasing amounts of pcDNA3‐ICN1 plasmid (0, 0.5, 1 and 2 μg). glyceraldehyde 3‐phosphate dehydrogenase (GAPDH) was used as loading control. (B) Western blot analysis of ICN1, HA‐tag, pAkt, and GAPDH in three CCRCC cell lines transfected with pcDNA3 empty vector control (Con) or pcDNA3‐ICN1 (ICN1), tumor cells treated with LY294002 (LY) without or with pcDNA3‐ICN1 transfection, and tumor cells transfected with HA‐tagged DN‐Akt in the absence or presence of pcDNA3‐ICN1 cotransfection. GAPDH was used as loading control. (C) Cell proliferation assay using CCK‐8 was performed to evaluate the growth of the six groups of cells as described in (B). Data are mean ± standard deviation (SD) of three independent experiments. (D) Left, cell‐cycle distribution examined by propidium iodide staining and flow cytometry of the six groups of cells as described in (B). Right, the percentage of cells present in each phase of the cell cycle is shown in bar graph. Data are representative of three independent experiments. (E) Colony formation assay was performed to analyze the anchorage‐independent growth of the six groups of cells as described in (B). Left, macroscopically visible colonies were counted in three randomly chosen fields per group. Data are mean ± SD. Right, representative fields from each group are shown. Original magnification, ×100. In C–E, *P < 0.05, compared with Con group.
To investigate whether Notch1 activation enhances cell proliferation via an augmentation of the PI3K/Akt signaling, we suppressed the latter, pharmacologically and genetically, in ICN1‐transfected ACHN, 786‐0 and OS‐RC‐2 cells (Fig. 3B). We first conducted cell proliferation assay using CCK‐8, our results revealed that acquired growth rate enhancement of ICN1‐transfected tumor cells was reversed by either the administration of LY‐294002, a PI3K inhibitor which blocks Akt phosphorylation, or the cotransfection of DN‐Akt (Fig. 3C).
To further explore the changes of cell proliferation resulting from different Notch1 and PI3K/Akt signaling statuses, cell cycle was examined by propidium iodide staining and flow cytometry. The accelerated G1/S cell cycle progression induced by ICN1 overexpression was counterbalanced by PI3K/Akt signaling inhibition in all three cell lines (Fig. 3D), which to some extent accounted for the cell growth alterations.
Anchorage‐independent growth represents a feature of malignant cells, and Notch inhibition impaired this capacity in CCRCC cells.8 We also performed colony formation assay in soft agar to elucidate whether the PI3K/Akt pathway plays a role in this process. Similarly, the clonogenic ability was elevated by ICN1 transfection and the elevation was abrogated by simultaneous LY‐294002 administration or DN‐Akt cotransfection (Fig. 3E). The results were confirmed in plural cell lines. In addition, treatment of vehicle dimethylsulfoxide (DMSO) alone did not change pAkt expression or alter cell proliferation rate, cell cycle distribution and anchorage‐independent growth (data not shown). Taken together, these findings supported the hypothesis that the PI3K/Akt pathway is, at least in part, responsible for mediating the effect of Notch1 activation on CCRCC cell proliferation and anchorage‐independent growth.
Notch1 expression correlates with clinicopathological features and pAkt and Ki‐67 levels in CCRCC samples
To find evidence for an association between Notch1 signaling, PI3K/Akt pathway, and cell proliferation in vivo, we analyzed Notch1, pAkt, and Ki‐67 (a cell proliferation marker) expression in tissue microarray containing tumor tissues from 125 CCRCC patients (Table 1). Notch1 staining was present mainly on the cell surface (Fig. 4), and 59 (47.2%) patients revealed high expression. Moreover, Notch1 expression positively correlated with tumor size (P = 0.006) and nuclear grade (P = 0.048). There was also a trend between Notch1 levels and tumor‐node‐metastasis (TNM) stage, even though it was not statistically significant (P = 0.072) (Table 1). pAkt staining mainly located in the cytoplasm (Fig. 4), and 52 (41.6%) samples displayed high expression. There was a distinct nuclear staining for Ki‐67 (Fig. 4), and 40 (32%) cases were regarded as high. Importantly, Notch1 immunostaining in the CCRCC specimens showed significant correlation with pAkt (P = 0.017) and Ki‐67 staining (P = 0.024) (Table 2). These immunohistochemical results supported our in vitro data indicating the PI3K/Akt pathway may play a role in the growth‐promoting effect of Notch1 signaling.
Table 1.
Clinicopathological features of the 125 clear cell renal cell carcinoma (CCRCC) patients and their correlations with Notch1 expression
| Characteristics | Number of patients (%) | Notch1 expression | P a | |
|---|---|---|---|---|
| Low (n = 59) | High (n = 66) | |||
| Age (years) | ||||
| <65 | 82 (65.6) | 37 | 45 | 0.520 |
| ≥65 | 43 (34.4) | 22 | 21 | |
| Gender | ||||
| Male | 79 (63.2) | 35 | 44 | 0.395 |
| Female | 46 (36.8) | 24 | 22 | |
| Tumor size (cm) | ||||
| <7 | 94 (75.2) | 51 | 43 | 0.006 |
| ≥7 | 31 (24.8) | 8 | 23 | |
| TNM stage | ||||
| I–II | 115 (92) | 57 | 58 | 0.072 |
| III–IV | 10 (8) | 2 | 8 | |
| Fuhrman grade | ||||
| 1–2 | 106 (84.8) | 54 | 52 | 0.048 |
| 3–4 | 19 (15.2) | 5 | 14 | |
chi‐squared test. TNM, tumor‐node‐metastasis.
Figure 4.
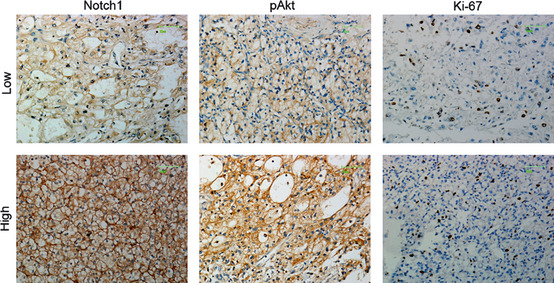
Representative immunostaining for Notch1, pAkt and Ki‐67 in clear cell renal cell carcinoma (CCRCC) tissue microarrays. Scale bar, 25 μm.
Table 2.
Notch1 immunostaining correlates with pAkt and Ki‐67 in clear cell renal cell carcinoma (CCRCC) samples
| Notch1 | pAkt | Ki‐67 | ||
|---|---|---|---|---|
| Low | High | Low | High | |
| Low | 41 | 18 | 46 | 13 |
| High | 32 | 34 | 39 | 27 |
| r | 0.213 | 0.202 | ||
| P | 0.017 | 0.024 | ||
r, Spearman correlation coefficient.
Discussion
In the present study, we showed that the Notch1 pathway is activated in both primary CCRCC and cancer cell lines as previously reported.8 The activation might be mediated by the biding of the Notch ligand Jagged1 on tumor and stromal cells to the Notch1 receptor on adjacent tumor cells according to our observation. Then we tried to figure out how Notch1 activation affects carcinogenesis in CCRCC. Since self‐sufficiency in growth signals is the first hallmark of cancer,19 we chose to focus on the relationship between Notch1 activation and cell proliferation.
Recent data give clear evidence that the PI3K/Akt pathway is constitutively activated in various human cancers, including ovarian, prostate, lung, and kidney cancers, and plays a critical role in tumorigenesis.20, 21 Activation of the PI3K/Akt pathway and its role in tumor progression were evaluated in patients with CCRCC by immunohistochemistry. Strong staining was significantly associated with tumor grade and metastatic disease.22 Another study demonstrated that the PI3K/Akt pathway is constitutively activated in human CCRCC cell lines, regardless of the VHL status.12
Here, we demonstrated that the oncogenic effect of activated Notch1 is at least partially mediated through regulation of the PI3K/Akt pathway in three CCRCC cell lines. Correspondingly, the trend found between Notch1 expression and clinicopathological parameters, and the correlations found between the levels of Notch1, pAkt, and Ki‐67 in tumor tissues reinforced this hypothesis. However, it was not surprising that LY‐294002 administration attenuated Notch1‐induced tumor cell growth and colony formation because Akt is not a Notch1 pathway‐specific target but general signaling molecules required for cell proliferation and survival. Our study placed the PI3K/Akt pathway under control of the Notch1 signaling, but we could not rule out the crosstalk between Notch1 cascade and other signaling pathways regulating cell proliferation and survival. Akt activation by the Notch1 signaling has been previously documented in several different systems.16, 23, 24 However, the mechanism by which Akt is activated is not fully understood. In T cell acute lymphoblastic leukemia, Notch1 activation could suppress PTEN expression. PTEN, defined as a tumor suppressor, attenuates Akt phosphorylation. Thus, inhibition of Notch1 activation blocks proliferative and survival signals. Whether this kind of interaction between the Notch1 and PI3K/Akt pathways occurs in other types of cancer is an interesting question that merits further investigation.25 More recently, it was reported that Notch1‐induced activation of Akt is due to the release of an autocrine factor into the culture medium in breast epithelial cells.17 Because a number of growth factors such as platelet‐derived growth factor (PDGF)‐β, vascular endothelial growth factor (VEGF), and transforming growth factor‐β (TGF‐β) contribute to the tumorigenesis of CCRCC and they are all upstream activators of the PI3K/Akt pathway,18 similar interaction between the two pathways might also exist in CCRCC. Moreover, activation of Notch1 can also be downstream of the PI3K/Akt pathway. Notch1 is a key effector of both Akt and hypoxia in melanoma,26 and the PI3K/Akt/mTOR pathway could regulate cell differentiation through the STAT3/p63/Jagged/Notch cascade in mice.27 Therefore, our future studies need to further identify the mechanism underlying the crosstalk.
Disclosure statement
The authors have no conflict of interest.
Acknowledgements
This work was supported by a grant from Zhongshan Hospital, Fudan University (to Z. L.) and a grant from Natural Science Foundation of Ningbo, China (2011A610054). We are grateful to Dr Gang Zeng at University of California, Los Angeles for critically reading the manuscript. We also thank Drs Weibin Wu and Youyou Zhang at Shanghai Medical College, Fudan University for technical advice, and Haiying Zeng and Lingli Chen at the Department of Pathology, Zhongshan Hospital, Fudan University for help with the immunohistochemical study.
References
- 1. Zbar B, Klausner R, Linehan WM. Studying cancer families to identify kidney cancer genes. Annu Rev Med 2003; 54: 217–33. [DOI] [PubMed] [Google Scholar]
- 2. Ljungberg B, Hanbury DC, Kuczyk MA et al Renal cell carcinoma guideline. Eur Urol 2007; 51: 1502–10. [DOI] [PubMed] [Google Scholar]
- 3. Schrader AJ, Varga Z, Hegele A, Pfoertner S, Olbert P, Hofmann R. Second‐line strategies for metastatic renal cell carcinoma: classics and novel approaches. J Cancer Res Clin Oncol 2006; 132: 137–49. [DOI] [PubMed] [Google Scholar]
- 4. Kim WY, Kaelin WG. Role of VHL gene mutation in human cancer. J Clin Oncol 2004; 22: 4991–5004. [DOI] [PubMed] [Google Scholar]
- 5. Semenza GL. Targeting HIF‐1 for cancer therapy. Nat Rev Cancer 2003; 3: 721–32. [DOI] [PubMed] [Google Scholar]
- 6. Clifford SC, Prowse AH, Affara NA, Buys CH, Maher ER. Inactivation of the von Hippel‐Lindau (VHL) tumour suppressor gene and allelic losses at chromosome arm 3p in primary renal cell carcinoma: evidence for a VHL‐independent pathway in clear cell renal tumourigenesis. Genes Chromosom Cancer 1998; 22: 200–9. [DOI] [PubMed] [Google Scholar]
- 7. Hamano K, Esumi M, Igarashi H et al Biallelic inactivation of the von Hippel‐Lindau tumor suppressor gene in sporadic renal cell carcinoma. J Urol 2002; 167: 713–7. [DOI] [PubMed] [Google Scholar]
- 8. Sjolund J, Johansson M, Manna S et al Suppression of renal cell carcinoma growth by inhibition of Notch signaling in vitro and in vivo . J Clin Invest 2008; 118: 217–28. [DOI] [PMC free article] [PubMed] [Google Scholar]
- 9. Leong KG, Karsan A. Recent insights into the role of Notch signaling in tumorigenesis. Blood 2006; 107: 2223–33. [DOI] [PubMed] [Google Scholar]
- 10. Artavanis‐Tsakonas S, Rand MD, Lake RJ. Notch signaling: cell fate control and signal integration in development. Science 1999; 284: 770–6. [DOI] [PubMed] [Google Scholar]
- 11. Iso T, Kedes L, Hamamori Y. HES and HERP families: multiple effectors of the Notch signaling pathway. J Cell Physiol 2003; 194: 237–55. [DOI] [PubMed] [Google Scholar]
- 12. Sourbier C, Lindner V, Lang H et al The phosphoinositide 3‐kinase/Akt pathway: a new target in human renal cell carcinoma therapy. Cancer Res 2006; 66: 5130–42. [DOI] [PubMed] [Google Scholar]
- 13. Wu K, Xu L, Zhang L, Lin Z, Hou J. High Jagged1 expression predicts poor outcome in clear cell renal cell carcinoma. Jpn J Clin Oncol 2011; 41: 411–6. [DOI] [PubMed] [Google Scholar]
- 14. Sourbier C, Danilin S, Lindner V et al Targeting the nuclear factor‐kappaB rescue pathway has promising future in human renal cell carcinoma therapy. Cancer Res 2007; 67: 11. [DOI] [PubMed] [Google Scholar]
- 15. Huang D, Ding Y, Luo WM et al Inhibition of MAPK kinase signaling pathways suppressed renal cell carcinoma growth and angiogenesis in vivo . Cancer Res 2008; 68: 81–8. [DOI] [PubMed] [Google Scholar]
- 16. Liu ZJ, Xiao M, Balint K et al Notch1 signaling promotes primary melanoma progression by activating mitogen‐activated protein kinase/phosphatidylinositol 3‐kinase‐Akt pathways and up‐regulating N‐cadherin expression. Cancer Res 2006; 66: 4182–90. [DOI] [PubMed] [Google Scholar]
- 17. Meurette O, Stylianou S, Rock R, Collu GM, Gilmore AP, Brennan K. Notch activation induces Akt signaling via an autocrine loop to prevent apoptosis in breast epithelial cells. Cancer Res 2009; 69: 5015–22. [DOI] [PubMed] [Google Scholar]
- 18. Park JY, Lin PY, Weiss RH. Targeting the PI3K‐Akt pathway in kidney cancer. Expert Rev Anticancer Ther 2007; 7: 863–70. [DOI] [PubMed] [Google Scholar]
- 19. Hanahan D, Weinberg RA. The hallmarks of cancer. Cell 2000; 100: 57–70. [DOI] [PubMed] [Google Scholar]
- 20. Nicholson KM, Anderson NG. The protein kinase B/Akt signalling pathway in human malignancy. Cell Signal 2002; 14: 381–95. [DOI] [PubMed] [Google Scholar]
- 21. Hanada M, Feng J, Hemmings BA. Structure, regulation and function of PKB/AKT–a major therapeutic target. Biochim Biophys Acta 2004; 1697: 3–16. [DOI] [PubMed] [Google Scholar]
- 22. Horiguchi A, Oya M, Uchida A, Marumo K, Murai M. Elevated Akt activation and its impact on clinicopathological features of renal cell carcinoma. J Urol 2003; 169: 710–3. [DOI] [PubMed] [Google Scholar]
- 23. Palomero T, Sulis ML, Cortina M et al Mutational loss of PTEN induces resistance to NOTCH1 inhibition in T‐cell leukemia. Nat Med 2007; 13: 1203–10. [DOI] [PMC free article] [PubMed] [Google Scholar]
- 24. Androutsellis‐Theotokis A, Leker RR, Soldner F et al Notch signalling regulates stem cell numbers in vitro and in vivo . Nature 2006; 442: 823–6. [DOI] [PubMed] [Google Scholar]
- 25. Gutierrez A, Look AT. NOTCH and PI3K‐AKT pathways intertwined. Cancer Cell 2007; 12: 411–3. [DOI] [PubMed] [Google Scholar]
- 26. Bedogni B, Warneke JA, Nickoloff BJ, Giaccia AJ, Powell MB. Notch1 is an effector of Akt and hypoxia in melanoma development. J Clin Invest 2008; 118: 3660–70. [DOI] [PMC free article] [PubMed] [Google Scholar]
- 27. Ma J, Meng Y, Kwiatkowski DJ et al Mammalian target of rapamycin regulates murine and human cell differentiation through STAT3/p63/Jagged/Notch cascade. J Clin Invest 2010; 120: 103–14. [DOI] [PMC free article] [PubMed] [Google Scholar]