Abstract
Glioblastoma is a diffusely growing malignant brain tumor and among the most aggressive of all tumors. Wilms' tumor 1‐associating protein (WTAP) is a nuclear protein that has been associated with regulation of proliferation and apoptosis. Although its dynamic expression and physiological functions in vascular cells have been reported, those in other cells are largely unknown. Here, we show for the first time that WTAP is overexpressed in glioblastoma. Moreover we found that WTAP regulates migration and invasion of glioblatoma cells. Specific knockdown by siRNA or overexpression by cDNA regulated migration and invasion of cancer cells. In xenograft study, WTAP overexpression made cancer cells more tumorigenic. In the investigation for its underlying mechanism, we found that the activity of epidermal growth factor receptor can be regulated by WTAP. These results reveal a novel function of WTAP and suggest its clinical application.
Glioblastoma is a diffusely growing malignant brain tumor and among the most aggressive of all tumors.1, 2 The overall survival time for patients is 15 months although they were treated with the current standard chemoradiotherapy. Primary glioblastoma, which accounts for most glioblastomas, develops rapidly with a clinical history of only a few days or weeks. This poor prognosis of glioblastoma may be ascribed to its high aggressiveness and invasiveness. Active cell migration and diffuse invasion into the surrounding tissue ultimately lead to tumor recurrence and patients' death.3 Molecular mechanisms underlying glioblastoma migration and invasion have been poorly characterized. Identification of molecules crucial for glioblastoma invasion will help improve the prognosis of patients.
Wilms' tumor 1‐associating protein (WTAP) is a nuclear protein that associates with the Wilms' tumor 1 suppressor gene product, WT1.4 In addition to its association and interference with WT1,5, 6 its involvement in RNA splicing4, 7, 8, 9 and stabilization10 have been suggested. The importance of this protein is implied by knockout experiments. The WTAP‐null and heterozygous mice died at E6.5 and at E10.5, respectively.10, 11 Despite its ubiquitous expression, dynamic change in its expression has been described. When vascular smooth muscle cells shift from a synthetic, proliferative state to a nonproliferative and contractile state, its expression was substantially upregulated.6 Moreover, during the early period after an injury in rat carotid artery, the expression of WTAP is low; however, at the later period when smooth muscle cells stop to proliferate, its expression is significantly high.6
Roles and expression of WTAP have been mainly described in vascular cells. In the present study, we found for the first time that WTAP was overexpressed in glioblastoma. Moreover, we showed that WTAP regulates migration and invasion of glioblastoma cells by controlling epidermal growth factor (EGF) signaling.
Materials and Methods
Cell culture
Glioblastom cells (U87MG cells and GBM05 cells) were cultured in DMEM (High Glucose; Thermo Fisher Scientific, Logan, UT, USA), supplemented with 10% FBS (Thermo Scientific, Albany, North Shore City, New Zealand) and 100 U/mL penicillin/streptomycin (Thermo Scientific) at 37°C and 5% CO2 incubator.
siRNA and transfection
Wilms' tumor 1‐associating protein siRNA (Bioneer, Daejeon, Korea) and scrambled siRNA (SCR; Bioneer) were purchased. Cells were transfected with 100 nm of WTAP siRNA, or SCR siRNA with DharrmaFECT reagent (Dharrmacon, Lafayette, CO, USA) in accordance with the manufacturer's protocol. SCR siRNA was used as negative control. The sequences of WTAP siRNA duplex were as follows: 5′‐CAG AUC UUA ACU CUA AUG A‐3′, 5′‐CCU UGU AAU GCG ACU AGC A‐3′, and 5′‐GAG AUG CAA GAG UGU ACU A‐3′.
Proliferation assay
Cells were seeded into 96‐well plate at a density of 3 × 10³ per well allowed to attach for 24 h. Then, they were transfected with WTAP siRNA or SCR siRNA. Four days after transfection, 10 μL of water soluble tetrazolium salt (Ez‐Cytox reagent, Daeillab, Seoul, Korea) was added into each well and incubated at 37°C for 2 h. Cell viability was measured at 450 nm using an ELISA reader (TECAN, Mannedorf, Swizerland).
Boyden chamber assay
A modified Boyden chamber (Neuro Probe, Gaithersburg, MD, USA) migration assay was used. The 8.0 μm pore polycarbonate filter was coated with type‐I collagen (10 μL/mL). Two days after transfection with SCR or WTAP siRNA, Boyden chamber assays were performed. The detailed experimental procedure is described in Appendix S1.
Invasion assay
The pore size of 8.0 μm of PET track‐etched membranes were used. The upper surface was pre‐coated with 0.5 mg/mL of Matrigel (BD Biosciences, San Jose, CA, USA) and lower surface was pre‐coated with 0.5 mg/mL of fibronectin (Sigma‐Aldrich, St. Louis, MO, USA). Two days after transfection with WTAP or SCR siRNA, invasion assays were performed. The detailed experimental procedure is described in Appendix S1.
Western blotting
The primary antibodies against anti‐WTAP (1:5000, Sigma‐Aldrich), phospho‐EGFR (1:1000, Cell Signaling, Danvers, MA, USA), total EGFR (1:1000, Cell Signaling), phospho‐AKT (1:1000, Cell Signaling), and total AKT (1:1000, Cell Signaling) were used for western blotting. The detailed experimental procedure is described in Appendix S1.
Overexpression of WTAP in U87MG cells
pΔEGFP‐N1‐WTAP (variant 1, Origene, Rockville, MD, USA) was used to generate U87MG cells stably overexpressing WTAP (U87 + WTAP cells). Transfection was performed by using FuGENE HD transfection reagent (Roche Diagnostics GmbH, Mannheim, Germany) in accordance with the manufacturer's protocol. G418 (140 μg/mL) was included as a selection antibiotic.
Real‐time PCR
Patients' tissues for real time PCR were provided by the Chonnam National University Hwasun Hospital, a member of the National Biobank of Korea, which is supported by the Ministry of Health, Welfare and Family Affairs. All samples derived from the National Biobank of Korea were obtained with informed consent under institutional review board‐approved protocols. The detailed experimental procedure is described in Appendix S1.
Immunohistochemistry staining
Glioblastoma tissues for immunohistochemistry were obtained with informed consent from patients who underwent surgical resection at Pusan National University Hospital. The study was approved by the institutional review boards of the hospital. The following primary antibodies were used: anti‐WTAP (1:300, Sigma‐Aldrich), anti‐GFAP (Glial Fibrillary Acidic Protein) (1:200, Merck Chemicals, Nottingham, UK), and anti‐CD45 (1:50, BD Biosciences). The detailed experimental procedure is described in Appendix S1.
Xenograft assay
Cells (5 × 10⁶ cells, mixed with Matrigel) stably expressing WTAP or control vector, were injected subcutaneously into nude mice (n = 6). Hundred percentage of injected mice formed tumors. Tumor volumes were measured every week from week 3 to week 6 and calculated by the following formula: 0.5236 × L1 × (L2)2, where L1 is the long axis and L2 is the short axis of the tumor. Six weeks later, mice were killed. Procedures related to animal care were in accord with the guideline of the “Guideline for the Welfare of Animals in Experimental Neoplasia”. The Pusan National University Institutional Animal Care and Use Committee (PNUIACUC) approved the experimental procedures.
cDNA microarray
Total RNA was extracted from U87 + WTAP and U87 + Mock cells using RNeasy Mini kit (Qiagen, Valencia, CA, USA) in accordance with the manufacturer's protocol. Quantified RNA was then used for microarray analysis on Human HT‐12_v4_Bead chips (Illumina, San Diego, CA, USA). The rest of the experimental procedure is described in Appendix S1.
Data analysis
All data are presented as means ± SD. All experiments were repeated at least four times. The difference between the mean values of two groups was evaluated using the Student's t‐test (unpaired comparison). For comparison of more than three groups, we used one‐way anova test followed by Tukey's multiple comparison. A P‐value of <0.05 was considered statistically significant.
Results
WTAP is overexpressed in glioblastoma
To determine expression status of WTAP in glioblastoma, we performed immunohistochemistry using patients' tissues (n = 10). In contrast to low level of expression in normal brain tissues, high level of expression is observed in glioblastoma tissues (Fig. 1a). To confirm whether WTAP‐positive cells are glioblastoma cells, we stained serial sections for GFAP, which was known to be expressed in glioblastoma cells,12 and CD45, a marker for leukocytes. Most WTAP‐positive cells were GFAP‐positive, however CD45‐negative (Fig. 1a). To quantitate the expression of WTAP in glioblastoma tissues, real time PCR was performed using specific primers for WTAP. Many, but not all glioblastoma tissues overexpressed it compared to normal brain tissues (Fig. 1b).
Figure 1.
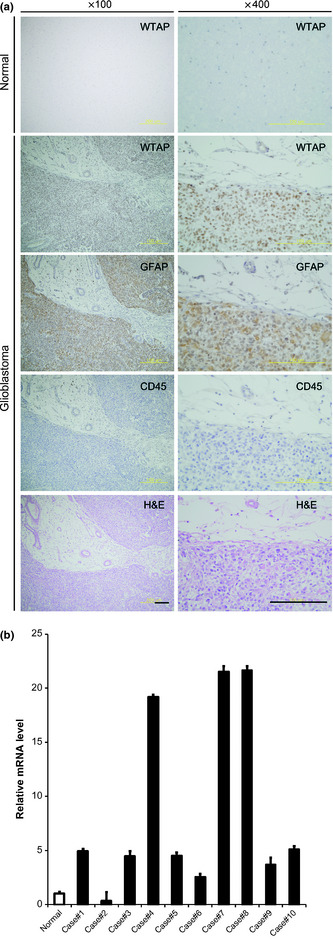
Wilms' tumor 1‐associating protein (WTAP) is overexpressed in glioblastoma. (a) Immunohistochemical staining showed over;]?>expression of WTAP in glioblatoma tissues (lower eight panels) compared to normal brain tissues (uppermost two panels). Magnified figures of left panels are displayed on the right. Note most WTAP‐positive cells were GFAP‐positive, however, CD45‐negative. Scale bar, 100 μm. (b) To quantitate the expression of WTAP in glioblastoma tissues, real time polymerase chain reactions were performed using specific primers for WTAP. Glyceraldehyde 3‐phosphate dehydrogenase was used to normalize all data. The bars represent mean ± SD of three independent experiments in each patient.
Role of WTAP in proliferation of glioblastoma cells
To examine roles of WTAP in glioblastoma, we knocked‐down or overexpressed WTAP using specific siRNA or cDNA, respectively. We checked the efficiency of the modulation by western blotting. WTAP siRNA (100 nm) decreased the protein level of WTAP in U87MG cells and in GBM05 cells compared to SCR RNA by 46.1% and 56.7%, respectively (Fig. 2a,b). The protein level of WTAP in the stable cells overexpressing WTAP is increased compared to mock cells by 79.4% (Fig. 2c,d). Subsequently, we examined roles of WTAP in proliferation of glioblastoma cells. Four days after transfection with SCR siRNA (100 nm) or WTAP siRNA (100 nm), cell survival assay was performed. As shown in Figure 2, WTAP knockdown did not affect proliferation in the presence of 10% FBS in the culture media. However, in the presence of 1% FBS, WTAP knockdown decreased proliferation of U87MG cells by 53.3% although it did not significantly affect proliferation of GBM05 cells (Fig. 2f). Overexpression of WTAP in U87MG cells increased the proliferation by 27.6% compared to control vector.
Figure 2.
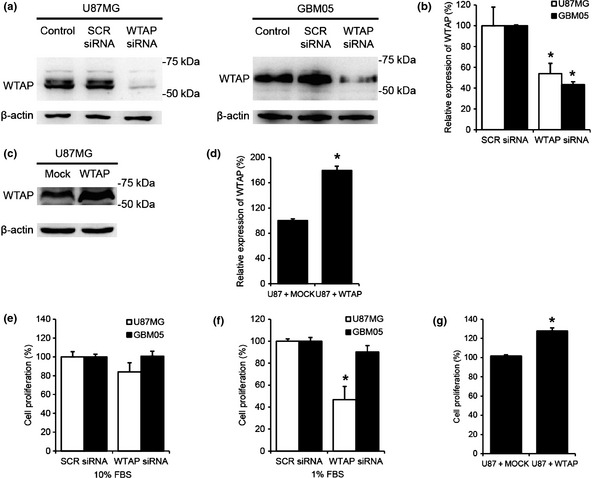
Role of Wilms' tumor 1‐associating protein (WTAP) in proliferation of glioblastoma cells. (a–d) The efficiency of knockdown and over;]?>expression of WTAP by specific siRNA and cDNA in glioblastoma cells was examined by western blotting. The protein level of WTAP was normalized to β‐actin level. Analysis of western blots by image analyzer (LAS 3000, Fujifilm, Japan) was performed. Values are expressed as the percentage of control, which was defined as 100% (n = 3, *P < 0.01, Student's t‐test). (e,f) After transfection with scrambled (SCR, 100 nm) or WTAP siRNA (100 nm), cells were cultured in the presence of 10% (e) or 1% (f) fetal bovine serum (FBS) for 4 days. (g) After stable expression of WTAP cDNA or empty vector, we cultured the stable cells for 4 days after seeding at a density of 3 × 10³ cells per well. WST‐1 assay was performed to examine cell proliferation. The bars represent mean ± SD of combined results from n = 5 independent experiments performed in quintuple (*P < 0.01, Student's t‐test).
WTAP regulates migration of glioblastoma cells
To determine the role of WTAP in migration of glioblastoma cells, we carried out studies using a Boyden chamber assay. Two days after siRNA transfection, Boyden chamber assays were performed as described in the Materials and Methods section. To remove effects of proliferation, mitomycin C (0.01 μg/mL, Sigma) was added. As shown in Figure 3, WTAP siRNA (100 nm) reduced FBS‐ and EGF‐induced migration of U87MG cells compared to SCR siRNA by 50.5% and 79.2%, respectively (Fig. 3a,b). Moreover, WTAP siRNA (100 nm) reduced FBS‐ and EGF‐induced migration of GBM05 cells compared to SCR RNA by 40.7% and 91.2%, respectively (Fig. 3c). Furthermore, overexpression of WTAP in U87MG cells increased FBS‐induced migration compared to control vector by 159.8% (Fig. 3d,e). These results suggest critical roles of WTAP in migration of glioblastoma cells.
Figure 3.
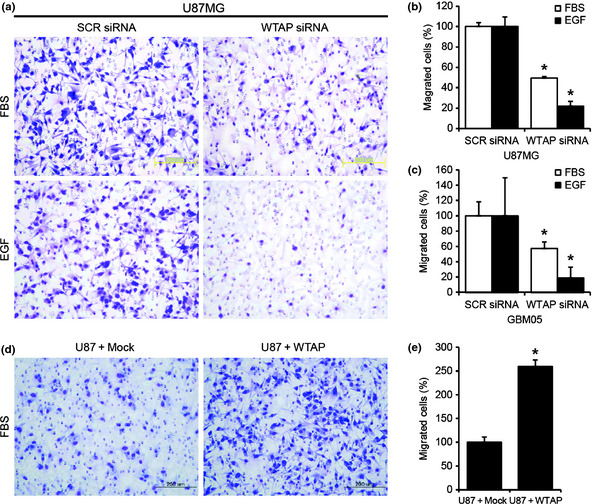
Wilms' tumor 1‐associating protein (WTAP) regulates migration of gliomablastoma cells. Boyden chamber assay was used to measure migration of cancer cells. Epidermal growth factor (EGF) (100 ng/mL) or 10% serum was used to induce chemotaxis. (a–c) Boyden chamber assay was performed 2 days after transfection. Knockdown of WTAP significantly inhibited serum‐ or EGF‐induced migration compared to scrambled (SCR) siRNA (100 nm) in U87MG (a,b) and GBM05 cells (c). Overexpression of WTAP significantly increased migration compared to the control vector (d,e). Representative stainings of migrated cells were presented (a,d). Migrated cells were counted and the data are presented as graphs (b,c,e). Data are the means ± SD of three independent experiments in triplicate (*P < 0.01, Student's t‐test).
WTAP regulates invasion of glioblastoma cells
Next, we examined the role of WTAP in invasion of glioblastoma cells using a Matrigel invasion assay. Two days after siRNA transfection, Matrigel invasion assays were carried out as described in the Materials and Methods section. To remove the effects of proliferation, mitomycin C (0.01 μg/mL, Sigma) was added. As shown in Figure 4, WTAP siRNA (100 nm) reduced FBS‐ and EGF‐induced invasion of U87MG cells compared to SCR siRNA by 60.4% and 47.6%, respectively. Moreover, WTAP siRNA (100 nm) reduced FBS‐induced invasion of GBM05 cells compared to SCR RNA by 29.3% (Fig. 4c). Furthermore, overexpression of WTAP in U87MG cells increased FBS‐induced invasion compared to control vector by 153.6% (Fig. 4d,e). These results suggest critical roles of WTAP in invasion of glioblastoma cells.
Figure 4.
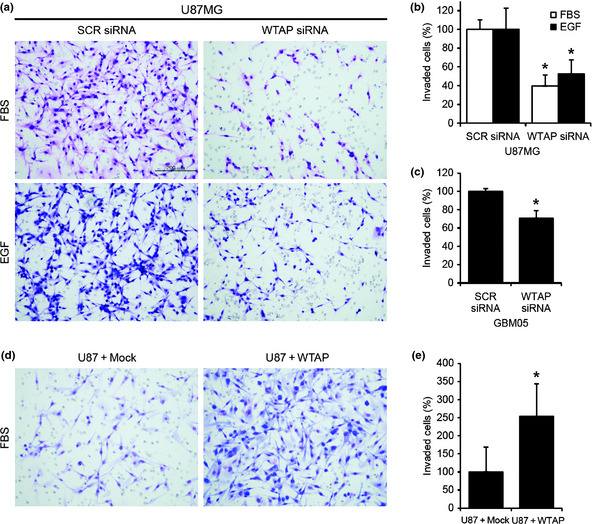
Wilms' tumor 1‐associating protein (WTAP) regulates invasion of glioblastoma cells. Matrigel invasion assay was used to measure invasion of cancer cells. Epidermal growth factor (EGF) (100 ng/mL, a,b) or 10% serum (a–e) was used to induce chemotaxis. (a–c) Two days after transfection with 100 nm scrambled (SCR) siRNA or 100 nm WTAP siRNA, an invasion assay was performed. Knockdown of WTAP significantly inhibited serum‐ or EGF‐induced invasion compared to SCR siRNA in U87MG (a,b) and GBM05 cells (c). Overexpression of WTAP significantly increased invasion compared to the control vector (d,e). Representative stainings of invaded cells were presented (a,d). Invaded cells were counted and the data are presented as graphs (b,d). Data are the means ± SD of three independent experiments in triplicate (*P < 0.01, Student's t‐test).
WTAP increases tumorigenicity of glioblastoma cells in xenograft
Next, we examined the effects of WTAP overexpression on in vivo behavior of glioblastoma cells. Glioblastoma cells overexpressing WTAP or control vector were subcutaneously injected into nude mice and tumor growth was measured. Notably, the growth rate of xenograft was significantly faster in WTAP overexpression group compared to control group (Fig. 5).
Figure 5.
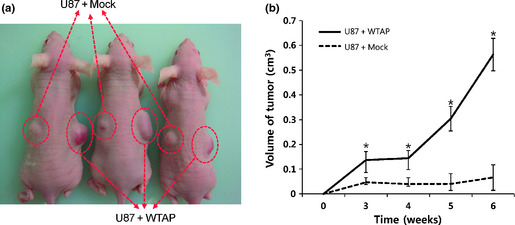
Wilms' tumor 1‐associating protein (WTAP) increases tumorigenicity of glioblastoma cells. U87MG cells (5 × 10⁶ cells) overexpressing WTAP or control vector, were injected into the nude mice (n = 6) subcutaneously (a). The tumor mass (xenograft) volume was measured every week from week 3 to week 6. Data are expressed as the means ± SD (b, *P < 0.01 vs. scrambled [SCR] siRNA, one‐way analysis of variance [anova] followed by Tukey's multiple comparison).
WTAP regulates activity of EGFR
How does WTAP regulate migration and invasion of glioblastoma cells? To reveal the underlying mechanism, we examined the activity of epidermal growth factor receptor (EGFR) because roles of EGF signaling are well established in migration and invasion of cancer cells. One day after transfection with SCR or WTAP siRNA (100 nm), cells were subjected to serum starvation for one day. Treatment with EGF (100 ng/mL) for 10 min significantly increased the level of phospho‐EGFR (Fig. 6) in control cells. However, WTAP siRNA inhibited the EGF‐induced phosphorylation of EGFR compared to SCR siRNA in U87MG or GBM05 cells by 43.4% or 24.0%, respectively, (Fig. 6). Moreover, overexpression of WTAP enhanced the EGF‐induced phosphorylation of EGFR compared to control vector by 29.7%. Total amount of EGFR was not significantly changed by WTAP knockdown or overexpression. Because EGFR can enhance the activity of AKT, which plays important roles in migration of cancer cells,13 we examined the phosphorylation status of AKT. The phosphorylation of AKT was also regulated by WTAP in a similar pattern with that of EGFR (Fig. 6).
Figure 6.
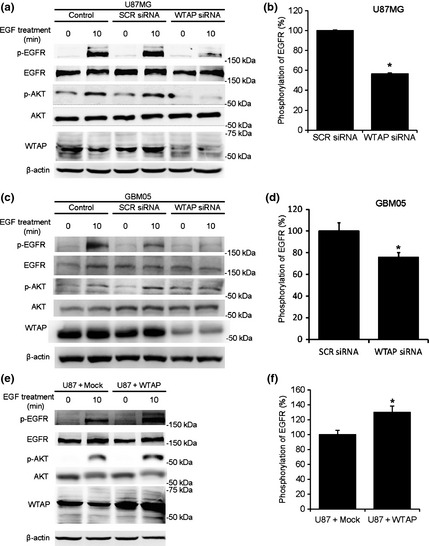
Wilms' tumor 1‐associating protein (WTAP) regulates activity of epidermal growth factor receptor (EGFR). (a–d) One day after transfection with 100 nm scrambled (SCR) siRNA or 100 nm WTAP siRNA, U87MG (a,b) or GBM05 (c,d) cells were incubated in serum‐free media. One day after the serum starvation, cells were treated with EGF (100 ng/mL) for 10 min. (e,f) The WTAP‐overexpressed cells or mock cells were cultured in serum‐free media for 24 h and treated with EGF (100 ng/mL) for 10 min. The protein levels of phosphorylated EGFR, total EGFR, phosphorylated AKT, total AKT and WTAP in the cells were quantified by western blotting and normalized to β‐actin level. Analysis of western blots by image analyzer (LAS 3000, Fujifilm, Japan) was performed. Values are expressed as the percentage of control, which was defined as 100% (n = 6, *P < 0.01, Student's t‐test).
WTAP‐induced changes in mRNA expression
To reveal other possible mechanisms of WTAP‐regulated motility, we performed a cDNA microarray. Expressions of many genes that are involved in migration of cancer cells were changed by the overexpression of WTAP (Table 1). Among the significantly changed genes by WTAP, we focused on chemokine ligand 2 (CCL2), chemokine ligand 3 (CCL3), hyaluronan synthase 1 (HAS1), lysyl oxidase‐like 1 (LOXL1), matrix metallopeptidase 3 (MMP3), and thrombospondin 1 (THBS1) because these genes have been significantly associated with motility of cancer cells. Real‐time PCR was used to confirm significant changes in mRNA levels of each gene (Fig. 7). Overexpression or knockdown of WTAP increased or decreased the mRNA levels of these genes, respectively (Fig. 7).
Table 1.
Wilms' tumor 1‐associating protein (WTAP)‐induced change in gene expression
| Up | Down | ||
|---|---|---|---|
| Target ID | FC | Target ID | FC |
| BGLAP | 5.05 | SMEK2 | 0.49 |
| CCL2 | 4.81 | CDH15 | 0.48 |
| MMP3 | 4.05 | P4HA1 | 0.47 |
| BAMBI | 3.94 | GHR | 0.47 |
| MGP | 3.72 | STC1 | 0.46 |
| CCL26 | 3.03 | IGFBP1 | 0.45 |
| ASAP3 | 2.9 | MGLL | 0.42 |
| CHI3L1 | 2.75 | CGB1 | 0.41 |
| STMN3 | 2.57 | EGR2 | 0.41 |
| PDGFRB | 2.39 | PPF1A4 | 0.38 |
| TGM2 | 2.37 | KRT34 | 0.38 |
| HAS1 | 2.23 | TNS1 | 0.37 |
| S100A4 | 2.21 | ENO2 | 0.36 |
| LOXL1 | 2.2 | CSRP2 | 0.31 |
| CCL3 | 2.17 | LTBR | 0.29 |
| TCF4 | 2.16 | IGFBP3 | 0.16 |
| THBS1 | 2.14 | AK3L1 | 0.11 |
FC, fold change.
Figure 7.
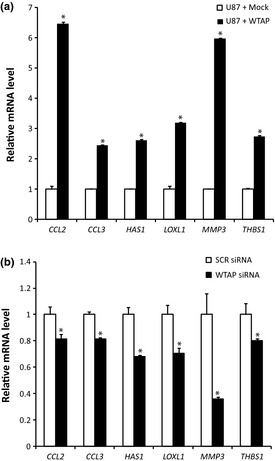
Wilms' tumor 1‐associating protein (WTAP)‐induced gene expression. Gene expression between glioblastoma cells overexpressing WTAP gene or control vectors were compared by cDNA microarray. After the expression of WTAP were modulated by cDNA (a) or siRNA (b) in U87MG cells, real‐time polymerase chain reaction (PCR) was performed to confirm the WTAP‐induced change in gene expression of CCL2, CCL3, HAS1, LOXL1, MMP3, and THBS1. Glyceraldehyde 3‐phosphate dehydrogenase (GAPDH) was used to normalize all data. The bars represent mean ± SD of three independent experiments.
Discussion
Migration and invasion of cancer cells greatly affect prognosis of glioblastoma patients. So, understanding the molecular mechanism underlying motility of glioblastoma cancer cells can contribute to development of new diagnostics and therapeutics. In the present study, we showed for the first time that WTAP is overexpressed in glioblatoma and regulate motility of glioblastoma cells. Moreover, we also showed that the regulation of motility by WTAP is mediated by controlling the activity of EGFR.
A novel role of WTAP in regulation of migration and invasion of glioblastoma cells was demonstrated for the first time in the present study. Previous studies have shown main roles of WTAP in cell biology were regulation of proliferation and apoptosis.6, 10, 14 Boyden chamber chemotaxis assay and Matrigel invasion assay in the present study showed that knockdown or overexpression of WTAP decreased or increased migration and invasion of glioblastoma cells, respectively.
How can WTAP regulate migration and invasion of cancer cells in glioblastoma? In the present study, we found that WTAP can regulate the activity of EGFR. Accordingly, the activity of AKT was also regulated by WTAP in a similar pattern. However the activity of EGFR was only partially regulated by WTAP siRNA, suggesting that the activity of EGFR plays a minor role in WTAP‐regulated migration. Epidermal growth factor receptor can be regulated at several levels: expression, degradation and activity. Overexpression of EGFR occurs in 40–60% of primary glioblastoma by chromosomal amplification.15, 16, 17, 18 Degradation of EGFR can be regulated by cbl protein, whose overexpression promoted ubiquitination and degradation of EGFR.19 However, in the present study, expressions of ErbB family members were not significantly changed by overexpression or knockdown of WTAP (data not shown). Activity of EGFR can be regulated by modulator proteins including herstatin,20 mitogen‐inducible gene 6 (Mig‐6) and fibroblast growth factor receptor substrate 2 β (FRS2β)21 without change in the amount of EGFR protein. In future studies, how the activity of EGFR is regulated by WTAP needs to be further studied.
Although the activity of EGFR was inhibited by WTAP siRNA, the inhibition was not complete (Fig. 6b,d,f). Through the cDNA microarray experiments, we found several candidate genes (CCL2, CCL3, HAS1, LOXL1, MMP3, THBS1) that may mediate effects of WTAP (Table 1, Fig. 7). Expressions of those genes were increased or decreased by cDNA overexpression or siRNA knockdown of WTAP, respectively (Fig. 7). Chemokines including CCL2 and CCL3 have been shown to promote migration of cancer cells22, 23 although they have been originally reported to be involved in migration of leukocytes. Interestingly a role of CCL2‐chemokine receptor 2 (CCR2) interaction was suggested in glioblastastoma.24 Extracellular matrix components and related proteins are critical for migration and invasion of cancer cells. LOXL, which oxidizes lysine residues in collagens and elastin, can promote metastasis through active remodeling of tumor microenvironment.25 Hyaluronic acid family proteins including HAS1 have been shown to regulate metastasis.26 In glioma cells, hyaluronic acid affected their migration.27 Thrombospondin 1 is a multifunctional matrix protein implicated in migration of cancer cells.28 Malignant glioma cells can secrete THBS1, which regulates their motility.29
Wilms' tumor 1‐associating protein played some minor roles in proliferation of U87MG glioblastoma cells in the present study. In the presence of 1% FBS, knockdown of WTAP decreased proliferation of U87MG cells. However, in the presence of 10% FBS, we did not observe the significant decrease in proliferation (Fig. 2). Moreover, knockdown of WTAP did not affect proliferation of GBM05 cells (Fig. 2). Less inhibition of EGFR activity by WTAP siRNA in GBM05 than U87MG cells (Fig. 6) may explain the difference in effects of WTAP on proliferation. However, the inhibition of EGFR activity by WTAP is not complete. So, it is difficult to explain different effects of WTAP on proliferation simply using the effects on EGFR activity. Therefore, other mechanisms may be involved in regulation of proliferation by WTAP. The previous studies suggested the association of WTAP with cell proliferation by its expression pattern.6 However its roles in cell proliferation are controversial depending on cell type. In the vascular smooth muscle cell, WTAP negatively regulates proliferation. Knockdown of its expression by RNA interference increased DNA synthesis and proliferation.6 In contrast, its overexpression showed opposite effects. However, in endothelial cells, overexpression of WTAP did not change cell proliferation. Moreover, its knockdown decreased cell proliferation.10 These results suggest that the role of WTAP in proliferation might be cell‐type specific.
Overexpression of WTAP in glioblatoma was found for the first time in the present study. Although an early study showed that WTAP is widely expressed in adult tissues including brain, thymus, heart, lung, liver, spleen and skeletal muscle,4 its dynamic change in expression was reported in vascular smooth muscle cells.6 In the present study, we observed the basal expression of WTAP in normal human brain tissues. However, overexpression of WTAP was clearly observed in glioblastoma tissues. In future study, how the expression of WTAP in glioblastoma tissues is regulated needs to be studied. Moreover, its relationship with patients' prognosis needs to be investigated.
Disclosure Statement
The authors have no conflicts of interest.
Supporting information
Appendix S1. Experimental procedure.
Acknowledgments
This work was supported by Medical Research Institute Grant (2009‐23), Pusan National University Hospital, the medical research centre program of Ministry of Education, Science and Technology/Korea Science and Engineering Foundation (2011‐0006190), a grant from the National R&D Program for Cancer Control, Ministry for Health, Welfare and Family Affairs, Republic of Korea (0920050). The funders had no role in study design, data collection and analysis, decision to publish, or preparation of the manuscript.
(Cancer Sci 2012; 103: 2102–2109)
References
- 1. Preusser M, de Ribaupierre S, Wohrer A et al Current concepts and management of glioblastoma. Ann Neurol 2011; 70: 9–21. [DOI] [PubMed] [Google Scholar]
- 2. Louis DN, Ohgaki H, Wiestler OD et al The 2007 WHO classification of tumours of the central nervous system. Acta Neuropathol 2007; 114: 97–109. [DOI] [PMC free article] [PubMed] [Google Scholar]
- 3. Xia M, Hu M, Wang J et al Identification of the role of Smad interacting protein 1 (SIP1) in glioma. J Neurooncol 2010; 97: 225–32. [DOI] [PubMed] [Google Scholar]
- 4. Little NA, Hastie ND, Davies RC. Identification of WTAP, a novel Wilms' tumour 1‐associating protein. Hum Mol Genet 2000; 9: 2231–9. [DOI] [PubMed] [Google Scholar]
- 5. Lee SB, Huang K, Palmer R et al The Wilms tumor suppressor WT1 encodes a transcriptional activator of amphiregulin. Cell 1999; 98: 663–73. [DOI] [PubMed] [Google Scholar]
- 6. Small TW, Bolender Z, Bueno C et al Wilms' tumor 1‐associating protein regulates the proliferation of vascular smooth muscle cells. Circ Res 2006; 99: 1338–46. [DOI] [PubMed] [Google Scholar]
- 7. Saitoh N, Spahr CS, Patterson SD, Bubulya P, Neuwald AF, Spector DL. Proteomic analysis of interchromatin granule clusters. Mol Biol Cell 2004; 15: 3876–90. [DOI] [PMC free article] [PubMed] [Google Scholar]
- 8. Zhou Z, Licklider LJ, Gygi SP, Reed R. Comprehensive proteomic analysis of the human spliceosome. Nature 2002; 419: 182–5. [DOI] [PubMed] [Google Scholar]
- 9. Ortega A, Niksic M, Bachi A et al Biochemical function of female‐lethal (2)D/Wilms' tumor suppressor‐1‐associated proteins in alternative pre‐mRNA splicing. J Biol Chem 2003; 278: 3040–7. [DOI] [PubMed] [Google Scholar]
- 10. Horiuchi K, Umetani M, Minami T et al Wilms' tumor 1‐associating protein regulates G2/M transition through stabilization of cyclin A2 mRNA. Proc Natl Acad Sci USA 2006; 103: 17278–83. [DOI] [PMC free article] [PubMed] [Google Scholar]
- 11. Naruse C, Fukusumi Y, Kakiuchi D, Asano M. A novel gene trapping for identifying genes expressed under the control of specific transcription factors. Biochem Biophys Res Commun 2007; 361: 109–15. [DOI] [PubMed] [Google Scholar]
- 12. Goswami C, Chatterjee U, Sen S, Chatterjee S, Sarkar S. Expression of cytokeratins in gliomas. Indian J Pathol Microbiol 2007; 50: 478–81. [PubMed] [Google Scholar]
- 13. Manning BD, Cantley LC. AKT/PKB signaling: navigating downstream. Cell 2007; 129: 1261–74. [DOI] [PMC free article] [PubMed] [Google Scholar]
- 14. Small TW, Pickering JG. Nuclear degradation of Wilms tumor 1‐associating protein and survivin splice variant switching underlie IGF‐1‐mediated survival. J Biol Chem 2009; 284: 24684–95. [DOI] [PMC free article] [PubMed] [Google Scholar]
- 15. Ohgaki H, Dessen P, Jourde B et al Genetic pathways to glioblastoma: a population‐based study. Cancer Res 2004; 64: 6892–9. [DOI] [PubMed] [Google Scholar]
- 16. Wong AJ, Bigner SH, Bigner DD, Kinzler KW, Hamilton SR, Vogelstein B. Increased expression of the epidermal growth factor receptor gene in malignant gliomas is invariably associated with gene amplification. Proc Natl Acad Sci USA 1987; 84: 6899–903. [DOI] [PMC free article] [PubMed] [Google Scholar]
- 17. Ekstrand AJ, Sugawa N, James CD, Collins VP. Amplified and rearranged epidermal growth factor receptor genes in human glioblastomas reveal deletions of sequences encoding portions of the N‐ and/or C‐terminal tails. Proc Natl Acad Sci USA 1992; 89: 4309–13. [DOI] [PMC free article] [PubMed] [Google Scholar]
- 18. Watanabe K, Tachibana O, Sata K, Yonekawa Y, Kleihues P, Ohgaki H. Overexpression of the EGF receptor and p53 mutations are mutually exclusive in the evolution of primary and secondary glioblastomas. Brain Pathol 1996; 6: 217–23. [DOI] [PubMed] [Google Scholar]
- 19. Levkowitz G, Waterman H, Ettenberg SA, et al Ubiquitin ligase activity and tyrosine phosphorylation underlie suppression of growth factor signaling by c‐Cbl/Sli‐1. Mol Cell 1999; 4: 1029–40. [DOI] [PubMed] [Google Scholar]
- 20. Azios NG, Romero FJ, Denton MC, Doherty JK, Clinton GM. Expression of herstatin, an autoinhibitor of HER‐2/neu, inhibits transactivation of HER‐3 by HER‐2 and blocks EGF activation of the EGF receptor. Oncogene 2001; 20: 5199–209. [DOI] [PubMed] [Google Scholar]
- 21. Gotoh N. Feedback inhibitors of the epidermal growth factor receptor signaling pathways. Int J Biochem Cell Biol 2009; 41: 511–5. [DOI] [PubMed] [Google Scholar]
- 22. Chiu HY, Sun KH, Chen SY et al Autocrine CCL2 promotes cell migration and invasion via PKC activation and tyrosine phosphorylation of paxillin in bladder cancer cells. Cytokine 2012; 59: 423–32. [DOI] [PubMed] [Google Scholar]
- 23. Akashi T, Koizumi K, Nagakawa O, Fuse H, Saiki I. Androgen receptor negatively influences the expression of chemokine receptors (CXCR4, CCR1) and ligand‐mediated migration in prostate cancer DU‐145. Oncol Rep 2006; 16: 831–6. [PubMed] [Google Scholar]
- 24. Liang Y, Bollen AW, Gupta N. CC chemokine receptor‐2A is frequently overexpressed in glioblastoma. J Neurooncol 2008; 86: 153–63. [DOI] [PubMed] [Google Scholar]
- 25. Xiao Q, Ge G. Lysyl oxidase, extracellular matrix remodeling and cancer metastasis. Cancer Microenviron 2012; 5: 261–73. [DOI] [PMC free article] [PubMed] [Google Scholar]
- 26. Kramer MW, Escudero DO, Lokeshwar SD et al Association of hyaluronic acid family members (HAS1, HAS2, and HYAL‐1) with bladder cancer diagnosis and prognosis. Cancer 2011; 117: 1197–209. [DOI] [PMC free article] [PubMed] [Google Scholar]
- 27. Chintala SK, Gokaslan ZL, Go Y, Sawaya R, Nicolson GL, Rao JS. Role of extracellular matrix proteins in regulation of human glioma cell invasion in vitro . Clin Exp Metastasis 1996; 14: 358–66. [DOI] [PubMed] [Google Scholar]
- 28. Roberts DD. Regulation of tumor growth and metastasis by thrombospondin‐1. FASEB J 1996; 10: 1183–91. [PubMed] [Google Scholar]
- 29. Amagasaki K, Sasaki A, Kato G, Maeda S, Nukui H, Naganuma H. Antisense‐mediated reduction in thrombospondin‐1 expression reduces cell motility in malignant glioma cells. Int J Cancer 2001; 94: 508–12. [DOI] [PubMed] [Google Scholar]
Associated Data
This section collects any data citations, data availability statements, or supplementary materials included in this article.
Supplementary Materials
Appendix S1. Experimental procedure.


