

Abstract
The invasion process is a crucial step for pancreatic ductal adenocarcinoma (PDAC); however, the genes related to invasion remain unclear. To identify specific genes for the invasion process, we compared microarray data for infiltrating cancer and PanIN‐3, which were harvested from an individual PDAC patient by microdissection. Furthermore, immunohistochemical, coimmunoprecipitation and invasion analyses were performed to confirm the biologic significance of molecules identified by expression profile. In the present study, we focused on MUC16 and mesothelin among 87 genes that were significantly upregulated in infiltrating components compared to PanIN‐3 in all PDAC patients, because MUC16 was the most differently expressed between two regions, and mesothelin was reported as the receptor for MUC16. Immunohistochemical analysis revealed that MUC16 and mesothelin were expressed simultaneously only in infiltrating components and increased at the invasion front, and binding of MUC16 and mesothelin was found in PDAC by immunoprecipitation assay. The downregulation of MUC16 by shRNA and the blockage of MUC16 binding to mesothelin by antibody inhibited both invasion and migration of pancreatic cancer cell line. MUC16 high/mesothelin high expression was an independent prognostic factor for poor survival in PDAC patients. In conclusion, we identified two specific genes, MUC16 and mesothelin, associated with the invasion process in patients with PDAC. (Cancer Sci 2012; 103: 739–746)
For most patients with pancreatic ductal adenocarcinoma (PDAC), the diagnosis is made at an advanced stage;1 the survival rate for these patients is dismal because PDAC has a propensity for early local invasion and vascular dissemination.2 The genetic and biochemical determinants of the process of invasion and metastasis in PDAC are still largely unknown.
Pancreatic ductal adenocarcinoma appears to arise from histologically well‐defined precursor lesions in the ducts of the pancreas, called pancreatic intraepithelial neoplasms (PanIN).3, 4 PanIN are graded based on their degree of architectural and nuclear atypia and are categorized into a four‐tier classification, including PanIN‐1A, 1B, 2 and 3.5 PanIN‐3 lesions demonstrate widespread loss of nuclear polarity, nuclear atypia and frequent mitoses, and whereas cancerous cells break through the basement membrane, they evolve into infiltrating adenocarcinoma. The invasion process is the crucial step in PDAC because cancer cells that invade the vasculature, or lymphatic or neural vessels, can progress further to metastasis only after obtaining infiltrating status. In the present study, we identified specific molecular markers associated with invasion in PDAC, which might be useful not only as early diagnostic markers but also as new therapeutic targets for patients with PDAC.
Several molecular markers, including tissue plasminogen activator,6 artemin7 and RhoGDI2,8 have been reported to be associated with invasion in PDAC. However, some of these molecular markers are of little clinical value as therapeutic targets for patients with PDAC because these genes are also expressed in normal pancreatic tissues or other normal organs.6, 7, 8 In this study, we first used a gene expression profiling technique to identify the specific genes that are differentially expressed between infiltrating cancer cells and PanIN‐3 cells, which were harvested from an individual patient by laser microdissection. Based on our gene expression array data, clinical and biologic implications of MUC16 and mesothelin expression were further explored.
Material and Methods
Patients.
Our study population included 103 patients with PDAC who underwent curative resection between January 2004 and December 2007 at Wakayama Medical University Hospital (WMUH). Informed consent was obtained from all patients in accordance with the guidelines of the Ethical Committee on Human Research of WMUH. Patient characteristics are presented in Table 1. The TNM staging criteria of the International Union Against Cancer was used for histologic classification.9 None of the patients had received neoadjuvant chemotherapy or radiation therapy before surgery. The median follow‐up duration after resection was 16.8 months (range: 1.6–67.3 months).
Table 1.
Patient characteristics (n = 103)
| Age, median (range) | 69 (31–87) |
| Gender, male/female | 54/49 |
| Tumor site, Ph/Pbt/Phbt | 71/30/2 |
| Surgical technique, PD/DP/TP | 71/30/2 |
| Differentiation, well/moderate/poor | 42/51/10 |
| Tumor size | |
| ≤20mm | 18 |
| >20 but ≤40mm | 69 |
| >40 but ≤60mm | 14 |
| >60mm | 2 |
| UICC stage | 3 |
| IA | 3 |
| IB | 5 |
| IIA | 24 |
| IIB | 63 |
| III | 1 |
| IV | 7 |
| Postoperative recurrence, yes/no | 79/24 |
DP, distal pancreatectomy; Pbt, pancreatic body and tail; PD, pancreatoduodenectomy; Ph, pancreatic head; TP, total pancreatectomy; UICC, Union for International Cancer Control.
Laser microdissection and RNA extraction.
Tissue samples including cancer cells and adjacent normal cells were embedded in Tissue‐Tek OCT compound (Sakura Finetek, Torrance, CA, USA) by freezing tissue blocks in liquid nitrogen immediately after surgical resection for expression profiling. We used the tissues obtained from five patients with PDAC who had coexisting infiltrating cancer cells and PanIN‐3 cells, and used the tissues from three patients as controls, including two patients with pancreatitis and one patient with bile duct cancer.
The specimens were cut into 9‐μm sections at −20°C with the use of a LEICA cryostat (model 3050S; Leica, Tokyo, Japan) and then fixed on slides in 70% ethanol and stained with hematoxylin. The infiltrating cancer cells and PanIN‐3 cells were harvested separately from an individual PDAC tissue using laser microdissection. As a control, the normal pancreatic duct cells were also obtained by laser microdissection, because PDAC originates from pancreatic ductal epithelial cells. Before laser microdissection, two pathologists (YS and YN) diagnosed infiltrating cancer regions and PanIN‐3 regions in the PDAC tissues, and normal pancreatic epithelium in normal pancreatic tissues. We estimated that the proportion of infiltrating cancer cells, PanIN‐3 cells, or normal pancreatic ductal cells in the laser microdissected purified samples was at least 95%. Hence, we required more than 30 specimens (range, 35–78 specimens) in each sample for infiltrating cancer cells, more than 110 specimens (range, 111–414 specimens) for PanIN‐3 cells and more than 450 specimens (range, 450–520 specimens) for normal pancreatic ductal epithelium cells to obtain enough RNA volume to use for our expression analysis. Total RNA was extracted from the harvested cells using the RNeasy Micro Kit (Qiagen, Hilden, Germany). The concentration of each total RNA sample was measured with a Nanodrop ND‐1000 spectrophotometer (Nanodrop Technologies, Wilmington, DE, USA). The integrity of the RNA was determined by capillary electrophoresis using an Agilent 2100 Bioanalyzer (Agilent, Santa Clara, CA, USA) and the extracted RNA was accepted for experiments if the RNA integrity reading was >7.0.
Genome‐wide transcriptional profiling.
The gene expression was analyzed with Human Genome U133 Plus 2.0 GeneChips (Affymetrix, Santa Clara, CA, USA). The manufacturer's instructions regarding the protocols and the use of reagents for hybridization, washing and staining were followed (as previously described).10 Data were collected using an Affymetrix GeneChip Scanner 3000 instrument. The cell intensity data files were obtained using the Affymetrix Suite 5.0 software program; then, the array data were imported into a DNA‐Chip Analyzer (dChip, http://www.dchip.org) for high‐level analysis.
Immunohistochemistry.
Pretreatment was performed in a microwave using citrate buffer (pH 6.0) for 5 × 3 min at 700 W. Endogenous peroxidase activity was blocked with 3% hydrogen peroxide in methanol, and nonspecific binding sites were blocked with 10% normal goat serum. Primary antibodies were diluted in PBS: MUC16 (1:1000, mouse monoclonal, X325, Abcam, Cambridge, UK) and mesothelin (1:20, mouse monoclonal, 5B2, Novacastra, Newcastle upon Tyne, UK). Diluted primary antibodies were added, and samples were incubated overnight at 4°C. Antibody binding was then immunodetected using the avidin–biotin–peroxidase complex, as described by the supplier (Nichirei, Tokyo, Japan). Finally, the reaction products were demonstrated using a DAB substrate, and then counterstained with hematoxylin, dehydrated with ethanol and fixed with xylene.
To investigate the localization of the MUC16 and mesothelin, fluorescence immunohistochemistry was performed for paraffin‐embedded tissue slides. Double labeling of the two mouse monoclonal antibodies (MUC16 [X325] and mesothelin [5B2]) was done using a Zenon kit (Molecular Probes, Eugene, OR, USA) to directly label the antibodies with either Alexa Fluor 488 or 594 according to the manufacturer's instructions.
Evaluation of immunohistochemistry.
For scoring assessment, 200 cells were counted in each of the five different fields with high magnification, ×400, on the maximum cut surface of the tumor. We used ovarian cancer tissue and mesothelioma tissue as positive controls for MUC16 and mesothelin expression, respectively. The staining intensity was defined as follows: 0, no staining; 1+, weak; 2+, moderate; 3+, strong, based on the intensity levels of positive control being taken as 3+ (Fig. 1A).11, 12, 13 If there were areas with a variety of staining intensities, the predominant intensity was chosen. The quantification of positivity (0–100%) was based on an estimate of the percentage of stained cancer cells in the lesion. The final immunostaining scores were calculated by multiplying the staining intensity and percentage positivity, thereby giving immunostaining scores ranging from 0 to 300.14, 15, 16, 17 The cut‐off values of immunostaining scores were set as the median value, in accordance with previous reports.18, 19 The immunostains were scored by three investigators (SH, YN and HY) blinded to the clinical and pathologic data. If differences of opinion arose, a consensus was achieved by discussion.
Figure 1.
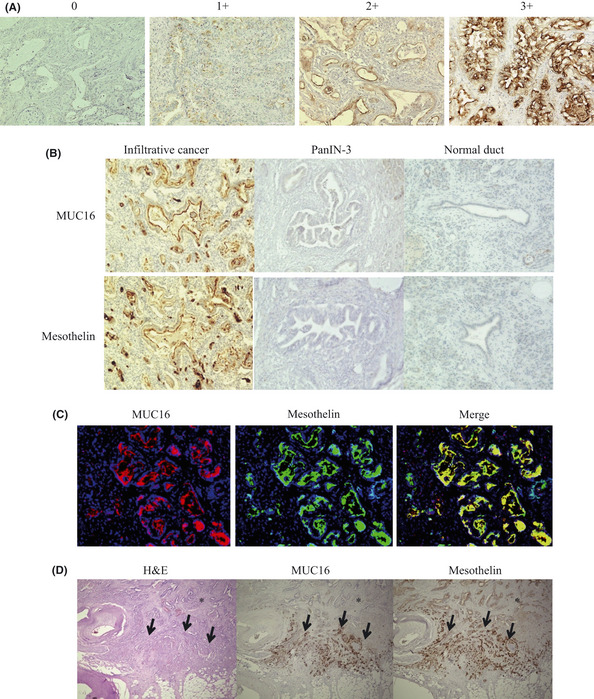
(A) Image of staining intensity grade. (0) no staining, (1+) weak, (2+) moderate, (3+) strong intensity. (B) MUC16 and mesothelin were stained at the apical membrane or cytoplasm only in infiltrative cancer, whereas no staining appeared in PanIN‐3 cells and normal ductal cells. (C) MUC16 and mesothelin expressed at the apical cancer cell surface in invasive ductal cancer cells labeled with Zenon Alexa Fluor 594 and 488. The merged image shows MUC16 and mesothelin expressed in the same cancer cells simultaneously. (D) The expression of MUC16 and mesothelin was higher at the invasion front (arrow) than in the main tumor (*). H&E, hematoxylin and eosin stain.
Cell lines and RNA interference.
Human pancreatic cancer cell line PK9 was obtained from the Cell Resource Center for Biomedical Research Institute of Development, Tohoku University (Miyagi, Japan).
Short hairpin RNA (shRNA) plasmids designed to target MUC16 were synthesized by SA Biosciences (Frederick, MD, USA) as follows: insert sequence ACAGCAGCATCAAGAGTTATT and ggaatctcattcgatgcatac (negative control). Each plasmid (0.8 μg) was mixed with 1 μL Lipofectamine2000 (Invitrogen, Carlsbad, CA, USA) in a final volume of 100 μL of Opti‐MEM medium and was added to PK9 cells grown to 40% confluence in 24‐well plates. Forty‐eight hours after transfection, G418 solution (Roche, Basel, Switzerland) was added in the appropriate concentration. The stably transfected cells were maintained in RPMI‐1640.
Coimmunoprecipitation assay.
To address binding between MUC16 and mesothelin, we performed coimmunoprecipitation assays using pancreatic cancer cell line PK9 and two surgical specimens obtained from 2 PDAC patients. The coimmunoprecipitation assays were performed using the Universal Magnetic Co‐IP Kit (Active Motif, Rixensart, Belgium) according to the manufacturer's protocol. Monoclonal antibody against CA125 (OC125, Abcam, Cambridge, UK), monoclonal antibody against mesothelin (MN‐1, Rockland, Gilbertsville, PA, USA) or rabbit IgG control (Abcam) were used for immunoprecipitation and immunoblotting.
In vitro invasion and migration assay in PK9 cell line transfected with MUC16 shRNA.
To investigate the effect of MUC16 expression on invasion and migration of pancreatic cancer cells, in vitro invasion and migration assays were performed in the membrane culture system using an 8‐μm pore size PET membrane coated with or without Matrigel (24‐well, BD Biosciences, San Diego, CA, USA). Parental PK9 cells, vector control‐PK9 cells and PK9 cells transfected with MUC16 shRNA were seeded into 5 × 10⁴ cells/500 μL growth medium on the Matrigel layer. The following procedures were performed (as previously described).20
In vitro invasion and migration assays with blocking antibodies for MUC16 and mesothelin.
To investigate the binding between MUC16 and mesothelin, we evaluated the effect of blocking antibodies against interaction between MUC16 and mesothelin on invasion and migration of pancreatic cancer cell PK9 by using in vitro invasion and migration assay. Because OC125 (DAKO, Carpinteria, CA, USA) and M11 (DAKO) are known to block the interaction between MUC16 and mesothelin,21 each antibody was used for blocking the interaction. Sodium azide was removed using the AbSelect Antibody Purification System (Innova Biosciences, Cambridge, UK).
Statistical analysis.
The association between MUC16/mesothelin expression and clinicopathologic factors in the patients with PDAC was assessed using the χ2‐test or the Fisher exact test. The survival curves were calculated using the Kaplan–Meier method and then compared by means of the log‐rank test. The prognostic significance of clinicopathologic features and MUC16/mesothelin expression was determined using univariate Cox regression analysis. Cox proportional hazards models were fitted for multivariate analysis. Statistical procedures were performed using SPSS version 13.0 (SPSS, Chicago, IL, USA). P < 0.05 was considered statistically significant.
Results
Identification of the transcriptional biomarkers associated with the invasion of pancreatic ductal adenocarcinoma by gene expression profiling.
Microarray data for the infiltrating cancer and PanIN‐3, which were harvested from an individual PDAC patient, were compared on the basis of the following criteria: (i) a ≥1.5‐fold change in the expression levels between the infiltrating cells and PanIN‐3 cells; (ii) a >100 absolute difference between the expression levels of the infiltrating cells and PanIN‐3 cells; and (iii) P < 0.05.22, 23 A total of 109 genes were differentially expressed between infiltrating cancer and PanIN‐3 cells in PDAC, including 87 genes that were upregulated and 22 that were downregulated in the infiltrating PDAC, and then 18 genes, which were expressed more in both infiltrating cancer and PanIN3 than in normal pancreatic epithelium, were listed (see Table 2), to focus on more significant genes related to carcinogenesis in PDAC. Among the upregulated genes identified by expression profiling, we focused on MUC16 because MUC16 expression in the infiltrating cancer was substantially higher than that of the PanIN‐3 cells in all five PDAC patients and normal pancreatic duct epithelium (Table 2), indicating that MUC16 is specifically expressed in invasive PDAC. We also focused on mesothelin in the upregulates genes list, because it had been previously reported to be a ligand receptor of MUC16.24, 25
Table 2.
Upregulated genes in the infiltrating cancer compared to PanIN‐3 component of pancreatic ductal adenocarcinoma as determined by expression profiling
| Probe ID | Gene name | Gene symbol | Fold change, mean | Mean expression level | |
|---|---|---|---|---|---|
| IC/PanIN‐3 | IC/normal | ||||
| 220196_at | Mucin 16 | MUC16 | 26.7 | 14.6 | 31.6 |
| 206884_s_at | Sciellin | SCEL | 17.4 | 3.8 | 4.7 |
| 205388_at | Troponin C type 2 | TNNC2 | 10.1 | 4.1 | 10.0 |
| 204416_x_at | Apolipoprotein C‐I | APOC1 | 6.7 | 5.9 | 7.2 |
| 213524_s_at | G0/G1switch 2 | G0S2 | 5.4 | 4.3 | 13.9 |
| 202504_at | Tripartite motif‐containing 29 | TRIM29 | 4.5 | 2.6 | 8.8 |
| 204070_at | Retinoic acid receptor responder 3 | RARRES3 | 3.7 | 3.4 | 5.4 |
| 242625_at | Radical S‐adenosyl methionine domain containing 2 | RSAD2 | 3.6 | 2.4 | 12.1 |
| 204885_s_at | Mesothelin | MSLN | 3.0 | 2.2 | 2.2 |
| 201564_s_at | Fascin homolog 1, actin‐bundling protein | FSCN1 | 3.0 | 2.7 | 3.1 |
| 205483_s_at | Interferon, alpha‐inducible protein | IFI | 3.0 | 2.5 | 7.6 |
| 228640_at | BH‐protocadherin | PCDH7 | 2.7 | 2.5 | 7.5 |
| 239979_at | Epithelial stromal interaction 1 | EPSTI1 | 2.5 | 2.1 | 6.5 |
| 231956_at | KIAA1618 | KIAA1618 | 2.4 | 2.4 | 3.8 |
| 204285_s_at | Phorbol‐12‐myristate‐13‐acetate‐induced protein 1 | PMAIP1 | 2.2 | 2.1 | 3.4 |
| 222810_s_at | RAS protein activator like 2 | RASAL2 | 2.2 | 2.2 | 2.3 |
| 243271_at | Sterile alpha motif domain containing 9‐like | SAMD9L | 2.1 | 1.9 | 5.7 |
| 200736_s_at | Glutathione peroxidase 1 | GPX1 | 2.0 | 1.9 | 2.0 |
IC, infiltrating cancer; PanIN, pancreatic intraepithelial neoplasms.
Immunohistochemical staining of MUC16 and mesothelin in pancreatic ductal adenocarcinoma.
The immunohistochemical analyses were performed in the paraffin‐embedded tissues from 103 patients with PDAC. MUC16 and mesothelin were stained by immunohistochemistry at the tumor apical membrane or cytoplasm (or both) in PDAC samples (Fig. 1B). Both MUC16 and mesothelin were expressed only in the infiltrating cancer cells and not in the PanIN‐3 cells (n = 30) or normal pancreatic epithelial cells (n = 103) (Fig. 1B). Furthermore, we found that these genes were not expressed in any non‐epithelial cells, including stromal cells, acinar cells and islet cells. Fluorescence immunohistochemistry using the merge technique showed that MUC16 and mesothelin were stained in the same cancer cells simultaneously (Fig. 1C). We observed that MUC16 and mesothelin were more highly expressed at the invasion front than in the main tumor in 48 of the 103 patients (47%) with PDAC (Fig. 1D).
The scores of MUC16 and mesothelin expression were calculated for each sample. The median scores of MUC16 and mesothelin were 150 (range, 0–300) and 180 (range, 0–300), respectively. The binarization of the score data for these markers was performed as “high expression” versus “low expression” at the median level. We categorized all samples into two groups to analyze the association of MUC16 and mesothelin expression with the clinicopathologic features in the patients with PDAC: the MUC16 high/mesothelin high expression group (n = 41) versus the other group (n = 62), which included the patients with MUC16 high/mesothelin low expression (n = 11), those with MUC16 low/mesothelin high expression (n = 11) and MUC16 low/mesothelin low expression (n = 40).
Association of MUC16 and mesothelin expression with pathologic factors.
The correlation of pathologic factors and MUC16/mesothelin expression was analyzed (Table 3). These pathologic factors were evaluated in accordance with the second English edition of the Classification of Pancreatic Carcinoma, proposed by the Japan Pancreas Society.26 The analysis indicated that a tumor size >4.0 cm, serosal invasion, invasion of other organs, and lymphatic permeation occurred significantly more often in the MUC16 high/mesothelin high expression group than in the other groups (P = 0.0041, P = 0.0131, P = 0.0356 and P = 0.0250, respectively).
Table 3.
The association of MUC16 and mesothelin expression with pathologic factors in patients with pancreatic ductal adenocarcinoma
| Number | MUC16 high/mesothelin high group | Other group | P | |
|---|---|---|---|---|
| 41 | 62 | |||
| Differentiation | ||||
| Well/ moderate | 93 | 35 | 57 | 0.1908 |
| Poor | 10 | 6 | 4 | |
| Tumor size | ||||
| >40mm | 16 | 12 | 4 | 0.0041 |
| ≤40mm | 87 | 29 | 58 | |
| Local progression | ||||
| Intrapancreatic common bile duct invasion | ||||
| Positive | 22 | 6 | 16 | 0.1757 |
| Negative | 81 | 35 | 46 | |
| Duodenal invasion | ||||
| Positive | 40 | 12 | 28 | 0.1052 |
| Negative | 63 | 29 | 34 | |
| Serosal invasion | ||||
| Positive | 74 | 35 | 39 | 0.0131 |
| Negative | 29 | 6 | 23 | |
| Retropancreatic tissue invasion | ||||
| Positive | 85 | 35 | 50 | 0.5369 |
| Negative | 18 | 6 | 12 | |
| Portal venous system invasion | ||||
| Positive | 25 | 13 | 12 | 0.1523 |
| Negative | 78 | 28 | 50 | |
| Arterial system invasion | ||||
| Positive | 5 | 4 | 1 | 0.0803 |
| Negative | 98 | 37 | 61 | |
| Extrapancreatic nerve plexus invasion | ||||
| Positive | 33 | 16 | 17 | 0.2166 |
| Negative | 70 | 25 | 45 | |
| Invasion of other organs | ||||
| Positive | 6 | 5 | 1 | 0.0356 |
| Negative | 97 | 36 | 61 | |
| Lymphatic permeation | ||||
| Positive | 88 | 39 | 49 | 0.0250 |
| Negative | 15 | 2 | 13 | |
| Vascular permeation | ||||
| Positive | 64 | 28 | 36 | 0.2948 |
| Negative | 39 | 13 | 26 | |
| Perineural invasion | ||||
| Positive | 76 | 29 | 47 | 0.5665 |
| Negative | 27 | 12 | 15 | |
| Lymph node metastasis | ||||
| Positive | 69 | 32 | 37 | 0.0523 |
| Negative | 34 | 9 | 25 | |
Binding of MUC16 and mesothelin in pancreatic cancer cell PK9 and surgical specimens from patients with pancreatic ductal adenocarcinoma.
The coimmunoprecipitation assays between MUC16 and mesothelin using pancreatic cancer cell line PK9 and surgical specimens obtained from two PDAC patients (number 1: stage IIB, number 2: stage IV) showed that the whole cell lysates or tissue homogenates were immunoprecipitated and immunoblotted with anti‐MUC16 and anti‐mesothelin antibody (Fig. 2A), indicating that MUC16 and mesothelin can bind in PDAC.
Figure 2.
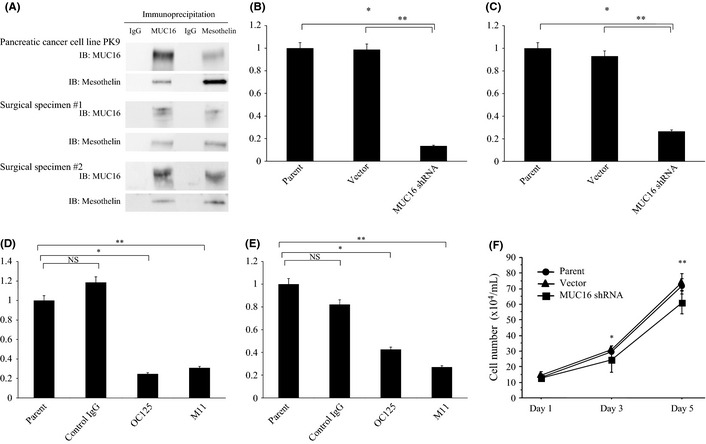
(A) The results of coimmunoprecipitation assay in pancreatic cancer cell line PK9 and clinical samples from the patients with pancreatic ductal adenocarcinoma. The whole cell lysates extracted from cell line or tissue homogenates extracted from two surgical specimens were immunoprecipitated and immunoblotted with anti‐MUC16 and anti‐mesothelin antibody. IB, immunoblotting. (B) Invasion chamber experiments in PK9 transfected with MUC16 shRNA. The invasion was significantly suppressed after inhibition of MUC16 expression (*P = 0.0009, **P = 0.0067). (C) Migration assays in PK9 transfected with MUC16 shRNA. The migration was significantly suppressed after downregulation of MUC16 expression (*P = 0.0005, **P = 0.0055). (D) Invasion assay with the blockage of MUC16 binding to mesothelin with the neutralizing antibodies against MUC16 (OC125 or M11, *P = 0.0014, **P = 0.0043). (E) Migration assay with the blockage of MUC16 binding to mesothelin with OC12 5 or M11 (*P = 0.0020, **P = 0.0003). (F) Cell growth assay in PK9 transfected with MUC16 shRNA. The cell growth was significantly suppressed after inhibition of MUC16 expression (*P = 0.0469, **P = 0.0036). NS, not significant.
Role of MUC16 and mesothelin in invasion, migration and cell growth of pancreatic cancer cell line.
PK9 cells express MUC16 and were transfected with shRNA targeted to MUC16. Stable MUC16–shRNA‐transfected PK9 cells showed downregulation of MUC16 protein expression compared to the vector control (data not shown). Invasion chamber experiments revealed that MUC16–shRNA‐transfected PK9 cells had significant suppression of cell invasion (Fig. 2B). Migration assays also demonstrated that downregulation of MUC16 significantly reduced migration (Fig. 2C). The blockage of MUC16 binding to mesothelin with the neutralizing antibodies against MUC16 (OC125 or M11) significantly suppressed invasion and migration of pancreatic cancer cells (Fig. 2D,E). In terms of the effect of MUC16 on cell growth, parental PK9 cells, vector control‐PK9 cells and MUC16–shRNA‐transfected PK9 were seeded in concentration of 10 × 104/mL, and the cell numbers were counted on day 1, 3 and 5 using a hemocytometer. As a result, the cell growth was significantly suppressed after inhibition of MUC16 expression (Fig. 2F).
Association of MUC16 and mesothelin expression with survival in patients with pancreatic ductal adenocarcinoma.
The overall survival of the MUC16 high/mesothelin high expression group was significantly worse than in the other group (median 11.9 vs 22.8 months, P = 0.0006; Fig. 3A). The 1‐, 3‐ and 5‐year survival rates of the MUC16 high/mesothelin high group versus the other group were as follows: 51.2 vs 72.6%, 8.0 vs 25.6% and 0 vs 11.5%, respectively. The disease‐free survival of the MUC16 high/mesothelin high expression group was also worse than the other group (median 6.7 vs 10.9 months, P = 0.0002; Fig. 3B). The 1‐, 3‐ and 5‐year disease‐free survival rates of the MUC16 high/mesothelin high group versus the other group were as follows: 12.2 vs 48.4%, 2.5 vs 20.3% and 0 vs 11.5%, respectively. In the univariate analysis of the overall survival of the patients with PDAC, a tumor size > 4.0 cm, duodenal invasion, portal venous system invasion, lymphatic permeation, vascular permeation, lymph node metastasis and MUC16 high/mesothelin high expression were potential factors for predicting poor survival (Table 4). According to a multivariate analysis of overall survival, vascular permeation and MUC16 high/mesothelin high expression were independent factors for predicting short survival for the patients with PDAC (P = 0.0025, HR, 2.241; 95% CI, 1.364–4.310; P = 0.0158, HR, 1.936; 95%CI, 1.132–3.310, respectively; Table 4). Similarly, in the multivariate analysis of disease‐free survival, a tumor size > 4.0 cm, lymphatic permeation and MUC16 high/mesothelin high expression were independent prognostic factors for a poorer disease‐free survival (P = 0.0167, HR, 2.141, 95% CI, 1.148–4.000; P = 0.0202, HR, 3.984, 95% CI, 1.241–12.821; P = 0.0131, HR, 1.985, 95% CI, 1.155–3.412, respectively; Table 5).
Figure 3.
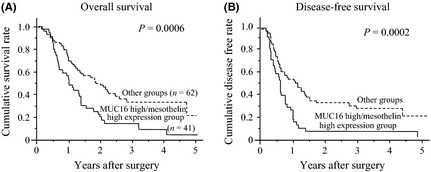
The overall survival (A) and disease‐free survival (B) of the MUC16 high/mesothelin high expression group was worse than that of the other groups (median, 11.9 vs 22.8 months, P = 0.0006; 6.7 vs 10.9 months, P = 0.0002, respectively).
Table 4.
Univariate and multivariate analysis using the Cox proportional hazards regression model of overall survival in 103 patients with pancreatic ductal adenocarcinoma
| Univariate analysis | Multivariate analysis | |||||
|---|---|---|---|---|---|---|
| P | HR | 95% CI | P | HR | 95% CI | |
| Age, ≥70 | 0.2692 | 0.906 | 0.962–1.011 | – | – | – |
| Gender, male | 0.7711 | 1.026 | 0.678–1.689 | – | – | – |
| Differentiation, poor | 0.9228 | 1.043 | 0.451–2.410 | – | – | – |
| Tumor size, > 40 mm | 0.0070 | 2.203 | 1.241–3.906 | 0.3294 | 1.340 | 0.743–2.421 |
| Local progression | ||||||
| CH, positive | 0.1651 | 1.458 | 0.856–2.481 | – | – | – |
| DU, positive | 0.0465 | 1.595 | 1.007–2.525 | 0.0782 | 1.575 | 0.950–2.604 |
| S, positive | 0.3320 | 1.297 | 0.767–2.188 | – | – | – |
| RP, positive | 0.0715 | 1.848 | 0.948–3.610 | – | – | – |
| PV, positive | 0.0203 | 1.818 | 1.098–3.012 | 0.6830 | 1.119 | 0.653–1.916 |
| A, positive | 0.6183 | 1.259 | 0.507–3.135 | – | – | – |
| PL, positive | 0.0666 | 1.543 | 0.971–2.451 | – | – | – |
| OO, positive | 0.4899 | 1.342 | 0.581–3.101 | – | – | – |
| Lymphatic permeation, positive | 0.0034 | 3.937 | 1.575–9.804 | 0.1190 | 2.375 | 0.801–7.042 |
| Vascular permeation, positive | < 0.0001 | 3.155 | 1.859–5.348 | 0.0025 | 2.421 | 1.364–4.310 |
| Perineural invasion, positive | 0.1345 | 1.527 | 0.877–2.660 | – | – | – |
| Lymph node metastasis, positive | 0.0043 | 2.151 | 1.272–3.636 | 0.8436 | 1.067 | 0.561–2.033 |
| MUC16/mesothelin expression, high | 0.0008 | 2.206 | 1.392–3.495 | 0.0158 | 1.936 | 1.132–3.310 |
A, arterial system invasion; CH, intrapancreatic common bile duct invasion; CI, confidence interval; DU, duodenal invasion; HR, hazard ratio; OO, invasion of other organs; PL, extrapancreatic nerve plexus invasion; PV, portal venous system invasion; RP, retropancreatic tissue invasion; S, serosal invasion.
Table 5.
Univariate and multivariate analysis using the Cox proportional hazards regression model of disease‐free survival in 103 patients with pancreatic ductal adenocarcinoma
| Univariate analysis | Multivariate analysis | |||||
|---|---|---|---|---|---|---|
| P | HR | 95% CI | P | HR | 95% CI | |
| Age, ≥70 | 0.5105 | 1.161 | 0.743–1.815 | – | – | – |
| Gender, male | 0.9862 | 0.996 | 0.638–1.555 | – | – | – |
| Differentiation, poor | 0.5830 | 0.792 | 0.344–1.825 | – | – | – |
| Tumor size, > 40 mm | 0.0001 | 3.257 | 1.770–5.988 | 0.0167 | 2.141 | 1.148–4.000 |
| Local progression | ||||||
| CH, positive | 0.6377 | 1.138 | 0.664–1.953 | – | – | – |
| DU, positive | 0.0105 | 1.805 | 1.148–2.833 | 0.0633 | 1.590 | 0.975–2.591 |
| S, positive | 0.0864 | 1.605 | 0.935–2.755 | – | – | – |
| RP, positive | 0.1104 | 1.689 | 0.887–3.205 | – | – | – |
| PV, positive | 0.0410 | 1.675 | 1.021–2.755 | 0.6492 | 1.136 | 0.656–1.965 |
| A, positive | 0.8599 | 1.095 | 0.397–3.021 | – | – | – |
| PL, positive | 0.2523 | 1.316 | 0.822–2.110 | – | – | – |
| OO, positive | 0.7087 | 1.189 | 0.479–2.959 | – | – | – |
| Lymphatic permeation, positive | 0.0034 | 3.937 | 2.370–18.181 | 0.0202 | 3.984 | 1.241–12.821 |
| Vascular permeation, positive | 0.0012 | 2.198 | 1.362–3.546 | 0.1429 | 1.506 | 0.871–2.604 |
| Perineural invasion, positive | 0.0452 | 1.736 | 1.012–2.985 | 0.1162 | 1.577 | 0.894–2.778 |
| Lymph node metastasis, positive | < 0.0001 | 3.778 | 1.938–5.917 | 0.2388 | 1.484 | 0.770–2.857 |
| MUC16/mesothelin expression, high | 0.0002 | 2.378 | 1.497–3.777 | 0.0131 | 1.985 | 1.155–3.412 |
A, arterial system invasion; CH, intrapancreatic common bile duct invasion; CI, confidence interval; DU, duodenal invasion; HR, hazard ratio; OO, invasion of other organs; PL, extrapancreatic nerve plexus invasion; PV, portal venous system invasion; RP, retropancreatic tissue invasion; S, serosal invasion.
Discussion
We first identified genes specific to the invasion process in PDAC using microdissection and gene expression profiling techniques. In this study, we compared microarray data of infiltrating cancer and PanIN3, which were harvested from an individual PDAC patient, to exclude the difference in original gene expression among individuals. Then, we were able to identify similar genes that were differently expressed between infiltrating cancer and PanIN‐3 in all five patients.
Among the identified upregulated genes, we focused on MUC16 because its expression in the infiltrating cancer was substantially higher than that in the PanIN‐3 cells. We also focused on mesothelin in the list, because it was reported to be a ligand receptor of MUC16. Their interaction has been postulated to play an important role during tumorigenesis and metastasis in ovarian cancer.24, 25 Rump and colleagues reported that the binding of MUC16 and mesothelin expressed by cancer cells mediates heterotypic cell adhesion and might contribute to the metastasis and invasion of ovarian cancer.24
In the present study, immunohistochemical analysis revealed that MUC16 and mesothelin were expressed in the infiltrating cancer cells but not in the PanIN‐3 cells or normal pancreatic tissues, consistent with the results of gene expression profiling. Furthermore, fluorescence immunohistochemistry showed that MUC16 and mesothelin were expressed simultaneously in the PDAC cells.
MUC16 encodes the CA125 antigen and is a membrane‐bound mucin protein with a high molecular weight between 2.5 and 5.0 million daltons.27 Its proposed structure comprises an N‐terminal domain of >22 000 amino acid residues that are presumably heavily glycosylated, a central domain containing up to 60 glycosylated repeat sequences constituting the tandem repeats characteristic of mucins, and a C‐terminal domain composed of a transmembrane domain and a short cytoplasmic tail with possible phosphorylation sites.28 Few reports have described the expression of MUC16 in cancers. In this study, using immunohistochemistry, we detected the expression of MUC16 in 94 of 103 PDAC cases (91%).
The mesothelin gene encodes a 71‐kDa precursor protein that is processed into the 40‐kDa glycosylphosphatidylinositol‐anchored membrane glycoprotein, mesothelin and a 31‐kDa fragment called megakaryocyte potentiating factor.29, 30 Mesothelin expression in normal human tissues is limited to mesothelial cells lining the pleura, pericardium and peritoneum,29 and the protein is also expressed by a variety of solid tumors, including ovarian cancer, malignant mesothelioma, lung cancer and PDAC.31, 32 Mesothelin expression reportedly conferred chemoresistance and a poorer clinical outcome in ovarian cancer patients.33
We found that the coexpression of MUC16 and mesothelin was also increased at the invasion front (n = 48), compared to that in the main tumor in several PDAC tissues, and, then, MUC16 high/mesothelin high expression in PDAC was significantly associated with large tumors, serosal invasion, invasion of other organs and lymphatic permeation. These results indicate that these molecules seem to be involved in invasion and migration of pancreatic cancer cells. Recent reports show the role of MUC16 in ovarian cancer tumorigenesis,34, 35 and it has been noted that MUC16 regulates cell growth, invasion and metastasis in epithelial ovarian cancer.34 However, another report indicates the opposite concept, that downregulation of MUC16 inhibits invasion and migration due to the suppression of epithelial to mesenchymal transition in ovarian cancer cells.35 Thus, the role of MUC16 in ovarian cancer cell invasion and migration is still controversial and no report regarding the role of MUC16 on pancreatic cancer cell invasion and migration has yet appeared.
To examine the role of interaction of MUC16 and mesothelin on pancreatic cancer invasion and migration, we investigated whether shRNA and blocking antibodies for MUC16 suppress invasion and migration of pancreatic cancer cells. We investigated the expression of MUC16 and mesothelin by RT‐PCR, western blotting and immunocytochemistry in eight pancreatic cancer cell lines (PK9, PANC1, MIAPaCa2, AsPC1, BxPC3, Capan‐1, Capan‐2 and PK1). By RT‐PCR, both MUC16 and mesothelin mRNAs were detected in five cell lines, including PK9, AsPC1, BxPC3, Capan‐2 and PK1. Using western blotting and immunocytochemistry, the strongest positive expressions of both MUC16 and mesothelin were found in PK9. Therefore, in the present study, we used only PK9 cell line for biological experiments. The blockage of the interaction between MUC16 and mesothelin suppressed invasion and migration of pancreatic cancer cells, suggesting that MUC16 binding to mesothelin is important for cell invasion and migration in pancreatic cancer cells.
Furthermore, we focused on the survival of patients with MUC16 high and mesothelin high expression because coexpression of these two genes is obviously correlated to the invasion of PDAC, and MUC16 high/mesothelin high expression was an independent prognostic factor for poor survival. We examined whether there are any differences in survival between the MUC16 high/mesothelin high group and the MUC16 high/mesothelin low group or MUC16 low/mesothelin high group. However, these groups were very small (n = 11), and larger groups of patients are necessary for further study.
The mechanism of overexpression of MUC16 and mesothelin in PDAC has not yet been clarified yet. It is also unclear whether the coexpression of MUC16 and mesothelin was coincidental or the increased expression of MUC16 was associated with an upregulation of mesothelin expression. These issues should be clarified in further studies. Moreover, other molecules in Table 2 besides MUC16 and mesothelin might potentially contribute to the invasion process. In the future, we analyze the roles of other upregulated genes in infiltrating cancer than in PanIN‐3 for PDAC patients.
In conclusion, MUC16 and mesothelin are involved in pancreatic cancer cell invasion and migration, and MUC16 and mesothelin clinically represent new prognostic biomarkers for PDAC and might be new therapeutic targets for patients with PDAC, including immunotherapy using a peptide vaccine or monoclonal antibody therapy.
Disclosure Statement
The authors have no conflict of interest.
Acknowledgments
This study was supported by Grant‐in‐Aid no.19390341 and 22791297 from the Ministry of Education, Culture, Sports, Science and Technology of Japan.
References
- 1. Hidalgo M. Pancreatic cancer. N Engl J Med 2010; 362: 1605–17. [DOI] [PubMed] [Google Scholar]
- 2. Dumartin L, Quemener C, Laklai H et al Netrin‐1 mediates early events in pancreatic adenocarcinoma progression, acting on tumor and endothelial cells. Gastroenterology 2010; 138: 1595–606. [DOI] [PubMed] [Google Scholar]
- 3. Hruban RH, Goggins M, Parsons J Kern SE. Progression model for pancreatic cancer. Clin Cancer Res 2000; 6: 2969–72. [PubMed] [Google Scholar]
- 4. Hruban RH, Adsay NV, Albores‐Saavedra J et al Pancreatic intraepithelial neoplasia: a new nomenclature and classification system for pancreatic duct lesions. Am J Surg Pathol 2001; 25: 579–86. [DOI] [PubMed] [Google Scholar]
- 5. Kern S, Hruban R, Hollingsworth MA et al A white paper: the product of a pancreas cancer think tank. Cancer Res 2001; 61: 4923–32. [PubMed] [Google Scholar]
- 6. Diaz VM, Hurtado M, Thomson TM, Reventos J, Paciucci R. Specific interaction of tissue‐type plasminogen activator (t‐PA) with annexin II on the membrane of pancreatic cancer cells activates plasminogen and promotes invasion in vitro. Gut 2004; 53: 993–1000. [DOI] [PMC free article] [PubMed] [Google Scholar]
- 7. Ceyhan GO, Giese NA, Erkan M et al The neurotrophic factor artemin promotes pancreatic cancer invasion. Ann Surg 2006; 244: 274–81. [DOI] [PMC free article] [PubMed] [Google Scholar]
- 8. Abiatari I, DeOliveira T, Kerkadze V et al Consensus transcriptome signature of perineural invasion in pancreatic carcinoma. Mol Cancer Ther 2009; 8: 1494–504. [DOI] [PubMed] [Google Scholar]
- 9. Sobin LH, Wittekind CH. International Union Against Cancer: TNM Classification of Malignant Tumors, 6th edn New York, NY: Wiley and Liss, 2002. [Google Scholar]
- 10. Hirono S, Yamaue H, Hoshikawa Y et al Molecular markers associated with lymph node metastasis in pancreatic ductal adenocarcinoma by genome‐wide expression profiling. Cancer Sci 2010; 101: 259–66. [DOI] [PMC free article] [PubMed] [Google Scholar]
- 11. McClelland RA, Finlay P, Walker KJ et al Automated quantitation of immunocytochemically localized estrogen receptors in human breast cancer. Cancer Res 1990; 50: 3545–50. [PubMed] [Google Scholar]
- 12. Detre S, Saclani Jotti G, Dowsett M. A “quickscore” method for immunohistochemical semiquantitation: Validation for oestrogen receptor in breast carcinomas. J Clin Pathol 1995; 48: 876–8. [DOI] [PMC free article] [PubMed] [Google Scholar]
- 13. Allred DC, Harvey JM, Berardo M, Clark GM. Prognostic and predictive factors in breast cancer by immunohistochemical analysis. Mod Pathol 1998; 11: 155–68. [PubMed] [Google Scholar]
- 14. Campagna D, Cope L, Lakkur SS, Henderson C, Laheru D, Iacobuzio‐Donahue CA. Gene expression profiles associated with advanced pancreatic cancer. Int J Clin Exp Pathol 2008; 1: 32–43. [PMC free article] [PubMed] [Google Scholar]
- 15. Fritsche P, Seidler B, Schuler S et al HDAC2 mediates therapeutic resistance of pancreatic cancer cells via the BH3‐only protein NOXA. Gut 2009; 58: 1399–409. [DOI] [PubMed] [Google Scholar]
- 16. Meinhold‐Heerlein I, Stenner‐Liewen F, Liewen H et al Expression and potential role of Fas‐associated phosphatase‐1 in ovarian cancer. Am J Pathol 2001; 158: 1335–44. [DOI] [PMC free article] [PubMed] [Google Scholar]
- 17. Seethala RR, Gooding WE, Handler PN et al Immunohistochemical analysis of phosphotyrosine signal transducer and activator of transcription 3 and epidermal growth factor receptor autocrine signaling pathways in head and neck cancers and metastatic lymph nodes. Clin Cancer Res 2008; 14: 1303–9. [DOI] [PMC free article] [PubMed] [Google Scholar]
- 18. Campbell EJ, McDuff E, Tatarov O et al Phosphorylated c‐Src in the nucleus is associated with improved patient outcome in ER‐positive breast cancer. Br J Cancer 2008; 99: 1769–74. [DOI] [PMC free article] [PubMed] [Google Scholar]
- 19. Cappia S, Righi L, Mirabelli D et al Prognostic role of osteopontin expression in malignant pleural mesothelioma. Am J Clin Pathol 2008; 130: 58–64. [DOI] [PubMed] [Google Scholar]
- 20. Ieda J, Yokoyama S, Tamura K et al Re‐expression of CEACAM1 long cytoplasmic domain isoform is associated with invasion and migration of colorectal cancer. Int J Cancer 2011; 129: 1351–61. [DOI] [PubMed] [Google Scholar]
- 21. Scholler N, Garvik B, Hayden‐Ledbetter M, Kline T, Urban N. Development of a CA125‐mesothelin cell adhesion assay as a screening tool for biologics discovery. Cancer Lett 2007; 8: 130–6. [DOI] [PMC free article] [PubMed] [Google Scholar]
- 22. Gronborg M, Kristiansen TZ, Iwahori A et al Biomarker discovery from pancreatic cancer secretome using a differential proteomic approach. Mol Cell Proteomics 2006; 5: 157–71. [DOI] [PubMed] [Google Scholar]
- 23. Yamanaka S, Sunamura M, Furukawa T et al Chromosome 12, frequently deleted in human pancreatic cancer, may encode a tumor‐suppressor gene that suppresses angiogenesis. Lab Invest 2004; 84: 1339–51. [DOI] [PubMed] [Google Scholar]
- 24. Rump A, Morikawa Y, Tanaka M et al Binding of ovarian cancer antigen CA125/MUC16 to mesothelin mediates cell adhesion. J Biol Chem 2004; 279: 9190–8. [DOI] [PubMed] [Google Scholar]
- 25. Gubbels JA, Belisle J, Onda M et al Mesothelin‐MUC16 binding is a high affinity, N‐glycan dependent interaction that facilitates peritoneal metastasis of ovarian tumors. Mol Cancer 2006; 5: 50. [DOI] [PMC free article] [PubMed] [Google Scholar]
- 26. Japan Pancreas Society . Classification of Pancreatic Carcinoma, 2nd English edn Tokyo: Kanahara, 2003. [Google Scholar]
- 27. Yin BW, Lloyd KO. Molecular cloning of the CA125 ovarian cancer antigen: identification as a new mucin, MUC16. J Biol Chem 2001; 276: 27371–5. [DOI] [PubMed] [Google Scholar]
- 28. O'Brien TJ, Beard JB, Underwood LJ, Shigemasa K. The CA 125 gene: a newly discovered extension of the glycosylated N‐terminal domain doubles the size of this extracellular superstructure. Tumor Biol 2002; 23: 154–69. [DOI] [PubMed] [Google Scholar]
- 29. Chang K, Pastan I, Willingham MC. Isolation and characterization of a monoclonal antibody, K1, reactive with ovarian cancers and normal mesothelium. Int J Cancer 1992; 50: 373–81. [DOI] [PubMed] [Google Scholar]
- 30. Hassan R, Bera T, Pastan I. Mesothelin: a new target for immunotherapy. Clin Cancer Res 2004; 10(12 Pt 1): 3937–42. [DOI] [PubMed] [Google Scholar]
- 31. Ordonez NG. Application of mesothelin immunostaining in tumor diagnosis. Am J Surg Pathol 2003; 27: 1418–28. [DOI] [PubMed] [Google Scholar]
- 32. Argani P, Iacobuzio‐Donahue CA, Ryu B et al Mesothelin is overexpressed in the vast majority of ductal adenocarcinomas of the pancreas: identification of a new pancreatic cancer marker by serial analysis of gene expression (SAGE). Clin Cancer Res 2001; 7: 3862–8. [PubMed] [Google Scholar]
- 33. Cheng WF, Huang CY, Chang MC et al High mesothelin correlates with chemoresistance and poor survival in epithelial ovarian carcinoma. Br J Cancer 2009; 100: 1144–53. [DOI] [PMC free article] [PubMed] [Google Scholar]
- 34. Thériault C, Pinard M, Comamala M et al MUC16 (CA125) regulates epithelial ovarian cancer cell growth, tumorigenesis and metastasis. Gynecol Oncol 2011; 121: 434–43. [DOI] [PubMed] [Google Scholar]
- 35. Comamala M, Pinard M, Thériault C et al Downregulation of cell surface CA125/MUC16 induces epithelial‐to‐mesenchymal transition and restores EGFR signaling in NIH:OVCAR3 ovarian carcinoma cells. Br J Cancer 2011; 104: 989–99. [DOI] [PMC free article] [PubMed] [Google Scholar]