Abstract
The expression and implications of gangliosides in human osteosarcomas have not been systematically analyzed. In this study, we showed that gangliosides GD3 and GD2 are highly expressed in the majority of human osteosarcoma cell lines derived from oral cavity regions. Introduction of GD3 synthase cDNA into a GD3/GD2‐negative (GD3/GD2−) human osteosarcoma subline resulted in the establishment of GD3/GD2+ transfectant cells. They showed increased cell migration and invasion activities in wound healing and Boyden chamber invasion assays, respectively, compared to the control cells. When treated with serum, GD3/GD2+ cells showed stronger tyrosine phosphorylation of p130Cas, focal adhesion kinase, and paxillin than GD3/GD2− cells. In particular, paxillin underwent much stronger phosphorylation, suggesting its role in cell motility. Furthermore, we tried to dissect the roles of GD3 and GD2 in the malignant properties of the transfectant cells by establishing single ganglioside‐expressing cells, that is, either GD3 or GD2. Although GD3/GD2+ cells showed the most malignant properties, GD2+ cells showed almost equivalent levels to GD3/GD2+ cells in invasion and migration activities, and in the intensities of tyrosine phosphorylation of paxillin. Among Src family kinases, Lyn was expressed predominantly, and was involved in the invasion and motility of GD3‐ and/or GD2‐expressing transfectants. Furthermore, it was elucidated by gene silencing that Lyn was located in a different pathway from that of FAK to eventually lead paxillin activation. These results suggested that GD2/GD3 are responsible for the enhancement of the malignant features of osteosarcomas, and might be candidate targets in molecular‐targeted therapy.
Osteosarcomas are one of the most refractory malignant cancers and are the most common malignant bone tumors in children and adolescents.1 The cure rate of whole osteosarcoma patients has been approximately 20%, and 5‐year survival has been approximately 60%, despite marked progress in treatment. More than 20% of patients with osteosarcoma eventually develop pulmonary metastases and die.2 Approximately 6.5–8% of all osteosarcomas develop in the oral cavity, and the mandible is more commonly affected than the maxilla.3, 4, 5, 6, 7 Although many trials to develop novel therapeutic approaches for this disease have been carried out, no effective treatments have been reported.
Sialic acid‐containing glycosphingolipids, gangliosides, are expressed abundantly in nervous tissues of vertebrates, and have been considered to be involved in the development and differentiation of nervous systems.8 In turn, gangliosides with relatively simple structures have been reported to be expressed in neuroectoderm‐derived human cancers,9, 10, 11 T‐cell leukemias,12 and lung cancers.13, 14 Some of them have been used as markers of cancers and/or targets of immunotherapy in melanomas and neuroblastomas.15, 16
In particular, ganglioside GD3 was identified as a human melanoma‐associated glycolipid antigen, and has been used as a target of antibody therapy of melanomas.15, 17 GD2 was also identified as a neuroblastoma‐associated glycolipid and/or an advanced melanoma ganglioside marker. It has been used as a target of antibody therapy,18, 19, 20, 21 anti‐idiotype antibody therapy,22 and T‐body strategy.23 GD2 was also found in HTLV‐I‐infected T cells24 and small‐cell lung cancer cells.13 Recently, GD2 was found in human osteosarcomas,25 although the implications of GD2 in those tumor cells have not been established.
In this study, expression of various carbohydrate antigens in osteosarcoma cell lines was examined, resulting in the discovery that disialyl glycolipids GD2 and GD3 are characteristically expressed. Therefore, we have analyzed the implication of GD2/GD3 expression in cancer properties. Although the activated signaling pathway under GD2/GD3 expression in osteosarcomas was similar with that reported in melanoma cells,26, 27 there were big differences in mainly activated adaptor molecules, and in the adhesion activities of GD2/GD3‐expressing cells to ECMs between melanomas and osteosarcomas. Details of these regulations have been investigated.
Materials and Methods
Antibodies
Anti‐phosphotyrosine mAb PY20, anti‐FAK (mouse mAb IgG1), anti‐paxillin (mouse mAb IgG1), anti‐Yes (mouse mAb IgG1), anti‐Fyn (mouse mAb IgG2b), and anti‐Lyn (mouse mAb IgG1), were from BD Transduction Laboratories (San Jose, CA, USA). Anti‐p130Cas (rabbit IgG, C‐20) and anti‐c‐Src (rabbit IgG, N‐16) were from Santa Cruz Biotechnology (Santa Cruz, CA, USA). Anti‐phospho‐Src family (tyr416, rabbit IgG) was from Cell Signaling Technology (Beverly, MA, USA). Anti‐rabbit IgG conjugated with HRP was purchased from Cell Signaling Technology. Anti‐mouse IgG conjugated with HRP was from Amersham Pharmacia Biotech (Little Chalfont, UK). Anti‐mouse IgG conjugated with HRP (Mouse TrueBlot Ultra) was from eBioscience (San Diego, CA, USA). Anti‐GD3 mAb R24 and anti‐GD2 mAb 220‐51 were as described previously.13, 26
Reagents
Protein G‐Sepharose or A‐Sepharose beads were from Amersham Biosciences (Little Chalfont, UK). Purified mouse IgG and rabbit IgG were from Millipore (Temecula, CA, USA).
Cell lines and transfectant cells
Human osteosarcoma cell lines were provided by Dr. Nishida at Nagoya University (U2OS, MG‐63, HOS; Nagoya, Japan) and by Riken Cell Bank (Saos‐2, HuO‐3N1, NOS‐1, NOS‐2, HS‐Os‐1, HuO 9N2; Tsukuba, Japan). These cell lines were maintained as described previously.26 Construction of a cDNA expression vector of human α2,8‐sialyltransferase (GD3 synthase), and generation of GD3+ transfectant cells by transfecting the cDNA into HOS cells were as described previously.26 Transfectant cells were selected in the presence of G418 (500 μg/mL) (Sigma, St Louis, MO, USA), and maintained in DMEM with 7.5% FCS and G418 (500 μg/mL).
Preparation of siRNA
Several kinds of Stealth siRNAs against some portion of human Lyn cDNA were designed by Invitrogen (Carlsbad, CA, USA) and siRNAs against p130Cas, paxillin, and FAK were designed by Dharmacon Research (Lafayette, CO, USA) as previously described.26, 27 Nucleotide sequences are shown in Data S1.
Flow cytometry
The cell surface expression of gangliosides was analyzed by flow cytometry (Beckton Dickinson, Mountain View, CA, USA) as previously described.26
Invasion assays
Invasion assays were carried out using a Boyden chamber as previously described.26
MTT assay
MTT assay was also carried out as described previously.26
Two‐dimensional motility assay
To analyze the 2‐D motility of cells, a wound healing scratch motility assay was carried out as described previously.28
Preparation of cell lysates
Cells (5 or 10 × 105) were plated in a 6‐ or 10‐cm dish, respectively, and serum‐starved for 18 h before treatment with FCS. After being treated with FCS for 0–60 min at 37°C, cells were lysed as previously described.29, 30
Western IB
Lysates were separated with SDS‐PAGE using 10% gels. The separated proteins were transferred onto an Immobilon‐P membrane (Millipore, Bedford, MA, USA), and blotting was done as previously described.29, 30
Immunoprecipitation
The lysates were immunoprecipitated with antibodies bound to protein G‐Sepharose or A‐Sepharose. The precipitated proteins were separated using SDS‐PAGE, then immunoblotted as previously described.30
Knockdown of p130Cas, FAK, paxillin, and Lyn by siRNAs
Human osteosarcoma cells were plated at 70–80% confluency in 6‐cm cell culture dishes, and were cultured overnight. They were transfected with siRNAs (100 nM) as described previously.29, 30 For invasion assay and a wound healing scratch motility assay, cells were collected after 2 days of the transfection and replated.
Cell adhesion assay using RT‐CES
After addition of culture medium with serum, cells (1 × 10⁴) were added in ACEA e‐plates (ACEA Biosciences, San Diego, CA, USA). The adhesion of cells was monitored continuously using the RT‐CES system (Wako Pure Chemical, Osaka, Japan).
Protein phosphorylation during adhesion
Protein phosphorylation during adhesion was analyzed by Western IB as previously described.29
Real‐time RT‐PCR
Extraction of total RNA and real‐time RT‐PCR were carried out using individual primers (Data S2, as described in Data S3).
Image analysis
To analyze the band intensities in IB and the autoradiograph, bands were scanned by Adobe Photoshop CS2 or Typhoon 8600 and quantified using NIH Image 1.61 (www.rsb.info.nih.gov/nih-image/).
Statistical analysis
Statistical significance of data was determined using Student's t‐test.
Addition of exogenous GD3 to cultured HOS cells
Cells (1 × 10⁶) were plated in a 10‐cm dish and serum‐starved for 18 h. After addition of GD3 (5 μM; NOF, Tokyo, Japan) to the plates, cells were incubated for 1.5 h at 37°C, then treated with FCS for 15 min. Cells before and after FCS treatment were lysed as previously described.29
Treatment with PDMP
Cells (5 × 10⁵) were plated in a 6‐cm dish and treated with a Glc‐Cer synthase inhibitor, PDMP (20 μM), for 4 days. After serum starvation for 18 h, cells were treated with FCS for 15 min at 37°C. Cells before and after FCS treatment were lysed as previously described.29
Results
Expression of GD3 and GD2 gangliosides in osteosarcoma cell lines
As shown in Figure 1(A), the majority of osteosarcoma cell lines expressed high levels of GD2 and low levels of GD3. As the HOS cell line showed no expression of either GD3 or GD2, it was used in the following study. Features of other ganglioside expression are shown in Figure S1.
Figure 1.
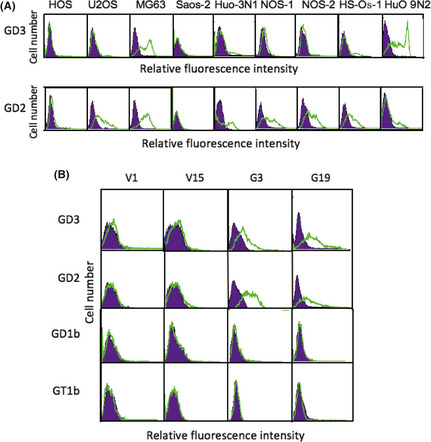
Expression of GD3 and GD2 gangliosides on osteosarcoma cell lines and generation of GD3/GD2‐expressing lines from the human osteosarcoma HOS cell line. The expression of gangliosides was analyzed by flow cytometry. (A) Results of GD3 and GD2 expression. (B) Flow cytometry of GD3/GD2 expression on two controls (V1, V15) and two GD3 synthase–cDNA transfectant cells (G3, G19) was carried out with mAb R24, mAb 220‐51, and FITC‐labeled secondary antibody. Expression of GD1b and GT1b, located downstream of GD3 and GD2, was also analyzed by mAb 370 and mAb 549, respectively.
Generation of GD3/GD2‐expressing lines from HOS
The HOS cells were transfected by an expression vector of GD3 synthase cDNA, and resulted in the establishment of GD3/GD2+ transfectant cells, G3 and G19. As shown in Figure 1(B), G3 and G19 showed definite expression of GD3/GD2, whereas transfectants of the vector alone, V1 and V15, showed no GD3/GD2 expression. The expression of GD1b and GT1b, located downstream of GD3 and GD2, was not detected in any of these cell lines.
Effects of GD3/GD2 expression on cell proliferation, invasion, and motility
As shown in Figure 2(A), the proliferation of the GD3/GD2+ transfectant cells and the control cells showed no significant difference in MTT assay. Invasion activity as analyzed by Boyden chamber, with serum in the lower chamber, showed marked increase in the GD3/GD2+ transfectant cells compared with the control cells (Fig. 2B). To analyze the 2‐D motility of the cells, wound healing scratch assay was carried out. GD3/GD2+ transfectant cells showed significantly higher motility than the control cells (Fig. 2C). The sizes newly occupied by these transfectants were 2–2.5‐times larger than those of the control cells at 24 h after scratching. The time course of cell motility is presented in Figure 2(D).
Figure 2.
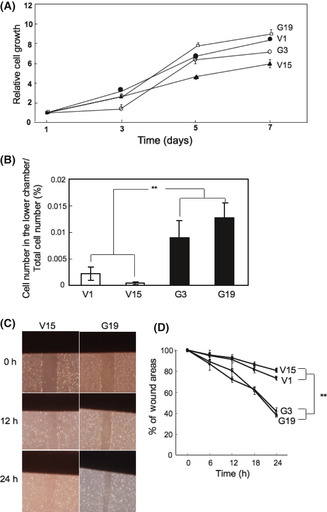
Expression of GD3/GD2 resulted in increased invasion and motility. (A) Cells (4 × 10³) were seeded in 96‐well plates. An MTT assay was carried out. (B) Invasion assay was carried out with a Boyden chamber. **P < 0.01. (C) To analyze motility of cells, wound healing scratch assay was carried out by taking photomicrographs of the scratched regions of the individual cells at the time points indicated. (D) Results of the motility assay. Wound areas are presented as a percentage of the initial wound size (100%). The time course of the wound areas is shown. Mean values ± SD (n = 12) were plotted for individual points. **P < 0.01.
Tyrosine phosphorylation of p130, p125, and p68 after FCS treatment in transfectant cells
When cells were treated with FCS, three bands appeared with increasing intensities from 5 min and reached a peak at 15 min, then gradually decreased up to 60 min after stimulation. The intensities of three tyrosine‐phosphorylated proteins were much stronger in GD3/GD2+ transfectant cells than in the controls, and their molecular masses were 130, 125, and 68 kDa (Fig. 3A,B). In particular, bands at 68 kDa were much stronger in the GD3/GD2+ cells than in the controls.
Figure 3.
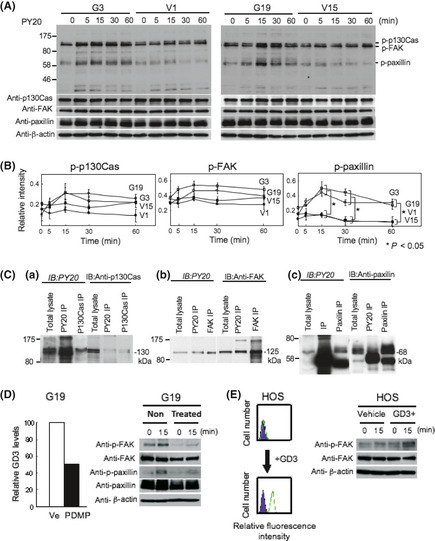
Tyrosine phosphorylation of proteins after FCS treatment in GD3/GD2+ transfectant cells. (A) To analyze proteins involved in the increased invasion and motility of GD3/GD2+ transfectant cells, immunoblotting (IB) with PY20 was carried out using lysates from cells treated with FCS. (B) Bands were quantitated by a scanner, and the relative intensities of the bands were plotted. The results shown are averages ± SD. *P < 0.05. (C) Immunoprecipitation (IP)/IB was carried out to identify the three tyrosine‐phosphorylated bands (130, 125 and 68 kDa) using combinations of PY20 and anti‐p130Cas, PY20, and anti‐FAK, and PY20 and anti‐paxillin antibodies in GD3/GD2+ transfectant cells. Immunoprecipitates with PY20 (PY20 IP) and those with anti‐p130Cas (p130Cas IP), together with total lysates, were immunoblotted using PY20 (a, left) or anti‐p130Cas (a, right). Immunoprecipitates with PY20, anti‐FAK, or anti‐paxillin antibody were immunoblotted as carried out for p130Cas. (D) Effects of suppression of glycolipid synthesis on phosphorylation of FAK and paxillin were examined using d‐threo‐1‐phenyl‐2‐decanoylamino‐3‐morpholino‐1‐propanol (PDMP; 20 μM). After treatment of G19 with PDMP, reduced expression of GD3 was confirmed by flow cytometry. Immunoblotting was carried out with lysates from cells treated with FCS after PDMP treatment using anti‐pFAK and anti‐p‐paxillin antibodies. (E) Effects of uptake of exogenous GD3 in human osteosarcoma cells on FAK phosphorylation were examined. After confirmation of GD3 expression, IB was carried out with lysates from cells treated with FCS after addition of GD3 using anti‐pFAK antibody.
Identification of p130, p125, and p68
The three tyrosine‐phosphorylated bands (130, 125, and 68 kDa) were suspected to be p130Cas, FAK, and paxillin, respectively, based on their migration rates. To clarify this point, IP and sequential IB were carried out. In the IB with PY20, both the immunoprecipitate with PY20 and that with anti‐p130Cas, as well as total lysate, showed bands at similar levels (Fig. 3C‐a). However, in IB with anti‐p130Cas, p130Cas bands precipitated with anti‐p130Cas as well as total lysate appeared at a fast‐migrating site compared with a band precipitated with PY20. These results indicate that the 130 kDa band was p130Cas, and that a small portion of p130Cas was tyrosine‐phosphorylated. The identification of the 125 kDa band as FAK was achieved as p130Cas (Fig. 3C‐b). These results also indicated that a small portion of FAK was tyrosine‐phosphorylated. The identification of the 68‐kDa band as paxillin was also achieved as p130Cas and FAK (Fig. 3C‐c), and the results also indicated that just a small portion of paxillin was tyrosine‐phosphorylated.
Increased tyrosine phosphorylation is dependent on GD3 synthase products
To examine whether increased phosphorylation of signaling molecules is due to the direct effects of neo‐synthesized glycolipids, PDPM treatment, which is a Glc‐Cer synthase inhibitor, was carried out in G19, showing decreased (~50%) GD3 and GD2 expression levels, and reduced phosphorylated levels of FAK and paxillin after FCS stimulation (Fig. 3D). Moreover, GD3‐incorporated HOS cells showed a high level of GD3, and increased phosphorylation levels of FAK after FCS stimulation (Fig. 3E), suggesting its direct effects.
Knockdown of p130Cas, FAK, and paxillin
To analyze the involvement of p130Cas, FAK, and paxillin in cell invasion and motility, we used siRNAs. We used IB to examine the ability of siRNAs to downregulate p130Cas, FAK, or paxillin proteins in G19. Control siRNA showed no effect on the levels of these molecules. More than 80% of target molecule bands in IB were decreased by individual siRNAs (Fig. 4). As shown in Figure 4(A), after knockdown of paxillin, tyrosine‐phosphorylation levels of paxillin itself were suppressed, although tyrosine phosphorylation levels of p130Cas and FAK were not affected. After knockdown of p130Cas, tyrosine phosphorylation levels of p130Cas and FAK were definitely suppressed, although tyrosine phosphorylation of paxillin was minimally affected (Fig. 4B). Finally, knockdown of FAK resulted in the suppression of tyrosine phosphorylation levels of p130Cas and paxillin as well as FAK (Fig. 4D). The predicted order of these molecules in the signaling pathway is shown in Figure 4(D).
Figure 4.
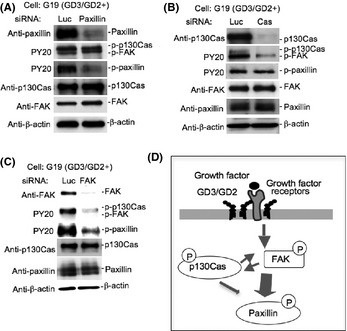
Effects of the knockdown of p130Cas, FAK, and paxillin. (A–C) GD3/GD2+ transfectant cells and vector control cells were transfected with anti‐p130Cas, FAK, or paxillin siRNAs. The effects of the knockdown of paxillin (A), p130Cas (B) or FAK (C) on the phosphorylation levels of paxillin, p130Cas, and FAK in GD3/GD2+ cells were analyzed by immunoblotting. (D) Summary of the signaling pathway enhanced by the expression of GD3/GD2 was shown.
Involvement of paxillin, p130Cas, and FAK in enhanced malignant properties of osteosarcoma cells under GD3/GD2 expression
To investigate the functional roles of paxillin, p130Cas, and FAK in the malignant properties of osteosarcoma cells, invasion and motility activities were analyzed under the same knockdown conditions as described above (Fig. 5). As shown in Figure 5(A), a marked reduction in invasion activity was found by siRNAs towards any target molecules in GD3/GD2+ cells (G3, G19), although GD3/GD2− control cells (V1, V15) showed no significant reduction. In particular, anti‐paxillin siRNA caused marked reduction in the invasion activity of GD3/GD2+ cells. In the wound healing scratch assay, GD3/GD2+ cells (G19) treated with control siRNA showed significantly higher motility than knockdown cells (G19) with anti‐paxillin, anti‐p130Cas, or anti‐FAK siRNAs (Fig. 5B).
Figure 5.
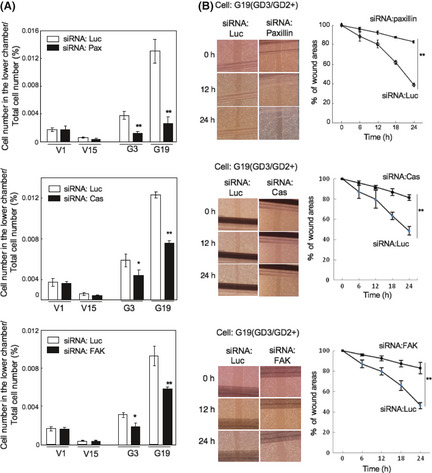
Roles of p130Cas, FAK, and paxillin in GD3/GD2+ osteosarcoma cells examined by knockdown. (A) Results of invasion assay. (B) Results of cell scratching wound healing assay. Average values ± SD (n = 12) are presented. *P < 0.05; **P < 0.01.
Dissection of expression and roles of GD3 and GD2
From cells transfected by an expression vector of GD3 synthase cDNA, we then established single expressant cell lines, that is, GD3+/GD2− (G14) and GD3−/GD2+ transfectant cells (G8). Phenotypes were then compared using four groups of cell type: GD3−/GD2+ (G8); GD3+/GD2− (G14); GD3+/GD2+ (G19); and GD3−/GD2− (V15). GD3 and GD2 expression was confirmed in G8 and G14 (Fig. 6A). Invasion assay revealed markedly increased invasion in the transfectant cells, particularly in GD3/GD2+ cells under the conditions with serum in the lower chamber (Fig. 6B). In the wound healing scratch assay, the GD3/GD2+ cells (G19) showed significantly higher motility than other clones, whereas other transfectant cells expressing either GD3 or GD2 also showed significantly higher motility than double negative cells (Fig. 6C).
Figure 6.
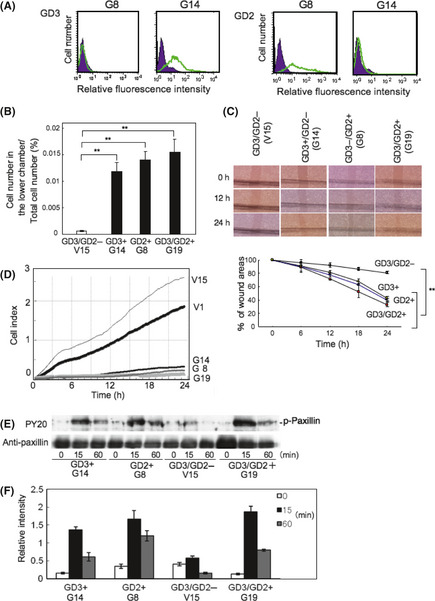
Roles of individual gangliosides GD3 and GD2 in osteosarcomas. (A) GD3+/GD2− transfectant cells (G14) and GD3−/GD2+ transfectant cells (G8) were established from cells transfected by GD3 synthase cDNA. (B,C) Invasion and motility activities were examined using G14 (GD3+), G8 (GD2+), G19 (GD3/GD2+), and V15 (GD3/GD2−). (D) Intensity of adhesion and spreading in G19, G8, G14, V1, and V15 was analyzed by real‐time cell electronic sensing. V1 is another GD3/GD2− line. (E) Tyrosine phosphorylation of paxillin in four kinds of transfectant cells using PY20. (F) Relative intensities of phosphorylation bands of paxillin measured using NIH Image 1.61. **P < 0.01.
The intensity of adhesion and spreading of transfectant cells (G19, G8, and G14) and control cells (V1 and V15) were analyzed by the RT‐CES system (Fig. 6D). This system enabled us to observe cell adhesion in real time. Consequently, GD3/GD2− cells (V1 and V15) adhered more strongly than the transfectant cells. We analyzed tyrosine phosphorylation of proteins in these cells during adhesion. After the incubation of cells for 0, 15, or 60 min under serum‐free conditions at 37°C, cells were lysed and the lysates were used for IB using PY20 (Fig. 6E). The phosphorylation levels of paxillin in transfectant cells were higher than those of control cells during adhesion for 15 or 60 min. The intensities of tyrosine‐phosphorylated bands in GD2+ cells were stronger than GD3+ cells. GD3/GD2+ cells showed the strongest intensities in tyrosine phosphorylation bands among four cell lines. These results were shown in Figure 6(F). Similar phosphorylation patterns of paxillin were observed after FCS treatment (Fig. S2).
Expression and functions of Src family kinases in malignant properties of osteosarcoma cells
Results of real‐time RT‐PCR and IB for individual Src family kinases showed that the expression level of Lyn was fairly high, whereas those of Src, Yes, Fyn, and Fgr were low (Fig. 7A–C). Expression of Hck, Lck, and Blk were not detected. Involvement of Lyn in invasion and motility was analyzed by knockdown with siRNAs of Lyn (Fig. 7D). After the transfection of siRNAs into GD3/GD2+ transfectant cells, invasion and motility activities were analyzed (Fig. 7E,F). The invasion activities were markedly reduced after knockdown of Lyn in GD3/GD2+ cells, whereas no change was found in GD3/GD2− cells. Knockdown of Lyn in GD3/GD2+ cells also resulted in a marked reduction in motility compared to control cells.
Figure 7.
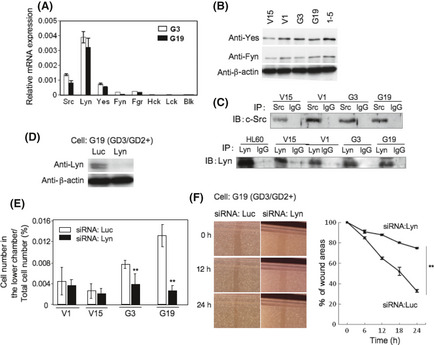
To examine the expression of Src family kinases in osteosarcoma cells, real‐time RT‐PCR (A) and immunoblotting (IB) (B, C) were used. Real‐time RT‐PCR was carried out with Src family kinase genes (Src, Lyn, Yes, Fyn, Fgr, Hck, Lck, and Blk), and IB for Src family kinases was carried out using individual antibodies (Src, Lyn, Yes, and Fyn). HL‐60, a promyelocytic leukemia cell line, was used as a positive control for Lyn. Melanoma GD3+ cell line, 1–5, was used as a positive control for Yes and Fyn. IP, immunoprecipitant. (D) Roles of Src family kinases were examined by knockdown using siRNAs. An example of anti‐Lyn siRNA in G19 cells is shown. (E,F) After the transfection of individual siRNAs into a GD3/GD2+ transfectant cell and a vector control, invasion and motility activity were analyzed with the Boyden chamber invasion assay (E) and wound healing scratch assay (F), respectively. The results shown are averages ± SD. **P < 0.01.
Lyn is located in a different pathway to FAK–paxillin
As shown in Figure 8, after knockdown of Lyn, phosphorylation levels of paxillin were partially suppressed, whereas phosphorylation levels of p130Cas or FAK, as well as total amounts of paxillin, p130Cas, or FAK, were not suppressed. These results indicated that Lyn was located in a different pathway from FAK–paxillin (Fig. 8A). Furthermore, only paxillin was coprecipitated with Lyn, indicating that Lyn binds to paxillin (Fig. 8B).
Figure 8.
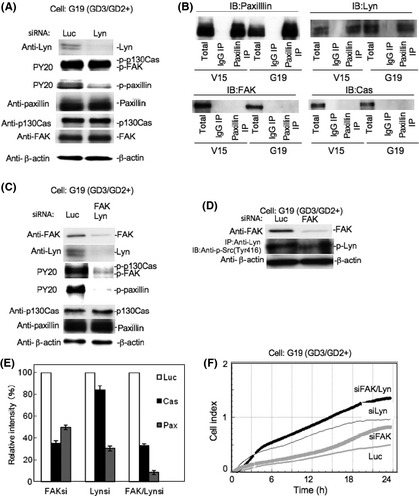
Signaling pathway leading to the activation of paxillin. (A) Effects of the knockdown of Lyn on the phosphorylation levels of p130Cas, FAK, and paxillin in GD3/GD2+ and control cells were analyzed by immunoblotting. (B) Immunoprecipitation (IP)/immunoblotting (IB) was carried out to examine the co‐immunoprecipitation of FAK, p130Cas (Cas), or Lyn with paxillin (Pax) using anti‐paxillin and individual antibodies (Lyn, FAK, and p130Cas) in vector control cells and GD3/GD2+ transfectant cells. (C) Effects of the double knockdown of Lyn and FAK on the phosphorylation levels of p130Cas, FAK, and paxillin in GD3/GD2+ cells were analyzed by IB. (D) Effects of the knockdown of FAK on the phosphorylation levels of Lyn were examined in G19. (E) Relative intensity of bands in (A,C) were measured using NIH Image 1.61. The results shown are averages ± SD. **P < 0.01. (F) Intensities of adhesion and spreading of GD3/GD2+ cells treated with anti‐Lyn/FAK, or anti‐Lyn or anti‐FAK siRNAs against Lyn and FAK, were analyzed by real‐time cell electronic sensing.
To clarify the position of Lyn and FAK in the signaling pathway for activation of paxillin, simultaneous knockdown of both molecules was carried out (Fig. 8C). After double knockdown of Lyn and FAK, the phosphorylation level of paxillin was suppressed more strongly than knockdown of either molecule. Phosphorylation levels of p130Cas and FAK were also strongly suppressed.
In turn, the effects of the knockdown of FAK on the phosphorylation levels of Lyn were examined in GD3/GD2+ cells. The phosphorylation level of Lyn at Tyr‐416 was not suppressed (Fig. 8D). To clarify the effects of gene silencing on the activation levels of individual molecules, the relative intensity of bands in Figure 8(A,C) and Figure 4(C) were measured using NIH Image 1.61 and compared (Fig. 8E). These results suggested that paxillin activation was dependent on both FAK and Lyn almost independently. The intensities of adhesion and spreading of GD3/GD2+ cells with double knockdown of Lyn/FAK, or either Lyn or FAK, were analyzed by the RT‐CES system. The strongest cell index was observed in the cells treated by anti‐Lyn/FAK siRNAs. Knockdown of either Lyn or FAK resulted in stronger adhesion/spreading than the control siRNA sample. The proposed signaling pathway is summarized in Figure 9.
Figure 9.
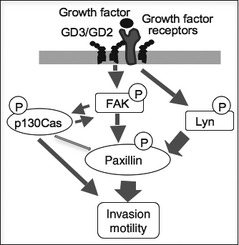
Summary of signaling pathways enhanced under GD3/GD2 expression.
Discussion
It is well known that glycosylation patterns in the complex carbohydrates expressed on the surface membrane of cancer cells are different from those in normal tissues and cells.31 There have been a number of reports on the cancer‐associated carbohydrate antigens, and some of them have been used as cancer markers in diagnosis or as targets of immunotherapy.15 However, the biological implications of these cancer‐associated carbohydrate antigens, except for selectin ligands such as sialyl Lewis x and sialyl Lewis a,32 in malignant properties have not been well demonstrated.
As for glycosphingolipids, there has been an increasing number of reports on the roles of cancer‐associated glycolipid antigens in recent years. In particular, disialyl gangliosides have been reported to enhance the malignant properties of various cancers, for example, GD3 in melanoma cells,26, 29 GD2 in breast cancer cells,33 and GD2 in small‐cell lung cancers.13 In contrast, the roles of branched disialyl structures such as disialyl Lewis a34 and disialyl galactosylgloboside35, 36 seem to be controversial. Therefore, tandem repeats of sialic acids with α2,8‐linkage might be a crucial structure for the generation of enhancing effects on cancer properties. The direct effects of glycolipids on osteosarcoma phenotypes were verified using PDMP and GD3 incorporation as shown in Figure 3(D,E).
In turn, monosialyl glycolipids have been shown to generally play suppressive roles in the cell proliferation, migration/motility, invasion, and metastasis of various cancers. For example, GM3 versus epidermal growth factor/epidermal growth factor receptor signals,37 GM1 versus cell growth in Swiss3T3 cells,38 cell growth and migration in SK‐MEL‐37,28 or cancer metastasis in murine Lewis lung cancer39 have been well studied. Not only those signals involved in cell proliferation and invasion are suppressed by monosialyl gangliosides, those involved cell differentiation or hormone effects are also affected, for example, overexpression of GM1 suppressed differentiation of PC12 cells with NGF,40 and that of GM3 suppressed signals through insulin receptors.41
The mechanisms through which disialyl gangliosides enhance malignant properties are not clear. However, the roles of gangliosides in membrane microdomains such as GEM/rafts have been shown in many cases. Generally, high expression of disialyl gangliosides caused localization of integrins, FAK,29 Src family kinases,30 or growth/differentiation factor receptors40 in GEM/rafts, resulting in the stronger activation of signaling molecules. Thus, carbohydrate structures on glycosphingolipids affect the physicochemical nature of the microdomains, and determine the intracellular localization of various signaling proteins. Ganglioside changes also altered the distribution of glycolipids with different ceramide structures inside and outside of GEM/rafts.28 Therefore, the chemical structure of glycolipids might be a crucial factor in adjusting the microenvironments on the cell surface.
In osteosarcomas, no definite findings about the functions of glycolipid antigens have been reported. Although the high expression of GD2/GD3 was detected, no significant changes in the expression levels of genes involved in the growth/differentiation of osteoblasts were found in the transfectant cells (Fig. S3). Roughly speaking, similar functions of disialyl gangliosides to those in malignant melanomas were indicated.26, 27, 33, 41 However, the roles of paxillin were more prominent in osteosarcomas than in melanomas, particularly in cell invasion and/or motility. These results correspond well with the results by Azuma's research group, in which the importance of tyrosine phosphorylation of paxillin in the metastatic potential of human osteosarcomas was shown.42
Moreover, the effects of disialyl gangliosides on cell adhesion were quite opposite to those in melanomas, in that GD2/GD3 expression suppressed osteosarcoma cell adhesion to the ECM, whereas GD3 expression enhanced melanoma cell adhesion to the ECM.29 In particular, the results shown in Figure 6(D,E) reveal some very intriguing findings, that intensities in cell adhesion were not necessarily reflected in the activation levels of paxillin during adhesion. Rather, they showed an opposite correlation, in that the stronger tyrosine phosphorylation paxillin underwent, the less adhesion was observed in RT‐CES. These findings were deepened by gene silencing of FAK and/or Lyn, as shown in Figure 8. Here, the reduction in the tyrosine phosphorylation of paxillin apparently resulted in increased adhesion and spreading. Consequently, activation of paxillin transduced through FAK/Lyn phosphorylation leads to increased cell invasion and motility, which are inversely expressed in the cell index of RT‐CES. This fact contrasted strongly with findings in melanomas, probably due to the differences of the main target molecules that underwent enhancement with gangliosides. This might be caused by the differences between GD3 and GD2 as the mainly expressed gangliosides in melanoma and osteosarcoma, respectively. Heterogeneity of GEM/rafts43, 44 depending on existing gangliosides, and the differential effects of individual gangliosides on cancer properties are now under investigation.
It is important to consider whether cancer tissues of osteosarcomas in patients express GD2/GD3 when clinically applying these results to the treatment of osteosarcoma patients. Only partial analyses of ganglioside expression have been carried out to date; systematic analysis of patients' samples are now ongoing.
Disclosure Statement
The authors have no conflicts of interest.
Abbreviations
- GEM
glycolipid‐enriched microdomains
- HOS
human osteosarcoma
- IB
immoblotting
- IP
immunoprecipitation
- PDMP
d‐threo‐1‐phenyl‐2‐decanoylamino‐3‐morpholino‐1‐propanoll
- RT‐CES
real‐time cell electronic sensing
Supporting information
Data S1. Nucleotide sequences for knockdown. Data S2. Primer sequences for RT‐PCR. Data S3. Real‐time RT‐PCR. Fig. S1. Expression of various gangliosides in osteosarcoma cell lines. Fig. S2. Tyrosine phosphorylation of paxillin in individual cells by FCS treatment. Fig. S3. Expression levels of various genes involved in the growth/differentiation in osteoblasts.
Acknowledgments
We thank Ms. T. Mizuno and Y. Nakayasu for technical assistance. This study was Supported by a Grant‐in Aid for Scientific Research on Priority Areas from the Ministry of Education, Culture, Sports, Science and Technology of Japan (MEXT). This study is also partly supported by a grant of the global COE Project from MEXT, and by a grant of the COE Project for Private Universities from MEXT.
(Cancer Sci, 2012; 103: 1656–1664)
References
- 1. Sweetnam R. Osteosarcoma. Br J Hosp Med 1982; 28: 112–21. [PubMed] [Google Scholar]
- 2. Regezi JA, Zarbo RJ, McClatchey KD, Courtney RM, Crissman JD. Osteosarcomas and chondrosarcoma of the jaws: immunohistochemical correlations. Oral Surg Oral Med Oral Pathol 1987; 64: 302–7. [DOI] [PubMed] [Google Scholar]
- 3. August M, Magennis P, Dewitt D. Osteogenic sarcoma of the jaws: factors influencing prognosis. Int J Oral Maxillofac Surg 1997; 26: 198–204. [DOI] [PubMed] [Google Scholar]
- 4. Patel SG, Meyers P, Huvos AG et al Improved outcomes in patients with osteogenic sarcoma of the head and neck. Cancer 2002; 95: 1495–503. [DOI] [PubMed] [Google Scholar]
- 5. Russ JE, Jesse RH. Management of osteosarcoma of the maxilla and mandible. Am J Surg 1980; 140: 572–6. [DOI] [PubMed] [Google Scholar]
- 6. Garrington GE, Scofield HH, Cornyn J, Hooker SP. Osteosarcoma of the jaws. Analysis of 56 cases. Cancer 1967; 20: 377–91. [DOI] [PubMed] [Google Scholar]
- 7. Clark JL, Unni KK, Dahlin DC, Devine KD. Osteosarcoma of the jaw. Cancer 1983; 51: 2311–6. [DOI] [PubMed] [Google Scholar]
- 8. Wiegandt H. Gangliosides In: Wiegandt H, eds. Glycolipids. New York: Elsevier, 1985; 199–260. [Google Scholar]
- 9. Hakomori S, Igarashi Y. Gangliosides and glycosphingolipids as modulators of cell growth, adhesion, and transmenbrane signaling. Adv Lipid Res 1993; 25: 147–62. [PubMed] [Google Scholar]
- 10. Furukawa K, Lloyd KO. Gangliosides in melanoma In:Ferrone S, ed. HumanMelanoma: From Basic Research to Clinical Application. Heidelberg: Springer, 1990; 15–30. [Google Scholar]
- 11. Cheung NK, Saarinen UM, Neely JE, Landmeier B, Donovan D, Coccia PF. Monoclonal antibodies to a glycolipid antigen on human neuroblastoma cells. Cancer Res 1985; 45: 2642–9. [PubMed] [Google Scholar]
- 12. Okada M, Furukawa K, Yamashiro S et al High expression of ganglioside GD3 synthase gene in adult T cell leukemia cells unrelated to the gene expression of human T lymphotropic virus type I. Cancer Res 1996; 56: 2844–8. [PubMed] [Google Scholar]
- 13. Yoshida S, Fukumoto S, Kawaguchi H, Sato S, Ueda D, Furukawa K. Ganglioside GD2 in small cell lung cancer cell lines: enhancement of cell proliferation and mediation of apoptosis. Cancer Res 2001; 61: 4244–52. [PubMed] [Google Scholar]
- 14. Yamada T, Bando H, Takeuchi S et al Genetically engineered humanized anti‐ganglioside GM2 antibody against multiple organ metastasisproduced by GM2‐expressing small‐cell lung cancer cells. Cancer Sci 2011; 102: 2157–63. [DOI] [PubMed] [Google Scholar]
- 15. Houghton AN, Mintzer D, Cordon‐Cardo C et al Mouse monoclonal IgG3 antibody detecting GD3 ganglioside: a phase I trial in patients with malignant melanoma. Proc Natl Acad Sci USA 1985; 82: 1242–6. [DOI] [PMC free article] [PubMed] [Google Scholar]
- 16. Modak S, Cheung NK. Disialoganglioside directed immunotherapy of neuroblastoma. Cancer Invest 2007; 25: 67–77. [DOI] [PubMed] [Google Scholar]
- 17. Forero A, Shah J, Carlisle R et al A phase I study of an anti‐GD3 monoclonal antibody, KW‐2871, in patients with metastatic melanoma. Cancer Biother Radiopharm 2006; 21: 561–8. [DOI] [PubMed] [Google Scholar]
- 18. Mujoo K, Cheresh DA, Yang HM, Reisfeld RA. Disialoganglioside GD2 on human neuroblastoma cells: target antigen for monoclonal antibody‐mediated cytolysis and suppression of tumor growth. Cancer Res 1987; 47: 1098–104. [PubMed] [Google Scholar]
- 19. Fukuda M, Horibe K, Furukawa K. Enhancement of in vitro and in vivo antitumor activity of anti‐GD2 monoclonal antibody 220–51 against human neuroblastoma by granulocyte‐macrophage colony‐stimulating factor and granulocyte colony‐stimulating factor. Int J Mol Med 1998; 2: 471–5. [DOI] [PubMed] [Google Scholar]
- 20. Zhang H, Zhang S, Cheung NK, Ragupathi G, Livingston PO. Antibodies against GD2 ganglioside can eradicate syngeneic cancer micrometastases. Cancer Res 1998; 58: 2844–9. [PubMed] [Google Scholar]
- 21. Kushner BH, Kramer K, Modak S, Cheung NK. Successful multifold dose escalation of anti‐GD2 monoclonal antibody 3F8 in patients with neuroblastoma: a phase Istudy. J Clin Oncol 2011; 9: 1168–74. [DOI] [PMC free article] [PubMed] [Google Scholar]
- 22. Basak S, Birebent B, Purev E et al Induction of cellular immunity by anti‐idiotypic antibodies mimicking GD2 ganglioside. Cancer Immunol Immunother 2003; 52: 145–54. [DOI] [PMC free article] [PubMed] [Google Scholar]
- 23. Louis CU, Savoldo B, Dotti G et al Antitumor activity and long‐term fate of chimeric antigen receptor‐positive T cells in patients with neuroblastoma. Blood 2011; 118: 6050–6. [DOI] [PMC free article] [PubMed] [Google Scholar]
- 24. Furukawa K, Akagi T, Nagata Y et al GD2 ganglioside on human T‐lymphotropic virus type I‐infected T cells: possible activation of β‐1,4‐N‐acetylgalactosaminyltransferase gene by p40tax. Proc Natl Acad Sci USA 1993; 90: 1972–6. [DOI] [PMC free article] [PubMed] [Google Scholar]
- 25. Heiner JP, Miraldi F, Kallick S et al Localization of GD2‐specific monoclonal antibody 3F8 in human osteosarcoma. Cancer Res 1987; 47: 5377–81. [PubMed] [Google Scholar]
- 26. Hamamura K, Furukawa K, Hayashi T et al Ganglioside GD3 promotes cell growth and invasion through p130Cas and paxillin in malignant melanoma cells. Proc Natl Acad Sci USA 2005; 102: 11041–6. [DOI] [PMC free article] [PubMed] [Google Scholar]
- 27. Hamamura K, Tsuji M, Nakashima H et al Focal adhesion kinase as well as p130Cas and paxillin is crucially involved in the enhanced malignant properties under expression of ganglioside GD3 in melanoma cells. Biochim Biophys Acta 2008; 1780: 513–9. [DOI] [PubMed] [Google Scholar]
- 28. Dong Y, Ikeda K, Hamamura K et al GM1/GD1b/GA1 synthase expression results in the reduced cancer phenotypes with modulation of composition and raft‐localization of gangliosides in a melanoma cell line. Cancer Sci 2010; 101: 2039–47. [DOI] [PMC free article] [PubMed] [Google Scholar]
- 29. Ohkawa Y, Miyazaki S, Hamamura H et al Ganglioside GD3 enhances adhesion signals and augments malignant properties of melanoma cells by recruiting integrins to glycolipid‐enriched microdomains. J Biol Chem 2010; 285: 27213–23. [DOI] [PMC free article] [PubMed] [Google Scholar]
- 30. Hamamura K, Tsuji M, Hotta H et al Functional activation of Src family kinase Yes is essential for the enhanced malignant properties of human melanoma cells expressing ganglioside GD3. J Biol Chem 2011; 286: 18526–37. [DOI] [PMC free article] [PubMed] [Google Scholar]
- 31. Hakomori S. Tumor‐associated glycolipid antigens, their metabolism and organization. Chem Phys Lipids 1986; 42: 209–33. [DOI] [PubMed] [Google Scholar]
- 32. Kannagi R. Carbohydrate‐mediated cell adhesion involved in hematogenous metastasis of cancer. Glycoconj J 1997; 14: 577–84. [DOI] [PubMed] [Google Scholar]
- 33. Cazet A, Lefebvre J, Adriaenssens E et al GD synthase expression enhances proliferation and tumor growth of MDA‐MB‐231 breast cancer cells through c‐Met activation. Mol Cancer Res 2010; 8: 1526–35. [DOI] [PubMed] [Google Scholar]
- 34. Tsuchida A, Okajima T, Furukawa K et al Synthesis of disialyl Lewis a structure in colon cancer cell lines by a sialyltransferase ST6GalNAc VI responsible for the synthesis of a‐series gangliosides. J Biol Chem 2003; 278: 22787–94. [DOI] [PubMed] [Google Scholar]
- 35. Satoh M, Nejad FM, Ohtani H et al Association of renal cell carcinoma antigen, disialylgalactosylgloboside, with c‐Src and Rho A in clustered domains at the surface membrane. Int J Oncol 2000; 16: 529–36. [DOI] [PubMed] [Google Scholar]
- 36. Senda M, Ito A, Tsuchida A et al Identification and expression of a sialyltransferase responsible for the synthesis of disialylgalactosylgloboside in normal and malignant kidney cells: down‐regulation of ST6GalNAc VI in renal cancers. Biochem J 2007; 402: 459–70. [DOI] [PMC free article] [PubMed] [Google Scholar]
- 37. Haga Y, Hatanaka K, Hakomori SI. Effect of lipid mimetics of GM3 and lyso‐GM3 dimer on EGF receptor tyrosine kinase and EGF‐induced signal transduction. Biochim Biophys Acta 2008; 1780: 393–404. [DOI] [PMC free article] [PubMed] [Google Scholar]
- 38. Mitsuda T, Furukawa K, Fukumoto S, Miyazaki H, Urano T, Furukawa K. Over‐expression of ganglioside GM1 results in the dispersion of platelet derived growth factor receptor from glycolipid‐enriched microdomains and in the suppression of cell growth signals. J Biol Chem 2002; 277: 11239–46. [DOI] [PubMed] [Google Scholar]
- 39. Zhang Q, Furukawa K, Chen H‐H, Sakakibara T, Urano T, Furukawa K. Metastatic potential of mouse Lewis lung cancer cells is regulated via ganglioside GM1 by modulating the matrix metalloprotease‐9 localization in lipid rafts. J Biol Chem 2006; 281: 18145–55. [DOI] [PubMed] [Google Scholar]
- 40. Nishio M, Fukumoto S, Furukawa K et al Over‐expressed GM1 suppresses NGF signals by modulating the intra‐cellular localization of NGF receptors and membrane fluidity in PC12 cells. J Biol Chem 2004; 279: 33368–78. [DOI] [PubMed] [Google Scholar]
- 41. Inokuchi J. Physiopathological function of hematoside (GM3 ganglioside). Proc Jpn Acad Ser B Phys Biol Sci 2011; 87: 179–98. [DOI] [PMC free article] [PubMed] [Google Scholar]
- 42. Azuma K, Tanaka M, Uekita T et al Tyrosine phos‐phorylation of paxillin affects the metastatic potential of human osteosarcoma. Oncogene 2005; 24: 4754–64. [DOI] [PubMed] [Google Scholar]
- 43. Mishra S, Joshi PG. Lipid raft heterogeneity: an enigma. J Neurochem 2007; 103(Suppl 1): 135–42. [DOI] [PubMed] [Google Scholar]
- 44. Pike LJ. Lipid rafts: heterogeneity on the high seas. Biochem J 2004; 378: 281–92. [DOI] [PMC free article] [PubMed] [Google Scholar]
Associated Data
This section collects any data citations, data availability statements, or supplementary materials included in this article.
Supplementary Materials
Data S1. Nucleotide sequences for knockdown. Data S2. Primer sequences for RT‐PCR. Data S3. Real‐time RT‐PCR. Fig. S1. Expression of various gangliosides in osteosarcoma cell lines. Fig. S2. Tyrosine phosphorylation of paxillin in individual cells by FCS treatment. Fig. S3. Expression levels of various genes involved in the growth/differentiation in osteoblasts.


