Abstract
Cellular senescence prevents the aberrant proliferation of damaged cells. The transcription factor Bach1 binds to p53 to repress cellular senescence, but it is still unclear how the Bach1–p53 interaction is regulated. We found that the Bach1–p53 interaction was inhibited by oncogenic Ras, bleomycin, and hydrogen peroxide. Proteomics analysis of Bach1 complex revealed its interaction with p19ARF, a tumor suppressor that competitively inhibited the Bach1–p53 interaction when overexpressed within cells. Reduction of MDM2 expression in wild‐type murine embryonic fibroblasts (MEFs) did not result in slower proliferation, showing that Bach1 plays a role in keeping the proliferation of MEFs independent of MDM2. Consistent with this interpretation, expression of p21 was highly induced in MEFs when both Bach1 and MDM2 were abrogated. The level of Bach1 protein was reduced on knockdown of p53. These results suggest that p53 activation involves its dissociation from Bach1, achieved in part by the competitive binding of p19ARF to Bach1. The p19ARF–Bach1 interaction constitutes a regulatory pathway of p53 in parallel with the p19ARF–MDM2 pathway. (Cancer Sci 2012; 103: 897–903)
Cellular senescence is an irreversible cell cycle arrest that plays a role as a barrier against malignant transformation.1 Cellular senescence is induced by the tumor suppressors p53 and pRb that integrate diverse signals under genotoxic and oncogenic stresses.2, 3 p53 is strictly regulated because of its potentially suicidal functions. For example, p53 possesses a very short half‐life under normal conditions due to its polyubiquitination by the E3 ubiquitin ligase MDM2 and subsequent degradation.4 p19ARF sequesters MDM2 from p53 by binding to MDM2, resulting in accumulation of p53.5, 6, 7 Additional new mechanisms of p53 regulations have been reported, including Bach1,8 CHD8,9 and Cabin110 as negative regulators. Bach1 forms a complex with p53 on chromatin, recruiting histone deacetylase 1 and thus repressing the transcriptional activator function of p53. Bach1 inhibits cellular senescence of murine embryonic fibroblasts (MEFs) under oxidative stress and oncogenic stress imposed by activated Ras.8 Thus Bach1 may potentially modulate the tumor suppressor function of p53. Bach1 represses the expression of a set of p53‐target genes that collaborate to induce senescence.11 However, the mechanism for the regulation of the Bach1–p53 interaction remains to be elucidated.
In addition to the cellular senescence, Bach1 represses the oxidative stress response.12 Bach1 binds to a cis‐regulatory Maf‐recognition element (MARE) by forming a heterodimer with the small Maf oncoproteins to repress genes for oxidative stress including heme oxygenase‐1 (HO‐1) and ferritin.12, 13, 14 As HO‐1 protects cells and tissues from oxidative stress by reducing reactive oxygen species and producing carbon monoxide (CO),15 Bach1‐deficient mice, in which HO‐1 is de‐repressed in diverse tissues and cells, are more resistant to various insults including oxidative stress.16, 17, 18, 19, 20 HO‐1 also induces arrest of cell proliferation through CO‐mediated activation of the p21–Rb pathway.21 Collectively, Bach1 connects two critical pathways of cellular senescence and the oxidative stress response. In this study, we asked how the Bach1–p53 interaction was regulated and found that the tumor suppressor p19ARF interacted with Bach1 and inhibited its interaction with p53. By examining genetic interactions among Bach1, MDM2, and p19ARF, we found that Bach1 and MDM2 were independently required for p53 suppression. These results suggest that p19ARF may activate p53 to induce senescence by relieving the Bach1‐mediated inhibition in addition to the MDM2‐mediated degradation of p53.
Materials and Methods
Isolation and culture of MEFs
Mouse embryonic fibroblasts were isolated from 14.5‐day‐old embryos of various genotypes, as previously described.8 The MEFs from single embryos were plated into a 100‐mm diameter culture dish and incubated at 37°C. Cells were cultured in 20% or 3% oxygen by subculturing in a 60‐ or 100‐mm diameter culture dish every 2–3 days, and cell number was determined at each passage.
Plasmids
The expression plasmids for FLAG‐tagged Bach1 and its derivatives have been described previously.22, 23 Plasmids pCMXp53 and pCMV‐SPORT6p19ARF were obtained from Life Technologies (Carlsbad, CA, USA). Biotin‐tagged Bach1 expression plasmid was described previously.24
Pull‐down assays
The 293T cells were transfected in 10‐cm dishes with 2 or 3 μg each of indicated plasmids by Genejuice (EMD Chemicals, Darmstadt, Germany). After 24 h, the total protein extracts were prepared and precipitated with streptavidin beads or anti‐FLAG M2 agarose beads as described previously.8 Bleomycin and hydrogen peroxide were added to the culture medium at 25 or 50 μM and at 50 or 100 μM respectively for the last 8 h.
Immunoblotting analysis
The immunoblotting analysis was carried out with the following antibodies: anti‐Bach1;8 anti‐MafK;25 anti‐tubulin (B7; Santa Cruz Biotechnology, Santa Cruz, CA, USA); anti‐p19 (ab80; Abcam, Cambridge, UK); anti‐p53 (CM5p; Leica Microsystems, Wetziar, Germany); anti‐HA (Roche Applied Science, Penzberg, Germany); and anti‐Flag (Sigma‐Aldrich, St. Louis, MO, USA). Whole‐cell extracts were prepared from wild‐type and Bach1‐deficient MEFs and the extracts were separated by SDS‐PAGE. Following SDS‐PAGE, the proteins were electrotransferred to PVDF membrane (Millipore, Billerica, MA, USA) and reacted with antibodies as previously described.8 The densities of signals were quantified with NIH Image 1.63 (http://rsb.info.nih.gov/nih-image/).
RNA extract and quantitative RT‐PCR
Total RNAs was prepared from MEFs using the Total RNA Isolation minikit (Agilent Technologies). Quantitative PCR experiments were carried out with a LightCycler (Roche) using the following primers:
p19, 5′‐GCTCTGGCTTTCGTGAACA‐3′, 5′‐TCGAATCTGCACCGTAGTTG‐3′;
MDM2, 5′‐AGACAGGAGAAAGCGATACA‐3′, 5′‐TTTCCCCTTATCGTCTGG‐3′;
Bach1, 5′‐GCCCGTATGCTTGTGTGATT‐3′, 5′‐CGTGAGAGCGAAATTATCCG‐3′;
p21, 5′‐CCTGGTGATGTCCGACCTGTT‐3′,
5′‐GGGGAATCTTCAGGCCGCTC‐3′; and β‐actin, 5′‐CGTTGACATCCGTAAAGACCTC‐3′, 5′‐AGCCACCGATCCACACAGA‐3′.
RNA interference
Stealth RNAi duplexes were designed for the target genes using the BLOCK‐iT RNAi Designer (Invitrogen). For the knockdown of the target genes, 2.0 × 10⁶ cells were transfected with 6 μL stock Stealth RNAi duplexes (20 μm) using the basic nucleofection solution for MEFs (Lonza, Koeln, Germany). Stealth RNAi Negative Control duplexes (Invitrogen) were used as negative control RNAi. The transfected cells were divided into three parts and cultured in 60‐mm diameter culture dishes. The cell number was determined at the indicated days. Sequences of the Stealth RNAi used in this study were: p19ARF RNAi, 5′‐ACAACAUGUUCACGAAAGCCAGAGC‐3′; and MDM2 RNAi, 5′‐UCUUCUGUCUCACUAAUGGAUCUCC‐3′.
Bach1 complex purification and analysis
The Bach1 complex was purified from nuclear extracts prepared from MEL cells stably expressing eBach1 and they were analyzed as described previously.8
Statistical analysis
Data was presented as mean ± SD. All the statistical analyses were done by Student's test or Welch's correction. A value of P < 0.05 was considered of significance in all tests.
Results
Inhibition of the interaction between Bach1 and p53 by genotoxic stresses
We applied biotin‐tagging pull‐down of Bach124 to examine changes in the interaction between Bach1 and p53 in response to p53 activating signals. When biotin‐tagged Bach1 was expressed in 293T cells and pulled down with streptavidin beads, endogenous p53 was also recovered (Fig. 1a). When the cells were transfected with RasV12 plasmid, the Bach1–p53 interaction was clearly inhibited (Fig. 1a). Similarly, when the cells were treated with bleomycin or hydrogen peroxide, their interaction was also inhibited (Fig. 1b,c). These results suggest that dissociation of p53 from Bach1 is induced in response to several types of genotoxic stresses, presumably leading to p53 activation.
Figure 1.
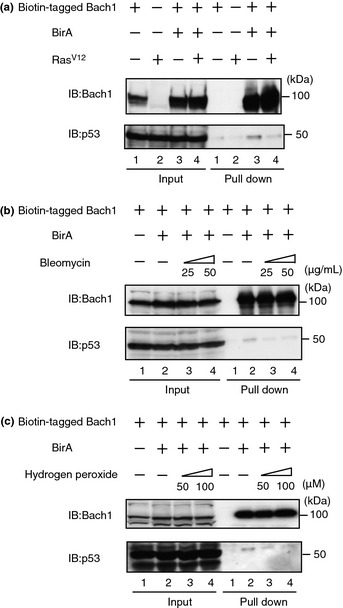
Dissociation of Bach1 and p53 in response to RasV12, DNA damage, and oxidative stress. Pull‐down assays of FLBio‐Bach1 and endogenous p53 in 293T cells in the presence of RasV12 (a), bleomycin (b), and hydrogen peroxide (c). Biotinylated Bach1 was pulled down with streptavidin beads, followed by immunoblotting (IB) analysis with the indicated antibodies.
Analysis of the Bach1 complex
We speculated that genotoxic stresses activated a factor that inhibited the interaction between Bach1 and p53. A previous report described the purification of FLAG and HA‐tagged Bach1 (eBach1) from MEL cells and characterized its associated proteins.8 Further mass spectrometry analysis of Bach1‐associated proteins identified p19ARF in the Bach1 complex (Fig. 2a), which was confirmed by Western blot analyses (Fig. 2b). When Bach1‐enriched material obtained by single anti‐FLAG affinity purification of eBach1 was size‐fractioned by a 10–35% glycerol gradient sedimentation, p19ARF was found in the relatively faster sedimenting fractions where Bach1 and p53 were also present (Fig. 2c). To investigate the relationships among p53, p19ARF, and Bach1, p53 or p19ARF was immunoprecipitated from the Bach1‐enriched material. p53 and p19ARF showed counter‐enrichment of each other while Bach1 was precipitated with each antibody. These results show that p19ARF was a component of the Bach1 complex and raised the possibility that it may be involved in the regulation of the p53–Bach1 interaction.
Figure 2.
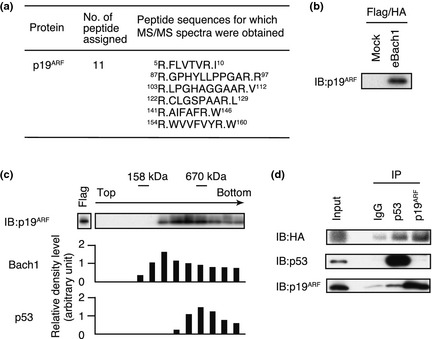
Analysis of the purified Bach1 complex. (a) The identification of p19ARF by mass spectrometry. Amino acid sequences of peptides were determined by mass spectrometry/mass spectrometry (MS/MS) analysis. (b) Flag‐ and HA‐purified Bach1 complex sample was analyzed by immunoblotting (IB) analysis using p19ARF antibody. (c) Glycerol gradient analysis of the Bach1 complex. The fractions were further analyzed by IB using p19ARF antibody. Bach1 and p53 in each fraction analyzed by IB using Bach1 or p53 antibodies were quantified by densitometry. (d) Flag‐purified Bach1 complex sample was immunoprecipitated (IP) and analyzed by IB with the indicated combinations of antibodies.
Mapping of the p19ARF‐binding region on Bach1
Bach1 possesses several functional domains including the N‐terminal BTB domain mediating homodimer formation26, 27 and the C‐terminal basic region‐leucine zipper (bZip) domain forming heterodimers with Maf proteins to bind to DNA. To examine the specificity of the Bach1–p19ARF binding, the regions of Bach1 involved in the interaction with p19ARF were mapped using various deletion FLAG‐Bach1 proteins (Fig. 3a). When overexpressed in 293T cells, the full‐length FLAG‐Bach1 was precipitated with anti‐FLAG antibody together with exogenous p19ARF (Fig. 3b). Both the N‐terminal and C‐terminal deletion fragments failed to interact with p19ARF when a region preceding the bZip domain was deleted (Fig. 3b,c), indicating that this region between amino acid residues 380 and 503 was involved in the interaction with p19ARF.
Figure 3.
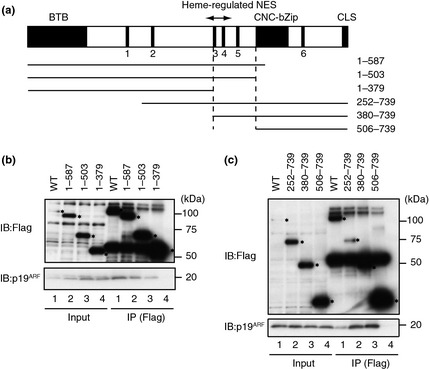
Mapping of the p19ARF‐interacting region on Bach1. (a) A schematic representation of Bach1 and its deletion derivatives. CP motifs are indicated with filled boxes and numbers. BTB domain/POZ domain, CNC homology‐basic region‐leucine zipper (bZip), and cytoplasmic localization signal (CLS) are also shown with filled boxes. Heme‐regulated nuclear export signal (NES) is shown with an arrow. The boundaries of the p19ARF‐binding region are shown by the vertical dashed lines. (b,c) Co‐immunoprecipitation assays of Bach1 and p19ARF. The 293T cells were transfected with indicated combinations of expression plasmids for FLAG‐tagged Bach1 derivatives and p19ARF, then subjected to immunoprecipitation (IP) with anti‐FLAG antibodies followed by immunoblot (IB) analysis with the p19ARF antibodies. The asterisks indicate bands of FLAG‐tagged Bach1 derivatives.
Competitive binding of p53 and p19ARF to Bach1
The above results, and the fact that Bach1 inhibits p53 function, suggested that Bach1–p19ARF interaction would regulate p53 function. To clarify the interaction among Bach1, p53, and p19ARF, pull‐down assays with biotin‐tagged Bach1 were carried out (Fig. 4a). When biotin‐tagged Bach1 was overexpressed in 293T cells, pull‐down of Bach1 with streptavidin beads brought down endogenous p53 (lane 3). Simultaneous overexpression of p19ARF clearly inhibited coprecipitation of Bach1 with p53 while p19ARF bound to Bach1 in a dose‐dependent manner (lanes 4 and 5). Furthermore, overexpressed p19ARF inhibited the coprecipitation of Bach1 with MafK.
Figure 4.
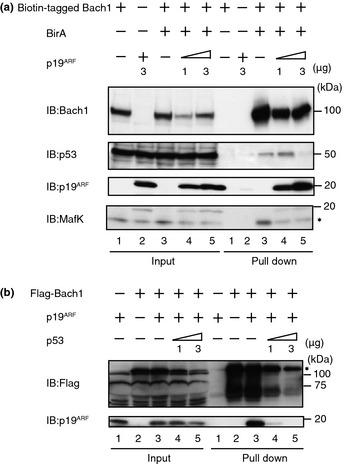
Interactions among Bach1, p53, and p19ARF. (a) 293T cells were transfected with expression plasmids for FLBio‐Bach1 and p19ARF. Biotinylated Bach1 was pulled down with streptavidin beads, followed by an immunoblotting (IB) analysis with the indicated antibodies. (b) 293T cells were transfected with FLAG‐Bach1, p19ARF, and p53. Extracts were subjected to immunoprecipitation (IP) with anti‐FLAG antibodies and were analyzed by IB. The asterisks indicate endogenous MafK or FLAG‐Bach1 bands.
To confirm the competitive binding of p19ARF and p53 to Bach1, p53 was overexpressed and its effect on the Bach1–p19ARF interaction was examined in immunoprecipitation assays (Fig. 4b). When FLAG‐Bach1 and p19ARF were expressed in 293T cells, immunoprecipitation of FLAG‐Bach1 brought down p19ARF (lane 3). An additional overexpression of p53 clearly inhibited coprecipitation of p19ARF with FLAG‐Bach1 (lanes 4 and 5). These observations suggest that p53 and p19ARF mutually inhibit their interaction with Bach1 and that p19ARF also affects the Bach1–MafK interaction.
Functions of Bach1 and MDM2 downstream of p19ARF
A key regulatory target of p19ARF, MDM2, was not present in the Bach1 complex judging from the results obtained by the mass spectrometry and Western blot analyses (data not shown). Therefore, we speculated that Bach1 might be independent of MDM2 and constitute an alternative pathway for the p19ARF‐mediated p53 activation (Fig. 5a). To explore the relationship between Bach1, MDM2, and p19ARF, reduction of the expressions of MDM2 or p19ARF was carried out in wild‐type and Bach1‐deficient MEFs using RNAi (Fig. 5b,c). Bach1‐deficient MEFs showed slower proliferation due to p53 activation, as reported previously8 (Fig. 5b, lanes 1,5). Elimination of p19ARF by knockdown in wild‐type MEFs tended to result in more vigorous proliferation than control MEFs with statistical significance (lanes 1,2). A similar effect of p19ARF elimination was also observed in Bach1‐deficient MEFs, although it was not statistically significant (lanes 4,5). Together with our previous reports showing that Bach1 inhibits p53‐driven senescence,8, 11 we suggest that p53 restricted proliferation of wild‐type and Bach1‐deficient cells under the experimental conditions and that p19ARF was involved at least in part in the p53 activation. Reducing MDM2 in wild‐type cells resulted in a mild reduction of proliferation, if any (lane 3). Because Bach1‐deficient MEFs poorly proliferated, the effect of MDM2 reduction was not clear but seemed to further inhibit proliferation (lanes 4,6). Therefore, these results are consistent with the idea that Bach1 inhibited p53 in a way independent of MDM2. This interpretation was further corroborated by changes in p21 expression (Fig. 6). mRNA levels of p21 were higher in Bach‐deficient MEFs than control wild‐type cells as reported previously.8 MDM2 knockdown resulted in higher p21 expression in both cells, but the levels appeared to be higher in the absence of Bach1 than its presence. The frequency of apoptosis after MDM2 knockdown was similar in Bach1‐deficient MEFs and wild‐type MEFs (data not shown), suggesting a specific function of Bach1 in proliferation. Taken together, our observations suggest that Bach1 and MDM2 constitute parallel pathways both required for inhibiting p53 and maintaining proliferation in MEFs.
Figure 5.
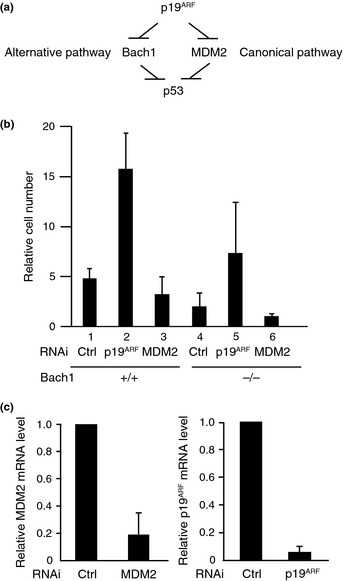
Functions of Bach1, MDM2, and p19ARF in the regulation of p53. (a) A proposed model of p19ARF–p53 pathways through MDM2 (canonical pathway) and Bach1 (alternative pathway). (b) Proliferation of pre‐senescent wild‐type or Bach1‐deficient mouse embryonic fibroblasts expressing Stealth RNAi duplexes of control (Ctrl RNAi) or MDM2 or p19 ARF is compared at day 5 as values relative to day 1. The experiments were carried out independently three times in triplicate and are expressed as means ± SD. (c) p19ARF and MDM2 mRNA levels 2 days after RNAi were determined by quantitative RT‐PCR as relative mean values ± SD compared to day 1 control RNAi.
Figure 6.
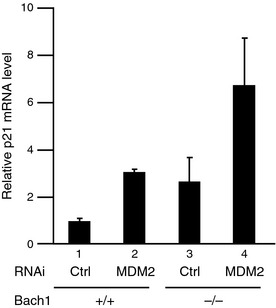
Functions of Bach1 and MDM2 in the regulation of the p21 gene. p21 mRNA levels at day 3 in pre‐senescent wild‐type or Bach1‐deficient mouse embryonic fibroblasts expressing control or MDM2 siRNAs. The experiments were carried out independently three times and the results are expressed as the mean ± SD.
Regulation of Bach1 expression
MDM2 is a transcriptional target of p53 and constitutes a negative feedback loop by promoting the degradation of p53. The inhibitory function of Bach1 on p53 suggested that the expression of Bach1 might also be regulated by p53. When p53 was reduced by knockdown, mRNA and protein levels of Bach1 decreased in MEFs under normal culture conditions (Fig. 7a,b). Next, we examined whether the expression of Bach1 was affected in response to DNA damage that activates p53. After treating cells with bleomycin, Bach1 mRNA and protein did not show appreciable change (Fig. 7c,d). Higher levels of p21 mRNA after bleomycin treatment showed the activation of p53 (Fig. 7e). Culturing cells under 20% oxygen causes oxidative stress.28 The levels of Bach1 protein decreased when MEFs were cultured under 20% oxygen but not physiological 3% oxygen (Fig. 7f,g). The levels of p21 mRNA increased under 20% oxygen (Fig. 7h). These observations suggest that normal, lower levels of p53 participate in transcriptional regulation of Bach1 but higher levels of p53 induced by genotoxic and oxidative stresses do not further activate Bach1 expression.29 We surmise that p53 maintains the expression of Bach1, thereby forming a negative feedback loop under normal culture conditions. However, this regulation may be superseded by another regulation under oxidative stress. Bach1 protein may be reduced in response to oxidative stress by a post‐translational mechanism.
Figure 7.
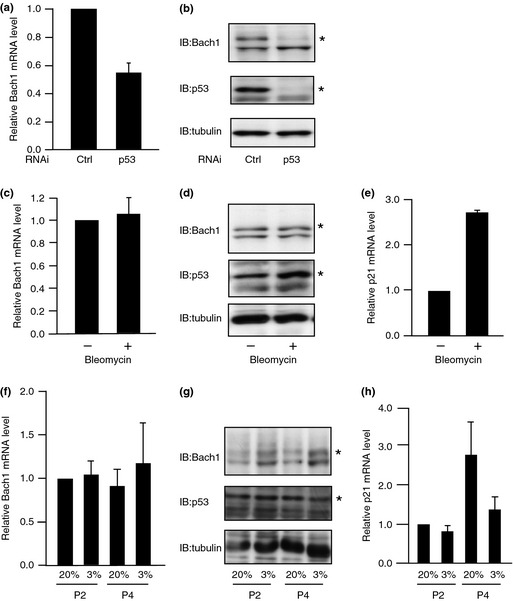
Regulation of Bach1 expression by p53. (a,b) Effects of p53 knockdown on Bach1 mRNA (a) and protein (b) levels are compared. Effects of bleomycin on Bach1 mRNA (c) and protein (d) levels are compared; p21 mRNA levels are compared in (e). (f–h) Mouse embryonic fibroblasts were cultured under 20% or 3% oxygen. Levels of Bach1 mRNA (f) and protein (g) or p21 mRNA (h) are compared at indicated time points. The experiments were carried out independently three times and the mRNA levels are expressed as the mean ± SD. Representative images of immunoblotting (IB) are shown. Ctrl, control.
Discussion
How Bach1 is regulated during the process of cellular senescence is poorly clarified. This issue is critical to understand how upstream signals of p53 are integrated to activate or inhibit p53 in the process of cellular senescence. This study showed that p19ARF bound to Bach1 in a way mutually exclusive of p53 and suggest that p19ARF may alleviate Bach1‐mediated inhibition of p53 by binding to Bach1 (Fig. 8). Diverse stimuli including RasV12 and oxidative stress induce p19ARF.28, 30 Therefore, the observed dissociation of Bach1 from p53 (Fig. 1) is likely to involve p19ARF. In our model (Fig. 8), p19ARF sends divergent signals through inhibiting both Bach1 and MDM2, converging upon p53 activation by different mechanisms (i.e., stabilization and de‐repression on chromatin, respectively). Such a two‐tiered regulation known as a bi‐parallel network motif,31 is expected to confer a sigmoidal response beneficial to integration of multiple inputs and to preclude spontaneous activation of the senescence program in response to milder stress. Our results in Figures 5(b) and 6 suggest that a partial inhibition of both Bach1 and MDM2 may synergistically activate p53, providing a mechanistic basis for signal integration. It is not clear how p19ARF regulates the Bach1–p53 interaction. We have found that the p19ARF–Bach1 interaction is indirect (data not shown) and that Bach1–p53 interaction is also indirect.8 Therefore, identification of a protein that mediates their interaction is necessary. It will also be necessary to examine interactions of the endogenous proteins and their changes in response to genotoxic stresses.
Figure 8.
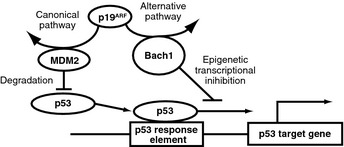
Model of the regulatory network involving p19ARF, p53, and Bach1. p19ARF regulates both Bach1, which inhibits p53‐dependent senescence, and MDM2.
Furthermore, p19ARF may regulate the p53‐independent function of Bach1, because p19ARF inhibited the interaction between Bach1 and MafK as well (Fig 4a). It should be noted that the p19ARF‐binding region of Bach1 contains the Crm1‐dependent, heme‐regulated nuclear export signal.22, 32 Therefore, p19ARF could affect the MARE‐dependent repressor activity of Bach1 by interacting with this region. Knockdown of p19ARF did not affect HO‐1 expression in wild‐type MEFs (data not shown), suggesting that the effect of p19ARF on Bach1 may be specific to a subset of target genes and/or a definite condition.
Our results revealed that Bach1 and MDM2 are both required for the inhibition of p53 in MEFs. Both of them constitute negative feedback loops of p53 (reference 33 and this study). However, their regulatory roles seem to be distinct. Bach1‐mediated inhibition operates under normal culture conditions but it becomes void under oxidative stress due to the reduction of Bach1 protein (Fig. 7f). In addition, induction of p53 by DNA damage did not result in further accumulation of Bach1 (Fig. 7d). Therefore, the Bach1‐mediated inhibition of p53 might be restricted to normal, homeostatic conditions. This can explain the fact that, while the inhibitory role of Bach1 on p53 predicts the presence of human cancers in which BACH1 is overexpressed, there has been no report on BACH1 overexpression until now. The mechanism by which oxidative stress decreased Bach1 protein is not clear yet. Considering that a cysteine residue of Bach1 is a target of the oxidative stressor diamide,34 redox modification could be involved in the regulation. Because oxidative stress inhibits the Bach1–p53 interaction (Fig. 1) and decreases the Bach1 protein level (Fig. 7e), we speculate that oxidative stress induces senescence in part by affecting Bach1‐mediated inhibition of p53. Considering the functions of Bach1 and p53 in diverse stress responses, further study of Bach1 and p19ARF is beneficial for the elucidation of the signal networks observed in the oxidative stress response, cellular senescence, and tumor suppression.
Disclosure Statement
The authors have no conflicts of interest.
Acknowledgements
We thank Drs. Akihiko Muto, Yasutake Katoh (Tohoku University) and the other members of our laboratory. We also thank Dr. Keiko Nakayama, Tohoku University, and Dr. Nobuyuki Tanaka, Nippon Medical School, for valuable advice and reagents. This work was supported by Grants‐in‐aid and the Network Medicine Global‐COE Program from the Ministry of Education, Culture, Sports, Science and Technology, Japan. Additional initiative support was received from the Uehara Foundation, the Takeda Foundation, and the Astellas Foundation for Research on Metabolic Disorders. Restoration of laboratory damage from the 2011 Tohoku earthquake was supported in part by the Astellas Foundation for Research on Metabolic Disorders, Banyu Foundation, Naito Foundation, A. Miyazaki, and A. Iida.
References
- 1. Collado M, Gil J, Efeyan A et al Tumour biology: senescence in premalignant tumours. Nature 2005; 436: 642. [DOI] [PubMed] [Google Scholar]
- 2. Bartkova J, Horejsi Z, Koed K et al DNA damage response as a candidate anti‐cancer barrier in early human tumorigenesis. Nature 2005; 434: 864–70. [DOI] [PubMed] [Google Scholar]
- 3. Campisi J. Cellular senescence as a tumor‐suppressor mechanism. Trends Cell Biol 2001; 11: S27–31. [DOI] [PubMed] [Google Scholar]
- 4. Honda R, Tanaka H, Yasuda H. Oncoprotein MDM2 is a ubiquitin ligase E3 for tumor suppressor p53. FEBS Lett 1997; 420: 25–7. [DOI] [PubMed] [Google Scholar]
- 5. Weber JD, Taylor LJ, Roussel MF, Sherr CJ, Bar‐Sagi D. Nucleolar Arf sequesters Mdm2 and activates p53. Nat Cell Biol 1999; 1: 20–6. [DOI] [PubMed] [Google Scholar]
- 6. Pomerantz J, Schreiber‐Agus N, Liegeois NJ et al The Ink4a tumor suppressor gene product, p19Arf, interacts with MDM2 and neutralizes MDM2's inhibition of p53. Cell 1998; 92: 713–23. [DOI] [PubMed] [Google Scholar]
- 7. Zhang Y, Xiong Y, Yarbrough WG. ARF promotes MDM2 degradation and stabilizes p53: ARF‐INK4a locus deletion impairs both the Rb and p53 tumor suppression pathways. Cell 1998; 92: 725–34. [DOI] [PubMed] [Google Scholar]
- 8. Dohi Y, Ikura T, Hoshikawa Y et al Bach1 inhibits oxidative stress‐induced cellular senescence by impeding p53 function on chromatin. Nat Struct Mol Biol 2008; 15: 1246–54. [DOI] [PubMed] [Google Scholar]
- 9. Nishiyama M, Oshikawa K, Tsukada Y et al CHD8 suppresses p53‐mediated apoptosis through histone H1 recruitment during early embryogenesis. Nat Cell Biol 2009; 11: 172–82. [DOI] [PMC free article] [PubMed] [Google Scholar]
- 10. Jang H, Choi SY, Cho EJ, Youn HD. Cabin1 restrains p53 activity on chromatin. Nat Struct Mol Biol 2009; 16: 910–5. [DOI] [PubMed] [Google Scholar]
- 11. Ota K, Dohi Y, Brydun A, Nakanome A, Ito S, Igarashi K. Identification of senescence‐associated genes and their networks under oxidative stress by the analysis of Bach1. Antioxid Redox Signal 2011; 14: 2441–51. [DOI] [PubMed] [Google Scholar]
- 12. Igarashi K, Sun J. The heme‐Bach1 pathway in the regulation of oxidative stress response and erythroid differentiation. Antioxid Redox Signal 2006; 8: 107–18. [DOI] [PubMed] [Google Scholar]
- 13. Hintze KJ, Katoh Y, Igarashi K, Theil EC. Bach1 repression of ferritin and thioredoxin reductase1 is heme‐sensitive in cells and in vitro and coordinates expression with heme oxygenase1, beta‐globin, and NADP(H) quinone (oxido) reductase1. J Biol Chem 2007; 282: 34365–71. [DOI] [PubMed] [Google Scholar]
- 14. Sun J, Hoshino H, Takaku K et al Hemoprotein Bach1 regulates enhancer availability of heme oxygenase‐1 gene. EMBO J 2002; 21: 5216–24. [DOI] [PMC free article] [PubMed] [Google Scholar]
- 15. Duckers HJ, Boehm M, True AL et al Heme oxygenase‐1 protects against vascular constriction and proliferation. Nat Med 2001; 7: 693–8. [DOI] [PubMed] [Google Scholar]
- 16. Iida A, Inagaki K, Miyazaki A, Yonemori F, Ito E, Igarashi K. Bach1 deficiency ameliorates hepatic injury in a mouse model. Tohoku J Exp Med 2009; 217: 223–9. [DOI] [PubMed] [Google Scholar]
- 17. Omura S, Suzuki H, Toyofuku M, Ozono R, Kohno N, Igarashi K. Effects of genetic ablation of bach1 upon smooth muscle cell proliferation and atherosclerosis after cuff injury. Genes Cells 2005; 10: 277–85. [DOI] [PubMed] [Google Scholar]
- 18. Tanimoto T, Hattori N, Senoo T et al Genetic ablation of the Bach1 gene reduces hyperoxic lung injury in mice: role of IL‐6. Free Radic Biol Med 2009; 46: 1119–26. [DOI] [PubMed] [Google Scholar]
- 19. Mito S, Ozono R, Oshima T et al Myocardial protection against pressure overload in mice lacking Bach1, a transcriptional repressor of heme oxygenase‐1. Hypertension 2008; 51: 1570–7. [DOI] [PubMed] [Google Scholar]
- 20. Yano Y, Ozono R, Oishi Y et al Genetic ablation of the transcription repressor Bach1 leads to myocardial protection against ischemia/reperfusion in mice. Genes Cells 2006; 11: 791–803. [DOI] [PubMed] [Google Scholar]
- 21. Peyton KJ, Reyna SV, Chapman GB et al Heme oxygenase‐1‐derived carbon monoxide is an autocrine inhibitor of vascular smooth muscle cell growth. Blood 2002; 99: 4443–8. [DOI] [PubMed] [Google Scholar]
- 22. Suzuki H, Tashiro S, Sun J, Doi H, Satomi S, Igarashi K. Cadmium induces nuclear export of Bach1, a transcriptional repressor of heme oxygenase‐1 gene. J Biol Chem 2003; 278: 49246–53. [DOI] [PubMed] [Google Scholar]
- 23. Zenke‐Kawasaki Y, Dohi Y, Katoh Y et al Heme induces ubiquitination and degradation of the transcription factor Bach1. Mol Cell Biol 2007; 27: 6962–71. [DOI] [PMC free article] [PubMed] [Google Scholar]
- 24. Katoh Y, Ikura T, Hoshikawa Y et al Methionine adenosyltransferase II serves as a transcriptional corepressor of Maf oncoprotein. Mol Cell 2010; 41: 554–66. [DOI] [PubMed] [Google Scholar]
- 25. Igarashi K, Itoh K, Hayashi N, Nishizawa M, Yamamoto M. Conditional expression of the ubiquitous transcription factor MafK induces erythroleukemia cell differentiation. Proc Natl Acad Sci USA 1995; 92: 7445–9. [DOI] [PMC free article] [PubMed] [Google Scholar]
- 26. Ito N, Watanabe‐Matsui M, Igarashi K, Murayama K. Crystal structure of the Bach1 BTB domain and its regulation of homodimerization. Genes Cells 2009; 14: 167–78. [DOI] [PubMed] [Google Scholar]
- 27. Yoshida C, Tokumasu F, Hohmura KI et al Long range interaction of cis‐DNA elements mediated by architectural transcription factor Bach1. Genes Cells 1999; 4: 643–55. [DOI] [PubMed] [Google Scholar]
- 28. Parrinello S, Samper E, Krtolica A, Goldstein J, Melov S, Campisi J. Oxygen sensitivity severely limits the replicative lifespan of murine fibroblasts. Nat Cell Biol 2003; 5: 741–7. [DOI] [PMC free article] [PubMed] [Google Scholar]
- 29. Sablina AA, Budanov AV, Ilyinskaya GV, Agapova LS, Kravchenko JE, Chumakov PM. The antioxidant function of the p53 tumor suppressor. Nat Med 2005; 11: 1306–13. [DOI] [PMC free article] [PubMed] [Google Scholar]
- 30. Zindy F, Eischen CM, Randle DH et al Myc signaling via the ARF tumor suppressor regulates p53‐dependent apoptosis and immortalization. Genes Dev 1998; 12: 2424–33. [DOI] [PMC free article] [PubMed] [Google Scholar]
- 31. Milo R, Shen‐Orr S, Itzkovitz S, Kashtan N, Chklovskii D, Alon U. Network motifs: simple building blocks of complex networks. Science 2002; 298: 824–7. [DOI] [PubMed] [Google Scholar]
- 32. Suzuki H, Tashiro S, Hira S et al Heme regulates gene expression by triggering Crm1‐dependent nuclear export of Bach1. EMBO J 2004; 23: 2544–53. [DOI] [PMC free article] [PubMed] [Google Scholar]
- 33. Manfredi JJ. The Mdm2‐p53 relationship evolves: Mdm2 swings both ways as an oncogene and a tumor suppressor. Genes Dev 2010; 24: 1580–9. [DOI] [PMC free article] [PubMed] [Google Scholar]
- 34. Ishikawa M, Numazawa S, Yoshida T. Redox regulation of the transcriptional repressor Bach1. Free Radic Biol Med 2005; 38: 1344–5. [DOI] [PubMed] [Google Scholar]


