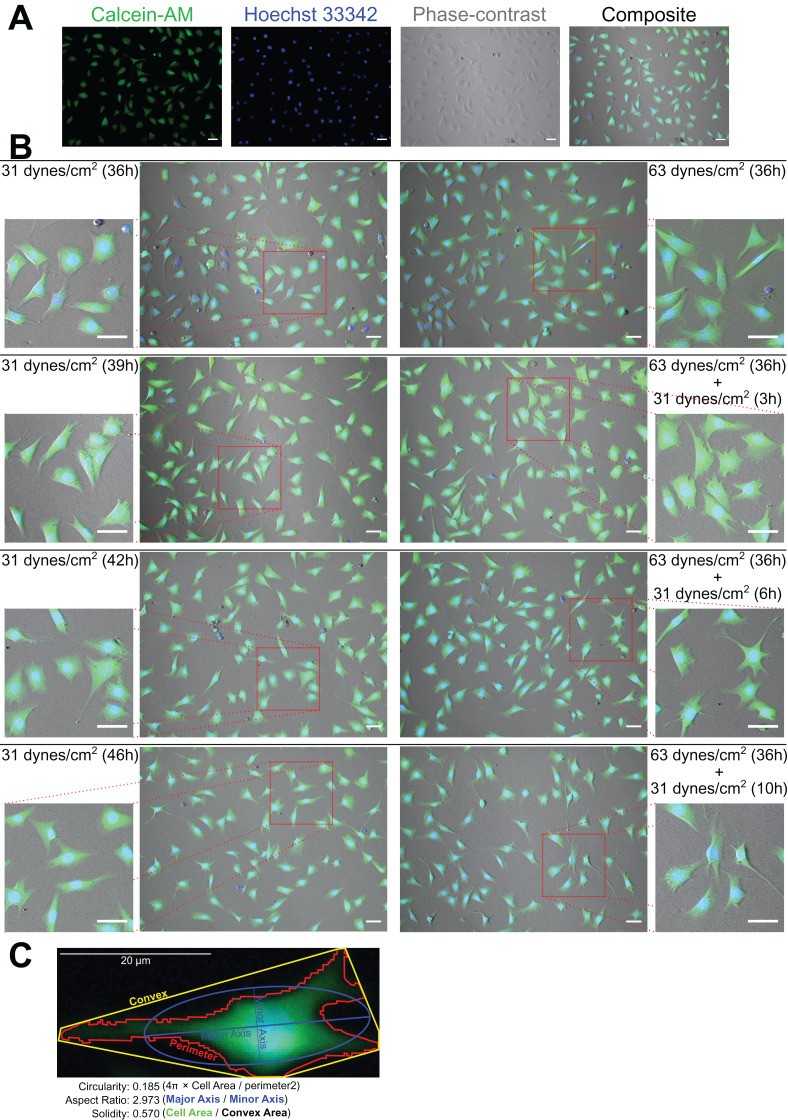
Figure 2. Calcein-AM and Hoechst 33342 staining and morphological measurements.
(A) An example of the phase-contrast image with Calcein-AM and Hoechst 33342 staining. (B) The morphological changes during the recover-period. (C) An illustration of the morphological measurements. The right samples experienced an additional 32 dynes/cm2 loading before this 10 h recover-period as the treatment of loading history comparing to the left samples. All original images used for the morphological measurements can be downloaded from Mendeley Data (http://dx.doi.org/10.17632/2yfd2w8jfp.1#folder-36eef903-4de0-4fcc-916a-b27262fb31a1).

