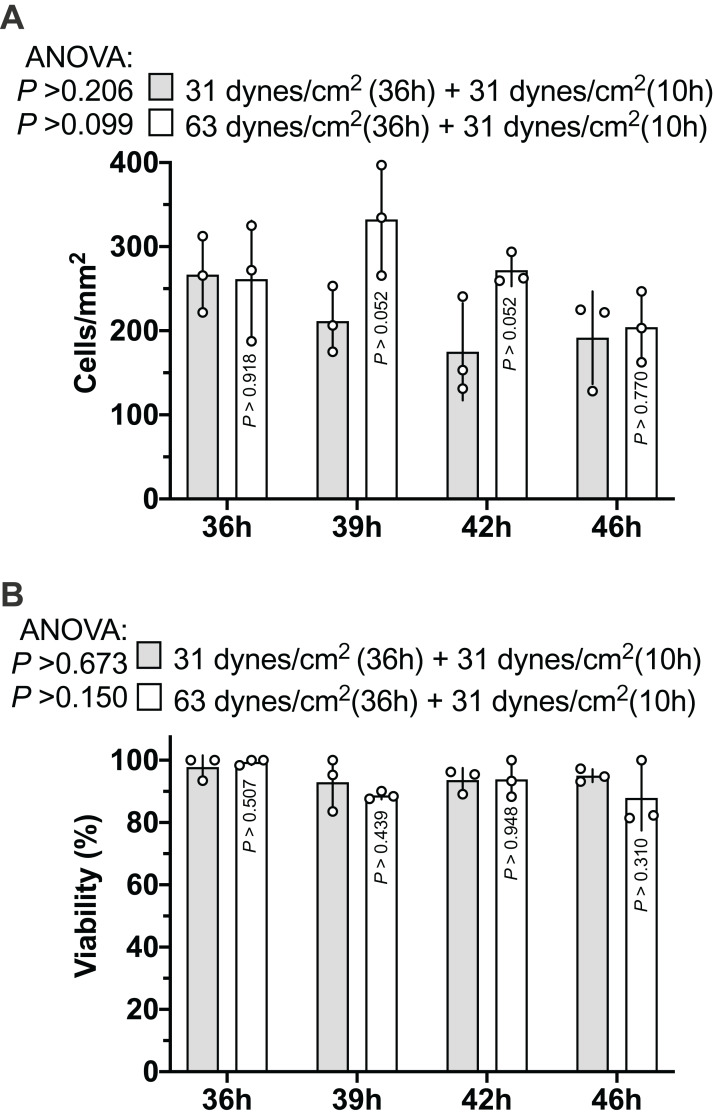
Figure 3. Proliferation of MLO-Y4 osteocytes during recovery period.
The results of cell number counting (A) and cell viability (B). ANOVA, analysis of variance; the P-values for each ANOVA test were listed before the legends; the P-values for each time point were from the independent Student’s t-test. The values of each replicate are presented as the dots. The results are shown as mean ± standard deviation.

