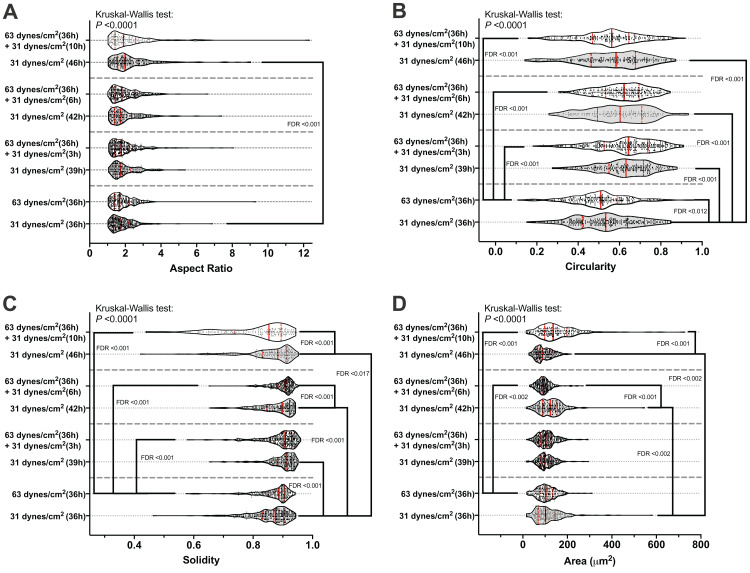
Figure 4. The results of morphological measurements during the recovery period.
The aspect ratio (A), circularity (B), solidity (C), and cell area (D) are shown in a violin plot. The results of each cell are represented as the dots inside the violin shape; the kernel density is represented as the outline of the violin shape; the red solid line indicates the median value; the red dashed line indicates the quartiles. FDR, false discovery rate; the FDR test was performed following the Kruskal-Wallis test. All original images used for cell morphological measurements can be downloaded from Mendeley Data (http://dx.doi.org/10.17632/2yfd2w8jfp.1#folder-36eef903-4de0-4fcc-916a-b27262fb31a1).

