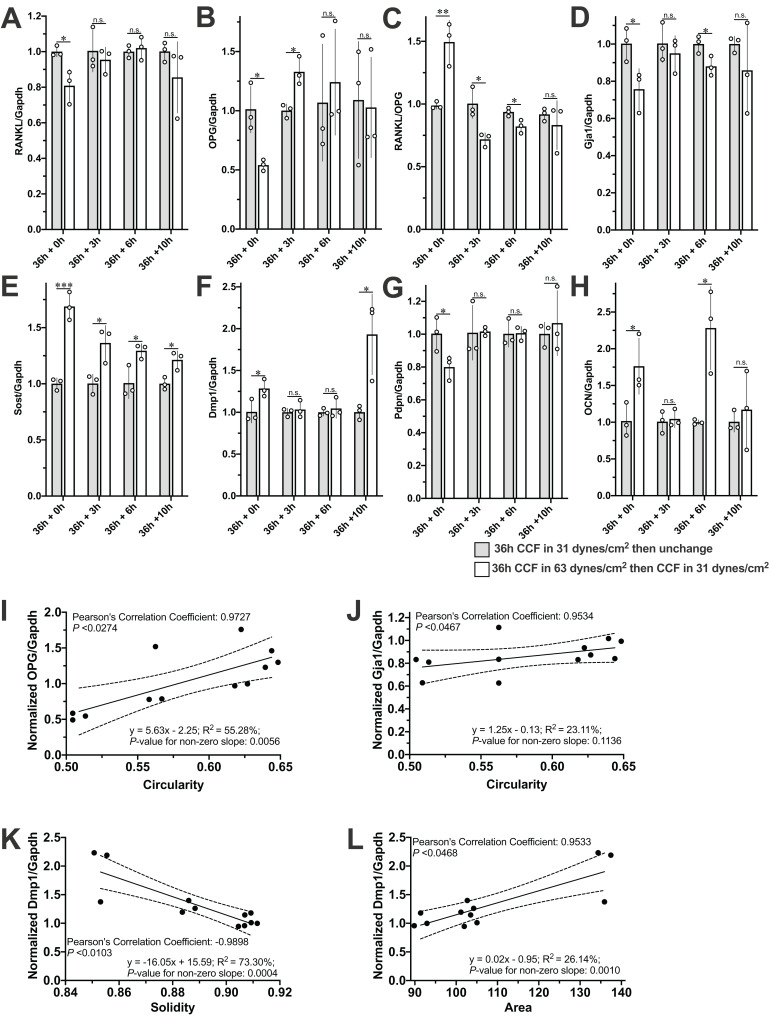
Figure 5. Expression profile of interesting genes and correlated morphological changes during the recovery period.
The mRNA expression of (A) RANKL, (B) OPG, (C) RANKL/OPG, (D) Gja1, (E) Sost, (F) Dmp1, (G) PDNP and (H) OCN during the recovery period and the correlations of (I) OPG with Circularity, (J) of Gja1 with Circularity and (L) of Dmp1 and Area. Independent Student’s t-test was performed to test the differences of the mRNA expression of interesting genes between MLO-Y4 with and without loading history at each time point during the recovery period. *P < 0.05; **P < 0.01; ***P < 0.001. The dash lines in (I), (J), (K) and (L) indicate the 95% confidence interval. The values of each replicate are presented as the dots. The results are shown as mean ± standard deviation.

