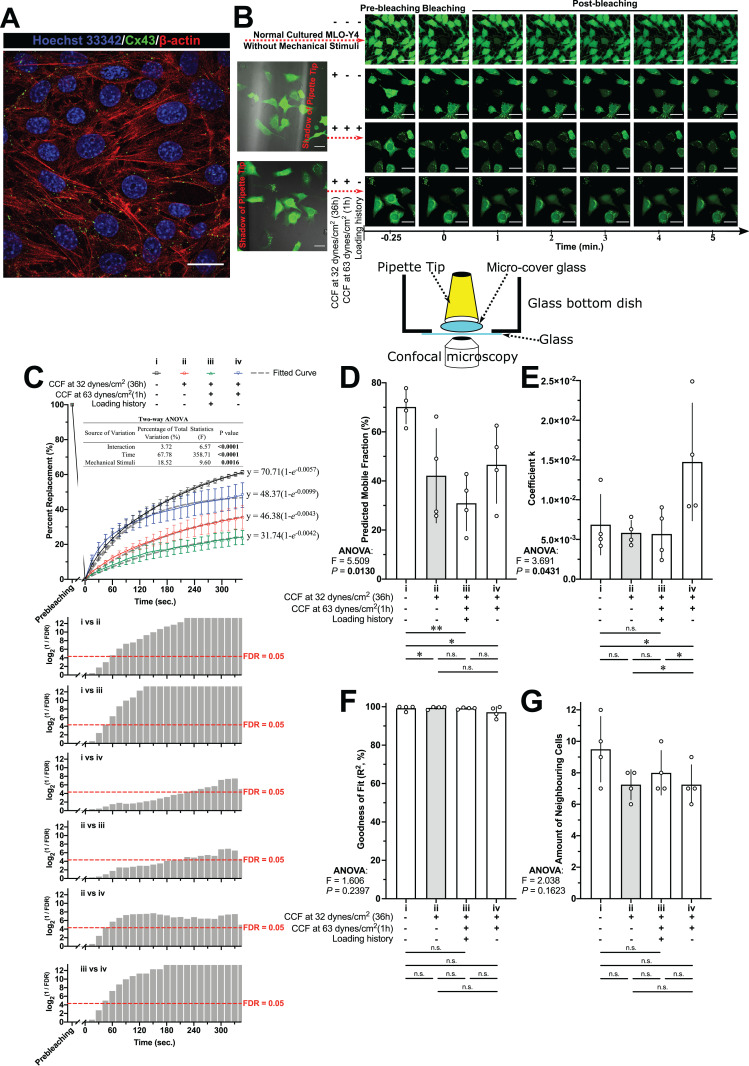
Figure 7. Cx43 expression and fluorescence recovery after photobleaching (FRAP) assay in MLO-Y4 osteocyte-like cells.
(A) The expression of Cx43 in normal cultured (without cover glass) MLO-Y4 osteocyte-like cells. (B) The instrument scheme and examples for FRAP assay in MLO-Y4 osteocyte-like cells. (C) FRAP recover curve and fitted model of calcein fluorescence transportation in MLO-Y4 osteocyte-like cells with or without loading history. After a two-way ANOVA test, multiple testing with false discovery rate (FDR) control for the recover curves was performed and transformed FDR values are plotted (higher plot bar with lower original FDR value). The (D) predicted mobile fraction, (E) coefficient k and (F) goodness of fit from the fitted model were investigated. (G) The number of neighbouring cells surrounding the photobleached target cell were counted. All original time-lapse images used for FRAP analysis can be downloaded from Mendeley Data (DOI: http://dx.doi.org/10.17632/2yfd2w8jfp.1#folder-177a56ec-cb22-492b-8f72-21438f23394c). In (D), (E), (F) and (G), Fisher’s least Significant Difference (LSD) test was performed following the ANOVA test, the values of each replicate are presented as the dots, and the results are shown as mean ± standard deviation. The results in (C) are shown as the mean ± standard error of the mean. Scale bar = 20 µm. ANOVA, analysis of variance; *P < 0.05; **P < 0.01.

