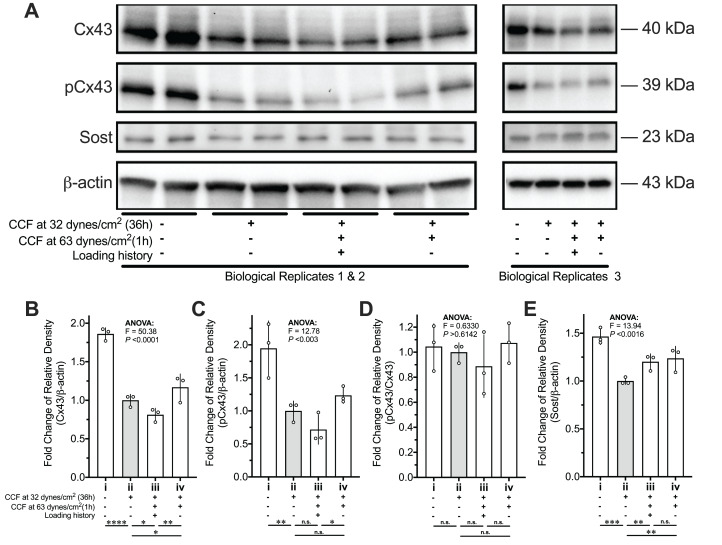
Figure 8. Protein expression changes of Cx43, pCx43, and Sost of MLO-Y4 osteocyte-like cells in response to re-applied compressive force with or without loading history.
(A) Loading history suppressed the mechanosensitivity of Cx43 and pCx43 but not Sost in response to the compressive force applied again. The quantitative results of (A) for protein expression of (B) Cx43, (C) pCx43, (D) pCx43/Cx43 and (E) Sost. Multiple testing with false discovery rate (FDR) control followed a one-way ANOVA test was performed by using the results from two independent replications. The values of each replicate are presented as the dots. The results are shown as mean ± standard deviation. ANOVA, analysis of variance. *FDR < 0.05; **FDR < 0.01; ***FDR < 0.001. The molecular weight (MW) was estimated by a standard curve of the logarithm of the MW versus relative migration distance that was generated using the PrecisionTM Plus Protein Dual Xtra Standards.

