Abstract
Background:
Caregivers are playing a vital role in mentally ill patients in India. Families of children with intellectual disability encounter a high degree of stress such as physical, emotional, and financial.
Aim:
The aim of this study was to compare and evaluate the caregiver burden and depression between the special school-going children and nonschool-going children with intellectual disability.
Materials and Methods:
The present study was conducted on caregivers of patients with intellectual disability at Radianz Health Care and Research Private Limited, Ahana Hospitals, Akash Special School, and M. S. Chellamuthu Trust and Research Foundation, Madurai. The Zarit Burden Interview scale was utilized to assess the level of burden experienced by the caregivers. The Major Depression Inventory scale was utilized to assess the severity of depression experienced by the caregivers. The Binet Kamat Test of Intelligence was administered by a psychologist to assess the IQ level of the children.
Results:
Totally 80 caregivers were participated in the study. The mothers of children with intellectual disability suffered from burden and depression when compared to the fathers (P < 0.0001). The parents of nonschool-going children had a higher level of burden and depression as compared to the parents of special school-going children (P < 0.0001).
Conclusion:
Special school is playing a vital role for children with intellectual disability. It can be reasonably concluded from the study that both the groups face burden and depression. However, the severity of burden and depression is comparatively higher among parents of nonschool-going children.
Keywords: Burden, caregiver, intellectual disability, Major Depression Inventory, special school, Zarit Burden scale
A mental disorder has long been an issue in the society. Around 25% of individuals are affected by mental and behavioral disorders during their lifetime. It is estimated that one in four families has at least one member with mental and behavioral disorders.[1] Mental retardation is a condition of developmental deficit, starting in childhood, which leads to significant limitation of cognition or intellect and poor adaptive functioning in their daily life.[2] Overall 10%–20% of children and adolescents experience mental disorders.[3] Children with mental disorders face significant difficulties with stigma, isolation, and discrimination, in addition the absence of access to health awareness and education facilities, deprived of their basic human rights.[4] In the world, around 450 million people experience the ill effects of a mental or behavioral disorder, and every year, nearly one million people commit suicide.[5]
In India, around 2% of the population is affected by intellectual disability. The prevalence of intellectual disability in India varies from 0.22% to 32.7%. Mental disorder is a significant burden on family members. Patients with mental retardation are more and more dependent on their caregivers depending on the severity of their illness.[6] Family members are the primary caregivers of people with mental illness. They give physical and emotional support and have to bear the financial expenses which are associated with mental health treatment and care.[7]
A caregiver is a person who supports and cares for some person diagnosed with chronic or debilitating medical condition. Psychiatric problems have a significant effect on both patients and their caregivers.[8] Psychiatric patients need aid or supervision in their day-by-day activities, and this frequently puts a significant trouble on their caregivers; subsequently, the caregivers often suffer from mental and health problems.[9] Caregiver burden refers to a high level of stress that may be accomplished by individuals who are caring for another person with some kind of illness. A family of children with intellectual disability encounters a high degree of stress such as physical, emotional, and financial. There are numerous issues of having a mentally retarded child in the family. The issues are mostly identified with the social ridicule and social stigma.[10,11]
An intellectual disability child in the family is generally a serious stress factor for their parents. In India, the larger part of people with intellectual disability has generally been taken care by their family members. In today’s advanced society, this home-based care has brought about many unwanted consequences such as changes in the social system (e.g., separation of joint families) and affects the economic system (e.g., unemployment).[12]
Special school is a school for children who have intellectual disability, behavioral problem, or physical disability. Special school provides opportunities for children with intellectual disability to develop their daily living skills, get basic education, and develop their capacities. Since it helps to develop the child’s personal and social adequacy,[13] it might help to reduce the parent’s burden and stress.
A previous study reported that the parents of special school-going children had mild-to-moderate burden,[14] whereas parents of special nonschool-going children had a severe level of burden.[15]
Although there are many studies that have discussed the stress, burden, and depression of parents of intellectual disability children, there has been no comparative research done with special school-going children and nonschool-going children. This study was aimed to investigate and compare the degree of burden and depression among parents of special school-going children and nonschool-going children.
MATERIALS AND METHODS
The present study was conducted for the caregivers of patients with intellectual disability at Radianz Health Care and Research Private Limited, Ahana Hospitals, Akash Special School, and M. S. Chellamuthu Trust and Research Foundation, Madurai. The study was conducted for a period of 4 months, there were 98 individuals approached for this study, 8 patients were screen failure due to chronic physical illness, and 10 caregivers did not give consent in this study. Totally 80 caregivers were selected and enrolled in the study and divided into two arms. The one arm consists of 40 intellectual disabled children who are going to special school and their caregivers. The second arm consists of 40 intellectual disability children who have never been to a special school and their caregivers. A semi-structured questionnaire was developed to collect the sociodemographic details of children and their caregivers.
Inclusion criteria
Caregivers staying with the child since the onset of illness
Children diagnosed with intellectual disability as per the DSM-5 criteria
Caregivers living with the child in the same household
Caregivers who should be educated were included in the study.
Exclusion criteria
Caregivers who were not blood related to the children
Past or current psychiatric or chronic physical illness
Caregivers refused to give consent
Caregivers who are taking care of more than one child were excluded from the study.
The investigator explained the study details to the caregivers and obtained the informed consent before enrollment into the study,
Caregivers’ burden assessment
In this study, standard instrument was utilized to evaluate the caregivers’ burden: Zarit Burden Interview[16] scale was utilized to assess the level of burden experienced by the caregivers. The scale composed of 22 items; each question is scored on a 5-point (0–4) Likert scale ranging from never to nearly always present. Aggregate scores range from 0 to 88 and higher scores indicate higher burden. The Cronbach’s alpha value was 0.93; the intraclass correlation coefficient for the test–retest reliability of the Zarit Burden score was 0.89.[17]
Caregivers’ depression assessment
The Major Depression Inventory[18] scale was utilized to assess the severity of depression experienced by the caregivers. The scale composed of 10 items; each question is scored on a 5-point (0–4) Likert scale ranging from no time to all the time. Again, for items 8 and 10, alternative a (or) b with the highest score is considered. The severity was measured based on score which ranges from 0 to 40. The scale has good reliability as well as validity.[19]
Intelligence quotient assessment
The Binet Kamat Test of Intelligence[20] is a standardized test that assesses intelligence and cognitive abilities in children with intellectual disability. It has both verbal and performance tests. The Binet Kamat Intelligence scale has been standardized for Indian population, reliability and validity for this scale is well established.[21]
Ethical committee approval
Ethical committee approval was sought and obtained from the Institutional Ethics committee, Radianz Health Care and Research, Madurai, Tamil Nadu.
Statistical tools
Statistical analysis was done with the help of computer using Epidemiological Information Package (EPI 2012) developed by the Centers for Disease Control and Prevention Using this software, range, frequencies, percentages, means, standard deviations, “t” value, Chi-square, and “P” values were calculated. t-test and analysis of variance were used to test the significance of difference between quantitative variables and Yates and Fisher’s Chi-square tests for qualitative variables. P < 0.05 is taken to denote significant relationship.
RESULTS
Table 1
Table 1.
Profile of children
| Variable | Parameter | Value for | t/Chi-square test | ||
|---|---|---|---|---|---|
| Special school group | Nonschool group | P | |||
| Cases studied | Number | 40 | 40 | - | |
| Child | |||||
| Age (years) | Mean (SD) | 10.1 (2.6) | 10.0 (2.5) | 0.828 not significant | - |
| Sex, n (%) | Male | 22 (55) | 21 (52.5 | 0.5 not significant | 0.050 |
| Female | 18 (45) | 19 (47.5) | |||
| Birth order, n (%) | First | 25 (62.5) | 28 (70) | 0.1 not significant | 0.570 |
| Middle | 8 (20) | 7 (17.5) | |||
| Last | 7 (17.5) | 5 (12.5) | |||
| IQ Level, n (%) | Mild | 13 (32.5) | 10 (25) | 0.5 not significant | 4.267 |
| Moderate | 21 (52.5) | 16 (40) | |||
| Severe | 6 (15) | 14 (35) | |||
IQ – Intelligence quotient; SD – Standard deviation
Mean age of the children in special school group was 10.1± 2.6 and non-school group mean was 10± 2.5 [Figure 1]. Both group had high level of male children than female [Figure 2] and maximum number of children were first born, followed by of middle born and last born [Figure 3]. In special school group, 52.5% children had moderate level of intellectual disability and 15% had severe level of intellectual disability. In non-school group,40% children had moderate level of intellectual disability and 25% had mild level of intellectual disability [Figure 4]. There exists no statistically significant difference in the age, sex and other demographic characterised of the children in both the groups [Table1].
Figure 1.
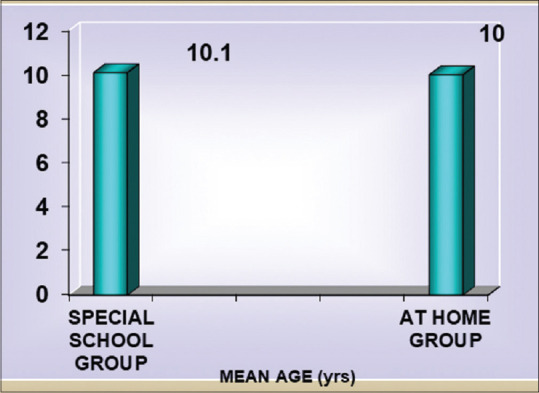
Mean age of children
Figure 2.
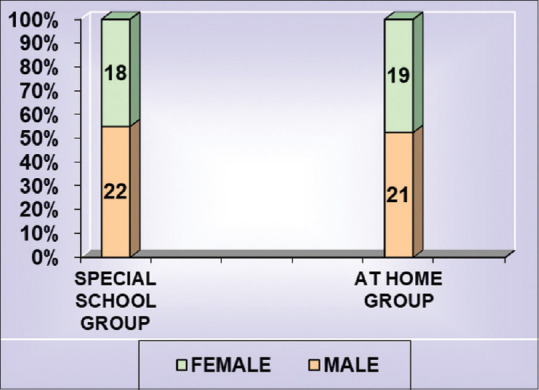
Sex distribution of children
Figure 3.
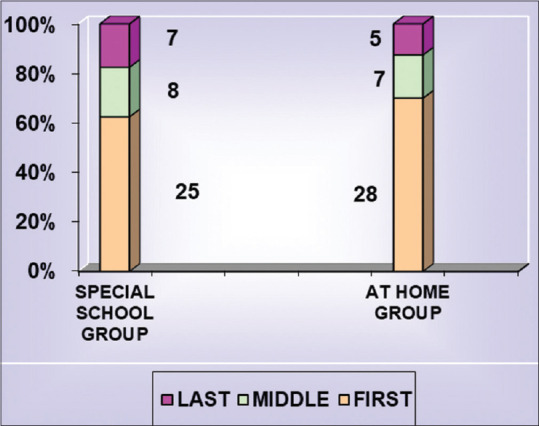
Birth order of children
Figure 4.
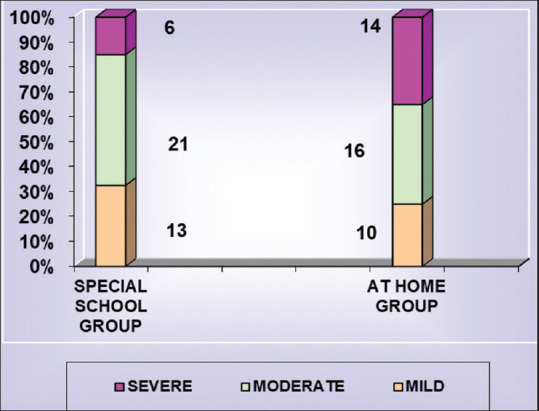
IQ Level of children
Table 2
Table 2.
Profile of caregivers
| Variable | Parameter | Value for | t/Chi-square test | ||
|---|---|---|---|---|---|
| Special school group | Nonschool group | P | |||
| Cases studied | Number | 40 | 40 | - | |
| Caregivers | |||||
| Age | Mean (SD) | 35.1 (5.0) | 35.1 (5.0) | 0.9463 not significant | - |
| Sex, n (%) | Male | 20 (50) | 20 (50) | 0.1 not significant | 0.000 |
| Female | 20 (50) | 20 (50) | |||
| Relationship, n (%) | Father | 20 (50) | 20 (50) | 0.1 not significant | 0.000 |
| Mother | 20 (50) | 20 (50) | |||
| Education, n (%) | Primary | 10 (25) | 12 (30) | 0.2 not significant | 0.786 |
| Secondary | 19 (47.5) | 18 (45) | |||
| Undergraduate | 6 (15) | 7 (17.5) | |||
| Postgraduate | 5 (12.5) | 3 (7.5) | |||
| Economic status,n (%) | Lower | 20 (50) | 22 (55) | 0.1 not significant | 0.202 |
| Middle | 11 (27.5) | 10 (25) | |||
| Upper | 9 (22.5) | 8 (20) | |||
SD – Standard deviation
In both groups, caregiver’s mean age was 35.1± 5 [Figure 5]. In each group, out of 40 caregivers 20 (50%) were male and 20 (50%) were female. With regard to relationship of caregivers 50% of father and 50% of mother enrolled in both group [Figure 6]. In both groups, majority of the subjects had completed secondary level of education [Figure 7] and most of the caregivers belong to middle class category [Figure 8]. There exists no statistically significant difference in the age, sex and other demographic characterised of the care givers in both the groups [Table2].
Figure 5.
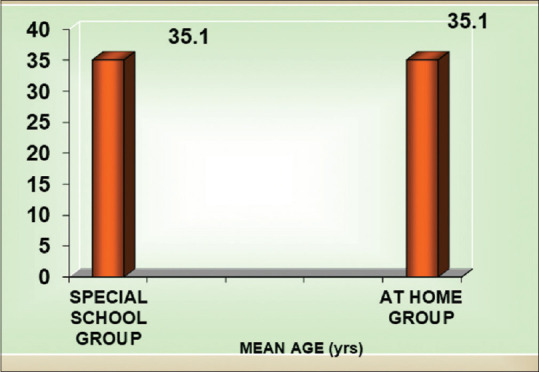
Mean age of caregivers
Figure 6.
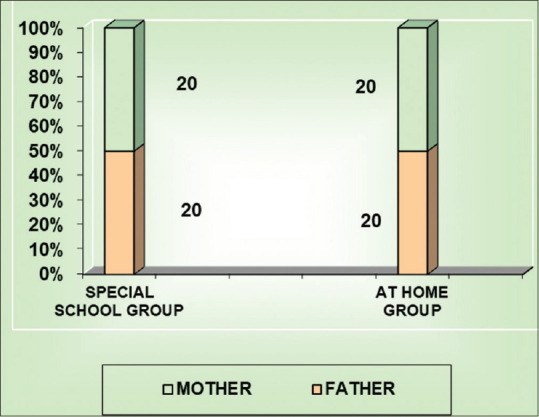
Relationship of caregivers
Figure 7.
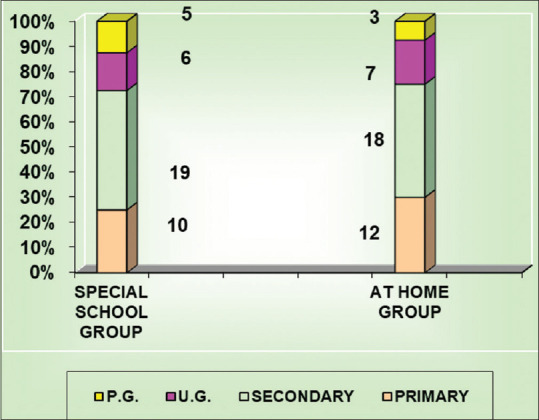
Education of caregivers
Figure 8.
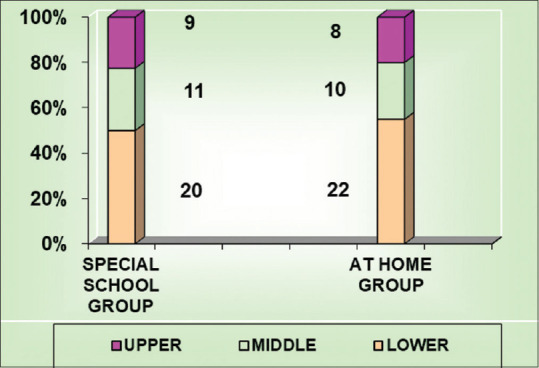
Economic status of caregivers
Table 3
Table 3.
Burden score and depression score
| Burden score | Depression score | |||
|---|---|---|---|---|
| Special school group, n (%) | Nonschool group, n (%) | Special school group, n (%) | Nonschool group, n (%) | |
| Severity score | ||||
| Mild | 1 (2.5) | - | 11 (27.5) | 3 (7.5) |
| Moderate | 28 (70.0) | 12 (30) | 29 (47.5) | 9 (22.5) |
| Severe | 11 (27.5) | 28 (70) | 10 (25.0) | 28 (70.0) |
| Total | 40 (100) | 40 (100) | 40 (100) | 40 (100) |
| Score | ||||
| Range | 41-69 | 52-77 | 20-35 | 20-36 |
| Mean (SD) | 57.4 (5.3) | 66.0 (7.0) | 27.0 (4.6) | 31.6 (4.3) |
| P | <0.0001 significant | <0.0001 significant | ||
| t/Chi-square test | 16.669 | 14.810 | ||
SD – Standard deviation
The burden score in the special group and at non-school group were 57.4±5.3 and 66.0±7.0 respectively [Figure 9]. Similarly the depression scores in the two groups were 27.0±4.6 and 31.6±4.3 respectively [Figure 10]. These two scores had statistically significant difference in the two groups. (P < 0.0001) [Table 3].
Figure 9.
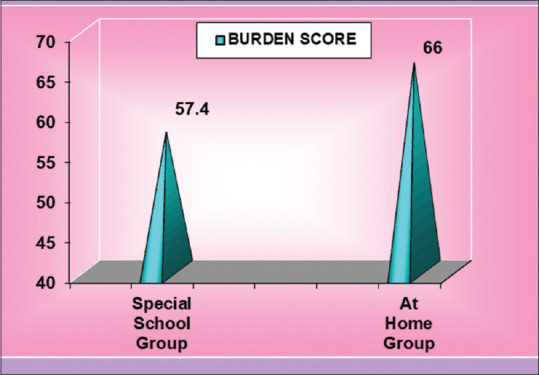
Burden score
Figure 10.
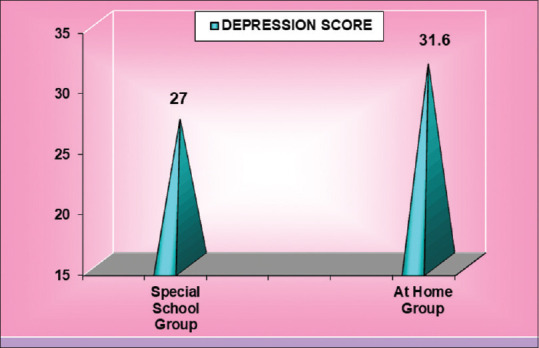
Depression score
Table 4
Table 4.
Association between burden score/depression score and other variables
| Variable | Group | Burden score | Depression score | ||
|---|---|---|---|---|---|
| Mean (SD) | P | Mean (SD) | P | ||
| Child | |||||
| Age (years) | Up to 10 | 61.8 (7.9) | 0.8497 not significant | 29.1 (5.4) | 0.7109 not significant |
| Above 10 | 61.5 (7.2) | 29.5 (4.4) | |||
| Sum of squares | Between groups | 2.069 | 3.314 | ||
| Within groups | 4464.131 | 1948.636 | |||
| Sex | Male | 61.3 (7.1) | 0.6829 not significant | 29.3 (5.1) | 0.9937 not significant |
| Female | 62.0 (8.0) | 29.3 (4.9) | |||
| Sum of squares | Between groups | 9.785 | 0.002 | ||
| Within groups | 4456.415 | 1951.948 | |||
| Birth order | First | 61.5 (8.2) | 0.1083 not significant | 29.6 (4.6) | 0.249 not significant |
| Middle | 60.2 (7.1) | 28.4 (5.3) | |||
| Last | 64.6 (6.9) | 30.6 (4.7) | |||
| Sum of squares | Between groups | 13.502 | 1.962 | ||
| Within groups | 4452.698 | 1949.988 | |||
| IQ Level | Mild | 61.9 (7.3) | 0.89 not significant | 29.2 (5.1) | 0.962 not significant |
| Moderate | 60.8 (7.0) | 29.6 (4.3) | |||
| Severe | 61.3 (9.1) | 29.4 (5.4) | |||
| Sum of squares | Between groups | 250.484 | 69.239 | ||
| Within groups | 4215.716 | 1882.711 | |||
| Caregivers | |||||
| Age (years) | Up to 30 | 61.5 (7.1) | 0.9077 not significant | 28.9 (5.1) | 0.7106 not significant |
| Above 3 | 61.7 (7.7) | 29.4 (5.0) | |||
| Sum of squares | Between groups | 0.775 | 3.603 | ||
| Within groups | 4465.425 | 1948.347 | |||
| Sex | Male | 59.9 (7.5) | 0.0366 significant | 28.0 (5.3) | 0.016 significant |
| Female | 63.4 (7.3) | 30.6 (4.3) | |||
| Sum of squares | Between groups | 245.000 | 140.450 | ||
| Within groups | 4221.200 | 1811.500 | |||
| Relationship | Father | 59.9 (7.5) | 0.036 significant | 28.0 (5.3) | 0.016 significant |
| Mother | 63.4 (7.3) | 30.6 (4.3) | |||
| Sum of squares | Between groups | 245.000 | 140.450 | ||
| Within groups | 4221.200 | 1811.500 | |||
| Education | Primary | 61.2 (7.4) | 0.604 not significant | 29.4 (4.5) | 0.529 not significant |
| Secondary | 61.8 (6.6) | 29.4 (4.3) | |||
| Undergraduate | 63.6 (7.9) | 30.3 (5.9) | |||
| Postgraduate | 59.1 (11.4) | 27.0 (7.5) | |||
| Sum of squares | Between groups | 106.705 | 55.657 | ||
| Within groups | 4359.495 | 1896.293 | |||
| Economic status | Lower | 62.4 (7.0) | 0.6457 not significant | 29.9 (4.2) | 0.5041 not significant |
| Middle | 60.9 (7.0) | 28.8 (4.7) | |||
| Upper | 60.8 (9.5) | 28.4 (6.9) | |||
| Sum of squares | Between groups | 50.45 | 34.425 | ||
| Within groups | 4415.749 | 1917.525 | |||
SD – Standard deviation; IQ – Intelligence quotient
Age, Sex, Birth order, IQ of the child do not have any significant impact on the burden score and depression score of the caregivers. (P >0.0001). Similarly age, educational and economic status of the caregivers have no significant association with the burden and depression scores. (P > 0.0001). But sex of the caregiver has a significant relationship with the score. Males (Father) had lower burden and depression scores (59.9±7.5 and 28.0±5.3) than females (Mother) (63.4±7.3 and 30.6±4.3) [Figures 11 and 12 and Table 4].
Figure 11.
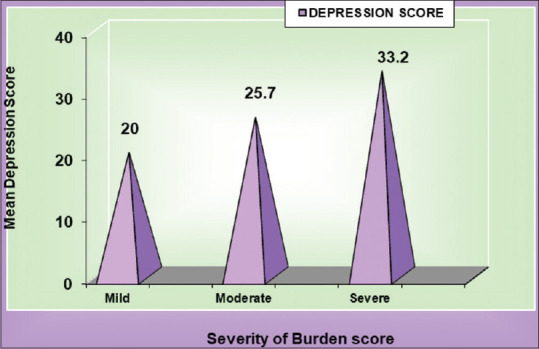
Burden score and depression score
Figure 12.
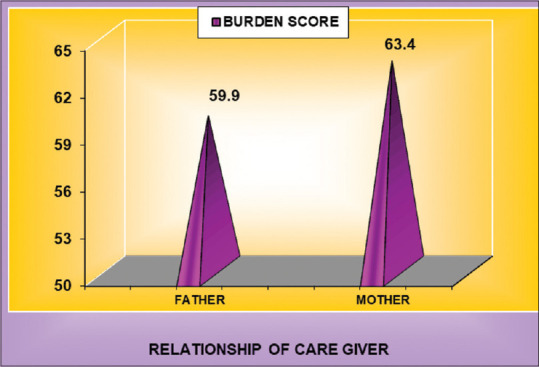
Relationship of caregivers and burden score
Table 5
Table 5.
Association between burden score and depression score
| Burden score | Depression score, mean (SD) |
|---|---|
| Mild | 20.0 (2.4) |
| Moderate | 25.7 (3.5) |
| Severe | 33.2 (2.8) |
| P | <0.0001 significant |
| Sum of squares | |
| Between groups | 1191.806 |
| Within groups | 760.144 |
SD – Standard deviation
Similarly there exists a high degree of association between burden score and depression score [Figure 13 and Table 5].
Figure 13.
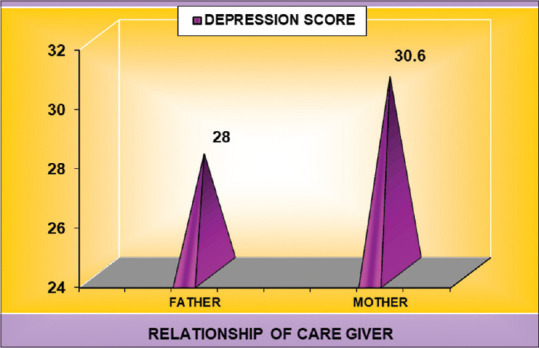
Relationship of caregivers and depression score
DISCUSSION
Children with intellectual disability are a wellspring of interminable stress to the caregivers, and it can influence them adversely from numerous points of view.[22] The study revealed that most of the caregivers are suffering from depression, and the same has been reported in the majority of the studies.[23,24]
Mothers of intellectual disability children have poorer mental well-being than mothers of nondisabled children, and the mothers of intellectual disability children highly suffered from depression.[23,25,26,27] In this study, both the groups of mothers of intellectual disability children suffered more from burden and depression as compared to the fathers. All these mothers had not at one time been diagnosed by a clinician for depression. The responsibility of caring for children usually falls on the mother. In India, it is more acceptable that mothers usually take up the role of the caregiver. It may lead to depression due to the high level of stress and burden.
A previous study reported that age and education of the caregivers do not have any significant associations with burden.[5] The present study also revealed that age, education, and economic status of caregivers do not have any significant association with burden and depression. The sociodemographic characteristics of the children do not have any significant association with burden and depression.
The result of the study shows that the caregivers of both the groups experienced burden and depression. However, the extents of burden and depression symptoms are high in parents of nonschool-going children than the parents of special schoolchildren. The nonschool group caregivers had high levels of depression and burden as compared to the special school group caregivers. In the nonschool group, most of the caregivers had a severe burden, and none of the caregivers had a mild burden. This study revealed that there is a significant association between caregivers’ burden and depression. A similar finding was reported in previous study.[28]
Caregiving leads to limit participation in a variety of roles and affect the leisure time of caregivers.[29] Special schoolchildren spend around 6 h in school, and the caregivers get leisure time which may reduce the burden and stress level. The special school takes the responsibilities of the caregivers and trains the children in their daily activities and functional academics.
Participants were psychoeducated about the illness, and supportive counseling was also given. Participants were psychoeducated about the illness and they also received supportive counselling and training to improve the coping skills, managing emotional problems and dealing with stress and burden to improve their quality of life. Group approaches for parent counseling and training were also done to educate, orient, and to gain emotional support among themselves. Supportive counseling was given to the parents with mild depression, whereas patients with moderate and severe depression were treated with psychotropics.
Despite the various levels of children with intellectual disability, the special school is playing a vital role, and it appears to reduce the level of burden in caregivers. Special schools set goals for each child and are tailored to the child’s individual needs and ability. The special schools are closely involved in the child’s behavioural, academic, emotional and social development thereby prepare the students to feel comfortable in social circumstances and to inculcate a better social acceptable behaviour which may in turn decrease the depression and the burden on the parents. The special schools engage the children for a portion of the day. They relieve and reduce the burden and stress of the caregivers for that period. It is recommended that children with intellectual disability should be put in the special school which will help in child development and reduce the caregiver burden.
This study has strengths and few limitations. It was primarily limited by its small sample size. For this reason, these findings cannot generalize to the broader community based on the study alone. Directions for future research could include a larger sample size and other family caregivers such as siblings and grandparents. Caregivers’ personality traits may have affected the perception of burden and depression, and these details were not taken into consideration.
CONCLUSION
Caregivers of both special school-going children and nonschool-going children with intellectual disability have high burden and depression. However, the severity of burden and depression is significantly higher among caregivers of nonschool-going children.
Financial support and sponsorship
Nil.
Conflicts of interest
There are no conflicts of interest.
REFERENCES
- 1.Tabish SA. Mental health: Neglected for far too long. JK-Practitioner. 2005;12:34–8. [Google Scholar]
- 2.Vijayan D, Jithesh M. A randomized controlled trial to assess the efficacy of ashtamangalagritha in the management of mental retardation. Int J Res Ayurveda Pharm. 2013;4:74–7. [Google Scholar]
- 3.Kieling C, Baker-Henningham H, Belfer M, Conti G, Ertem I, Omigbodun O, et al. Child and adolescent mental health worldwide: evidence for action. Lancet (London, England) 2011;378:1515–25. doi: 10.1016/S0140-6736(11)60827-1. [DOI] [PubMed] [Google Scholar]
- 4.Jiloha RC. Deprivation, discrimination, human rights violation, and mental health of the deprived. Indian J Psychiatry. 2010;52:207–12. doi: 10.4103/0019-5545.70972. [DOI] [PMC free article] [PubMed] [Google Scholar]
- 5.Maheswari K. Burden of the care givers of mentally retarded children. IOSR J Humanities Soc Sci. 2014;19:P 06–08. [Google Scholar]
- 6.Thiyam KS, Vishal RR. Impact of disability of mentally retarded persons on their parents. Indian J Psychol Med. 2008;30:98–104. [Google Scholar]
- 7.Panayiotopoulos C, Pavlakis A, Apostolou M. Family burden of schizophrenic patients and the welfare system; the case of Cyprus. Int J Ment Health Syst. 2013;7:13. doi: 10.1186/1752-4458-7-13. [DOI] [PMC free article] [PubMed] [Google Scholar]
- 8.Oshodi YO, Adeyemi D, Aina OF, Suleiman TF, Erinfolami AR, Umeh C. Burden and psychological effects: Caregiver experiences in a psychiatric outpatient unit in Lagos, Nigeria. Afr J Psychiatry. 2012;15:99–105. doi: 10.4314/ajpsy.v15i2.13. [DOI] [PubMed] [Google Scholar]
- 9.Ampalam P, Gunturu S, Padma V. A comparative study of caregiver burden in psychiatric illness and chronic medical illness. Indian J Psychiatry. 2012;54:239–43. doi: 10.4103/0019-5545.102423. [DOI] [PMC free article] [PubMed] [Google Scholar]
- 10.Kerenhappachu MS, Sridevi G. Care Giver’s Burden and Perceived Social Support in Mothers of Children with Mental Retardation. International Journal of Scientific and Research Publications. 2014;4:1–7. [Google Scholar]
- 11.Gathwala G, Gupta S. Family burden in mentally handicapped children. Indian J Community Med. 2004;29:188–89. [Google Scholar]
- 12.Majumdar M, Da Silva Pereira Y, Fernandes J. Stress and anxiety in parents of mentally retarded children. Indian J Psychiatry. 2005;47:144–7. doi: 10.4103/0019-5545.55937. [DOI] [PMC free article] [PubMed] [Google Scholar]
- 13.Adeniyi YC, Omigbodun OO. Effect of a classroom-based intervention on the social skills of pupils with intellectual disability in Southwest Nigeria. Child Adolesc Psychiatry Ment Health. 2016;10:29. doi: 10.1186/s13034-016-0118-3. [DOI] [PMC free article] [PubMed] [Google Scholar]
- 14.Darsana GM, Suresh V. Prevalence of caregiver burden of children with disabilities. Int J Inform Futuristic Res. 2017;4:7238–49. [Google Scholar]
- 15.Datta SS, Sudhakar Russell PS, Gopalakrishna SC. Burden among the caregivers of children with intellectual disability. J Intellectual Disabilit. 2002;6:4. [Google Scholar]
- 16.Lu L, Wang L, Yang X, Feng Q. Zarit caregiver burden interview: Development, reliability and validity of the Chinese version. Psychiatry Clin Neurosci. 2009;63:730–4. doi: 10.1111/j.1440-1819.2009.02019.x. [DOI] [PubMed] [Google Scholar]
- 17.Seng BK, Luo N, Ng WY, Lim J, Chionh HL, Goh J, et al. Validity and reliability of the Zarit Burden Interview in assessing caregiving burden. Ann Acad Med Singapore. 2010;39:758–63. [PubMed] [Google Scholar]
- 18.Olsen LR, Jensen DV, Noerholm V, Martiny K, Bech P. The internal and external validity of the Major Depression Inventory in measuring severity of depressive states. Psychol Med. 2003;33:351–6. doi: 10.1017/s0033291702006724. [DOI] [PubMed] [Google Scholar]
- 19.Mignote HG. Global Journal of Endocrinological Metabolism An Analysis of Beck Depression Inventory 2nd Edition (BDI-II) 2018:2. [Google Scholar]
- 20.Roopesh BN, Kumble CN, Kamat B. Test for intelligence – issues with scoring and interpretation. Indian J Ment Health. 2016;3:504–5. [Google Scholar]
- 21.Sunita D. A comparative study on profile analysis of Binet Kamat Test of intelligence of children having mild intellectual disability with and without Down syndrome. Europ Acad Res. 2014;2:9056–72. [Google Scholar]
- 22.Singh TK, Indla V, Indla RR. Impact of disability of mentally retarded persons on their parents. Indian J Psychol Med. 2008;30:98–104. [Google Scholar]
- 23.Nagarkar A, Sharma JP, Tandon SK, Goutam P. The clinical profile of mentally retarded children in India and prevalence of depression in mothers of the mentally retarded. Indian J Psychiatry. 2014;56:165–70. doi: 10.4103/0019-5545.130500. [DOI] [PMC free article] [PubMed] [Google Scholar]
- 24.Emerson E. Mothers of children and adolescents with intellectual disability: Social and economic situation, mental health status, and the self-assessed social and psychological impact of the child’s difficulties. J Intellect Disabil Res. 2003;47:385–99. doi: 10.1046/j.1365-2788.2003.00498.x. [DOI] [PubMed] [Google Scholar]
- 25.Olsson MB, Hwang CP. Depression in mothers and fathers of children with intellectual disability. J Intellect Disabil Res. 2001;45:535–43. doi: 10.1046/j.1365-2788.2001.00372.x. [DOI] [PubMed] [Google Scholar]
- 26.Al-Kuwari MG. Psychological health of mothers caring for mentally disabled children in Qatar. Neurosciences (Riyadh) 2007;12:312–7. [PubMed] [Google Scholar]
- 27.Bugua NM, Kuria MW, Ndetei DM. The prevalence of depression among family caregivers of children with intellectual disability in a rural setting in Kenya. Int J Fam Med. 2011;2011:5. doi: 10.1155/2011/534513. [DOI] [PMC free article] [PubMed] [Google Scholar]
- 28.Vilchinsky N, Dekel R, Revenson TA, Liberman G, Mosseri M. Caregivers’ burden and depressive symptoms: The moderational role of attachment orientations. Health Psychology, 2015;34:262–69. doi: 10.1037/hea0000121. [DOI] [PubMed] [Google Scholar]
- 29.Stevens AB, Coon D, Wisniewski S, Vance D, Arguelles S, Belle S, et al. Measurement of leisure time satisfaction in family caregivers. Aging Ment Health. 2004;8:450–9. doi: 10.1080/13607860410001709737. [DOI] [PubMed] [Google Scholar]


