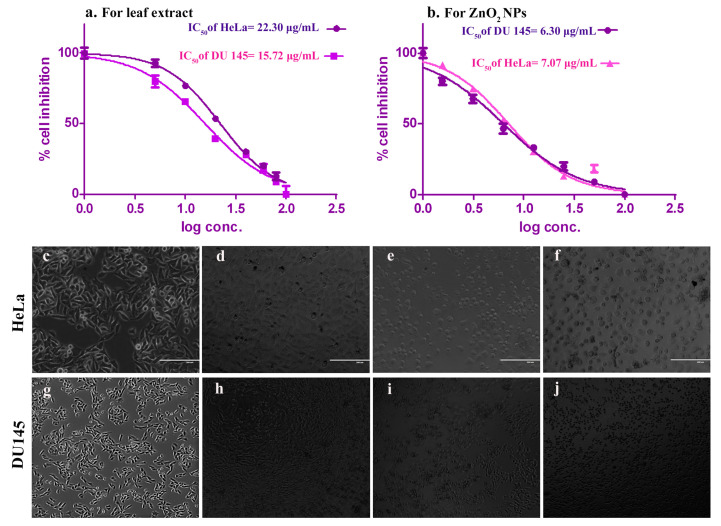
Figure 6.
Cytotoxicity measured by MTT assay on HeLa and DU145 cell lines. (a) IC50 value of leaf extract treated cell lines, (b) IC50 value of ZnO NPs treated cell lines. Normal untreated negative control: (c) HeLa cell lines and (g) DU145 cell lines. Morphological changes due to lower dose of ZnO NPs on: (d) HeLa cell lines and (h) DU 145 cell lines. Morphological changes due to moderate dose of ZnO NPs on: (e) HeLa and (i) DU145 cell lines. Morphological changes due to higher dose of ZnO NPs on: (f) HeLa and (j) DU145 cell lines.

