

Abstract
Background
Although historical trends before 1998 demonstrated improvements in mortality caused by pulmonary embolism (PE), contemporary estimates of mortality trends are unknown. Therefore, our objective is to describe trends in death rates caused by PE in the United States, overall and by sex‐race, regional, and age subgroups.
Methods and Results
We used nationwide death certificate data from Centers for Disease Control and Prevention Wide‐Ranging Online Data for Epidemiologic Research to calculate age‐adjusted mortality rates for PE as underlying cause of death from 1999 to 2018. We used the Joinpoint regression program to examine statistical trends and average annual percent change. Trends in PE mortality rates reversed after an inflection point in 2008, with an average annual percent change before 2008 of −4.4% (−5.7, −3.0, P<0.001), indicating reduction in age‐adjusted mortality rates of 4.4% per year between 1999 and 2008, versus average annual percent change after 2008 of +0.6% (0.2, 0.9, P<0.001). Black men and women had approximately 2‐fold higher age‐adjusted mortality rates compared with White men and women, respectively, before and after the inflection point. Similar trends were seen in geographical regions. Age‐adjusted mortality rates for younger adults (25–64 years) increased during the study period (average annual percent change 2.1% [1.6, 2.6]) and remained stable for older adults (>65 years).
Conclusions
Our study findings demonstrate that PE mortality has increased over the past decade and racial and geographic disparities persist. Identifying the underlying drivers of these changing mortality trends and persistently observed disparities is necessary to mitigate the burden of PE‐related mortality, particularly premature preventable PE deaths among younger adults (<65 years).
Keywords: disparities, mortality, pulmonary embolism, venous thromboembolism
Subject Categories: Embolism, Thrombosis
Pulmonary embolism (PE) is a venous thromboembolic disease that causes significant morbidity and mortality. PE represents the third most common cause of cardiovascular death after myocardial infarction and stroke, 1 though accurate estimates of the national burden of mortality caused by PE are limited. Historical trends between 1979 and 1998 demonstrated improvements in mortality caused by PE. 2 While significant advances in the prevention, diagnosis, and management of PE have occurred in the past 2 decades, including direct‐acting oral anticoagulants, catheter‐directed thrombolysis, and expanded use of inpatient and postoperative prophylaxis, it is unknown whether these advances have led to continued improvements in mortality from PE and whether death rates from PE are heterogeneous across demographic and geographic regions. Therefore, our objective is to describe contemporary trends in death rates from PE in the United States from 1999 to 2018, as well as to examine mortality trends by sex‐race, regional, and age subgroups.
Methods
All data are publicly available, and analytic methods used in the study are available from the corresponding author upon request. We used data from the Centers for Disease Control and Prevention Wide‐Ranging Online Data for Epidemiologic Research, which captures death certificates for all US residents. We identified death certificates listing PE as the underlying cause of death using International Classification of Diseases, 10th revision (ICD‐10), code I26, for adults age 25 years and older (based on age groupings provided by the Centers for Disease Control and Prevention) from January 1, 1999 to December 31, 2018. We calculated age‐adjusted mortality rates (AAMR) per 100 000 population using the standard US population age distribution for the year 2000. We examined mortality rates overall, as well as by sex‐race (Black and White men and women), census regions (Northeast, Midwest, South, and West), county‐level urbanization, and age subgroups. We excluded ages 18 to 25 years based on Centers for Disease Control and Prevention groupings by decade and were not able to include reliable race/ethnic‐specific estimates other than Black and White because of small numbers (eg, Native American) or lack of reliably disaggregated coding (Asian/Pacific Islander, Hispanic).
We used the Joinpoint regression statistical software program (National Cancer Institute) to examine trends in mortality related to PE. The Joinpoint program uses serial permutation tests to analyze repeated time‐trends and identify up to 1 inflection point where the rate of change of mortality is statistically significantly different (P<0.05). Joinpoint subsequently calculates the weighted average annual percent change (APC) for each time segment in the AAMR with 95% CIs. 3 The AAMR describes the mortality rates, while APC describes the slope of change over time.
We conducted a secondary analysis using all nationwide death certificates listing PE as a contributing cause of death, rather than just the underlying cause of death, in order to more broadly characterize the burden of PE‐related mortality. Specifically, this includes deaths where PE was the underlying cause of death as well as deaths in which PE may have contributed but was not considered the proximate cause of death. The metrics of AAMR and APC were calculated as previously described, for deaths with any mention of PE on death certificates. We then examined trends in all PE‐related mortality overall, and by sex‐race subgroups. This study was determined to be exempt from review by the institutional review board at our institution.
Results
Between 1999 and 2018, there were 159 572 deaths attributed to PE as an underlying cause of death in the primary analysis. AAMR attributed to PE experienced an inflection point in 2008, with AAMR of 5.0, 3.4, and 3.5 per 100 000 people in 1999, 2008, and 2018, respectively (Table 1). Trends in mortality rates attributed to PE reversed after the inflection point, as illustrated by APC of −4.4% (95% CI −5.7% to −3.0%) before 2008 (indicating a reduction in the AAMR of 4.4% per year from 1999 to 2008), compared with an APC of +0.6% (0.2%–0.9%) from 2008 to 2018, as shown in Figure 1. Across the study period, Black men had the highest AAMR, and Black men and women had higher AAMR because of PE compared with White men and women, respectively (Table 1). For all sex‐race groups, the decreasing mortality rates seen from 1999 to 2008 reversed from 2008 to 2018, and either increased or became stagnant.
Table 1.
Trends in Age‐Adjusted Mortality Rates for Pulmonary Embolism as Underlying Cause of Death, Overall and by Sex‐Race and Geographical Subgroups, 1999 to 2018
|
1999 AAMR |
2008 AAMR |
2018 AAMR |
1999–2008 APC (95% CI) |
2008–2018 APC (95% CI) |
|
|---|---|---|---|---|---|
| Overall | 5.0 | 3.4 | 3.5 | −4.4% (−5.7, −3.0) | 0.6% (0.2, 0.9) |
| Sex‐race groups | |||||
| Black women | 9.1 | 5.9 | 6.2 | −5.1 (−6.4, −3.7) | 0.2 (−0.6, 1.0) |
| White women | 4.7 | 3.3 | 3.1 | −3.9 (−5.0, −2.7) | 0.1 (−0.5, 0.7) |
| Black men | 9.9 | 6.4 | 6.9 | −4.5 (−6.1, −2.9) | 0.6 (0.0, 1.3) |
| White men | 4.7 | 3.2 | 3.5 | −4.2 (−5.6, −2.8) | 1.3 (0.6, 2.0) |
| Age groups | |||||
| 25 to 64 y | 1.9 | 1.5 | 1.8 | −3.7 (−5.2, −2.1) | 2.1 (1.6, 2.6) |
| >65 y | 17.9 | 11.3 | 10.7 | −4.6 (−6.0, −3.1) | 0.3 (−0.7, 0.2) |
| Geographical census regions | |||||
| Northeast | 4.3 | 2.8 | 2.8 | −4.8 (−6.2, −3.4) | 0.3 (−0.4, 0.9) |
| Midwest | 5.8 | 3.8 | 3.9 | −4.2 (−5.7, −2.8) | 0.4 (−0.0, 0.8) |
| South | 5.9 | 4.3 | 4.3 | −3.4 (−4.8, −2.1) | 0.4 (−0.0, 0.9) |
| West | 3.4 | 2.2 | 2.3 | −4.7 (−6.1, −3.3) | 1.2 (0.4, 2.0) |
| County‐level urbanization | |||||
| Urban | 4.7 | 3.2 | 3.2 | −4.4 (−5.5, −3.2) | 0.3 (−0.2, 0.7) |
| Rural | 6.5 | 4.7 | 5.0 | −3.4 (−4.7, −2.1) | 1.2 (0.3, 1.2) |
AAMR indicates age‐adjusted mortality rate, expressed as deaths/100 000 population; and APC, average annual percent change.
Figure 1.
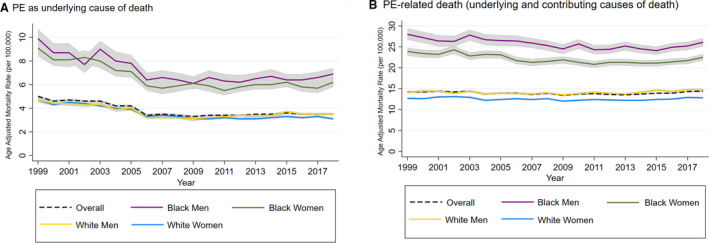
Trends in age‐adjusted mortality rates related to PE, overall and stratified by sex‐race groups in the United States, 1999 to 2018.
(A) PE as underlying cause of death; (B) PE‐related death (underlying and contributing causes of death). PE indicates pulmonary embolism.
When examining mortality rates by geographical areas, AAMRs were highest in the South region, compared with the Midwest, Northeast, and West across the study period (Table 1, Figure S1). In 1999, AAMR in the South region was 5.9, compared with AAMR of 5.8, 4.3, and 3.4 per 100 000 in the Midwest, Northeast, and West, respectively. In 2018, AAMR in the South was 4.3, compared with AAMR of 3.9, 2.8, and 2.3 per 100 000 population in the Midwest, Northeast, and West, respectively. APC mortality plateaued in the last decade across all census regions, with APC ranging from −3.4% (−4.8% to −2.1%) to −4.8% (−6.2% to −3.4%) from 1999 to 2008, compared with +0.3 (−0.4% to 0.9%) to +1.2% (0.4%–2.0%) from 2008 to 2018.
When analyzed by county‐level urbanization, rural settings had higher rates of AAMR compared with urban settings across the study period (Table 1). In 1999, AAMR in rural settings was 6.5, compared with 4.7 per 100 000 population for urban settings. Similarly, in 2018, AAMR in rural settings was 5.0, compared with 3.2 per 100 000 population for urban settings (Figure S2). Again, reversal of APC was observed across the study period in both urban and rural settings, with APC decreasing in the first decade, compared with a plateau or rising after 2008. Notably, APC was higher in rural settings compared with urban settings from 2008 to 2018 (APC 1.2% [0.3%–1.2%] versus 0.3% [−0.2% to 0.7%], respectively).
Older adults (ages >65 years) had higher absolute AAMR attributed to PE compared with younger adults (ages 25–64) across the study period (Table 1, Figure S3). However, younger adults, who comprised ≈36% of all deaths, experienced a greater relative change in mortality from PE, with APC of +2.1% (1.6%–2.6%) from 2008 to 2018 compared with −3.7% (−5.2% to −2.1%) from 1999 to 2008. Older adults had a plateau in mortality trends from PE over the study period, with APC of +0.3% (−0.7% to 0.2%) for 2008 to 2018 compared with −4.6% (−6.0% to −3.1%) from 1999 to 2008. In younger adults, all sex‐race groups showed reversal of trend from decreasing AAMR from 1999 to 2008 (APC −2.6% to −5.0% across sex‐race groups) to plateau or increase in AAMR from 2008 to 2018 (APC +1.0%–2.3% across sex‐race groups). Similarly, in older adults, APC plateaued across all sex‐race groups from 2008 to 2018 (−0.6% to 0.5% across sex‐race groups) compared with 1999–2008 (−4.7% to −5.1%).
In the secondary analysis, using data whereby PE was included as any mention on the death certificate as an underlying or contributing cause of death, we identified 586 288 deaths between 1999 and 2018. We found that the inflection point identified by Joinpoint occurred in 2013. As shown in Table 2, stagnant trends in APC were again observed in the latter part of the study period, with APC of −0.4% (−0.6% to −0.2%) from 1999 to 2013, compared with +1.3% (+0.9%–1.7%) from 2013 to 2018. Similarly, Black–White disparities in AAMR persisted when the data were analyzed using all death certificates with any mention of PE, with AAMR for Black men and women higher (26.1 and 22.5/100 000) than those for White men and women (14.8 and 12.8/100 000) in 2018 (Table 2).
Table 2.
Trends in Age‐Adjusted Mortality Rates Overall and by Sex‐Race Groups for Any Mention of Pulmonary Embolism as Cause of Death (Underlying or Contributing), 1999 to 2018
|
1999 AAMR |
2013 AAMR |
2018 AAMR |
1999–2013 APC (95% CI) |
2013–2018 APC (95% CI) |
|
|---|---|---|---|---|---|
| Overall | 14.2 | 13.5 | 14.4 | −0.4 (−0.6, −0.2) | 1.3 (0.9, 1.7) |
| Sex‐race groups | |||||
| Black women | 23.9 | 21.3 | 22.5 | −1.0 (−1.3, −0.7) | 1.1 (0.0, 1.7) |
| White women | 12.7 | 12.2 | 12.8 | −0.4 (−0.6, −0.2) | 1.2 (0.6, 1.8) |
| Black men | 28.0 | 25.2 | 26.1 | −0.8 (−1.1, −0.6) | 0.9 (−0.8, 2.5) |
| White men | 14.1 | 13.7 | 14.8 | −0.2 (−0.5, 0.0) | 1.4 (0.4, 2.4) |
AAMR indicates age‐adjusted mortality rate, expressed as deaths per 100 000 population; and APC, average annual percent change.
Discussion
Our findings provide contemporary nationwide estimates of trends in PE mortality over the past 18 years. Death rates from PE are increasing in adults over the past decade, reversing the decreasing trend from the prior decade. Notably, we saw this reversing trend, demonstrated by increasing APC, across all sex‐race, regional, and age subgroup analyses. While White men had the highest APC increase, the magnitude of AAMR for Black men and women was consistently higher than that for White men and women throughout the study period.
While historically, annual deaths from PE have been estimated to be ≈100 000, this number was extrapolated using the incidence of PE and applying historical case fatality rates, rather than using measured deaths. 4 Our study uses direct measures of mortality, and the data are consistent with estimates of annual PE‐related mortality for 2017 published by the American Heart Association. 5 In addition, these data are also consistent with recent reports demonstrating increased rates of hospitalization for PE. 6 , 7 , 8
The causes for the trends in PE‐attributable mortality remain unclear, and may be related to either increasing incidence, increased recognition and diagnosis, and/or increasing case fatality rate from PE. Prior reports indicate that case fatality is improving, suggesting that the change in incidence or diagnosis is more likely the cause. 9 While it has been hypothesized that the increase in diagnosis of and admission for PE may be related to increased awareness and greater diagnostic bias with increased use of computed tomography scans, 8 , 9 the use of computed tomography scans had already increased significantly by the mid‐2000s, and is unlikely to account for the reversing trend in the second decade of our study period. The growing burden of obesity, which has been hypothesized to be contributing to worsening cardiovascular mortality, may be contributing to increases in PE‐related AAMR as well. 10 While our de‐identified, cross‐sectional data are not able to address these causal questions, prior observational, longitudinal studies have demonstrated an association between obesity and cardiovascular health with PE. 11 Prevalence of obesity and poor cardiovascular health is disproportionately higher among Black adults, in the southern United States, and in rural regions, and may contribute to the observed heterogeneity in death rates across subgroups. While prior data have demonstrated Black–White disparities in the incidence of PE, 12 it is unknown whether our data showing consistently higher AAMR for Black adults compared with White adults are based on differences in the national incidence or in case fatality rates in the absence of a national surveillance system for cardiovascular diseases, including PE.
Premature preventable deaths from PE among younger and midlife adults (age 25–64 years) increased ≈23% over the second half of the study period between 2008 and 2018. The rise in PE‐mortality rates parallels the rise rates in all‐cause mortality in young and midlife adults as shown by Woolf et al. 13 The authors hypothesize that factors contributing to rising all‐cause mortality in midlife adults include deficiencies in healthcare systems, psychological distress, and socioeconomic pressures, 13 which are factors that may also contribute to mortality related to specific conditions, such as PE.
Strengths of the study include the use of a national data set capturing all death certificates in the United States. In addition, we leveraged the multiple cause of death files to allow for broader estimation of burden of mortality with any mention of PE in our secondary analysis. This is especially important because PE frequently contributes more proximately to death in other clinical conditions, such as to malignancy, which may be classified as underlying cause of death. We also had a large enough sample size to examine trends in sex‐race, geographical, and age subgroups in PE death rates. Limitations of our study include the use of death certificate data, which may be inaccurate if miscoded.
In conclusion, identifying the underlying drivers of these changing mortality trends and persistently observed disparities is necessary to mitigate the burden of PE‐related mortality, particularly premature preventable deaths in younger adults (<65 years).
Sources of Funding
This work was supported by grants from the American Heart Association (#19TPA34890060) and the NIH/National Heart, Lung, and Blood Institute (KL2TR001424) to Dr Khan. The content is solely the responsibility of the authors and does not necessarily represent the official views of the National Institutes of Health.
Disclosures
M. Cuttica reports speaking/consulting for Bayer, Actelion, United Therapeutics, and Gilead. K. Desai reports consulting/speaking for Boston Scientific, Cook Medical, Becton Dickinson/Bard, and consulting for W. L. Gore, Philips/Spectranetics, and Walk Vascular. The remaining authors have no disclosures to report.
Supporting information
Figures S1–S3
Acknowledgments
S. Khan and K. Martin had full access to all of the data in the study and take responsibility for the integrity of the data and accuracy of the data analysis. S. Khan, K. Martin, R. Molsberry, M. Cuttica, K. Desai, and D. Schimmel all contributed substantially to the study design, data analysis and interpretation, and writing of the manuscript.
J Am Heart Assoc. 2020;9:e016784 DOI: 10.1161/JAHA.120.016784.
For Sources of Funding and Disclosures, see page 5.
References
- 1. Goldhaber SZ, Bounameaux H. Pulmonary embolism and deep vein thrombosis. Lancet. 2012;379:1835–1846. [DOI] [PubMed] [Google Scholar]
- 2. Horlander KT, Mannino DM, Leeper KV. Pulmonary embolism mortality in the United States, 1979–1998: an analysis using multiple‐cause mortality data. Arch Intern Med. 2003;163:1711–1717. [DOI] [PubMed] [Google Scholar]
- 3. Tapper EB, Parikh ND. Mortality due to cirrhosis and liver cancer in the United States, 1999–2016: observational study. BMJ. 2018;362:k2817. [DOI] [PMC free article] [PubMed] [Google Scholar]
- 4. Office of the Surgeon General (US); National Heart, Lung, and Blood Institute (US) . The Surgeon General's Call to Action to Prevent Deep Vein Thrombosis and Pulmonary Embolism. Rockville, MD: Office of the Surgeon General (US); 2008. SECTION I: Deep Vein Thrombosis and Pulmonary Embolism as Major Public Health Problems. Available at: https://www.ncbi.nlm.nih.gov/books/NBK44181/. Accessed May 12, 2020. [PubMed] [Google Scholar]
- 5. Virani SS, Alonso A, Benjamin EJ, Bittencourt MS, Callaway CW, Carson AP, Chamberlain AM, Chang AR, Cheng S, Delling FN, et al. Heart disease and stroke statistics‐2020 update: a report from the American Heart Association. Circulation. 2020;141:e139–e596. [DOI] [PubMed] [Google Scholar]
- 6. Benjamin EJ, Muntner P, Alonso A, Bittencourt MS, Callaway CW, Carson AP, Chamberlain AM, Chang AR, Cheng S, Das SR, et al. Heart disease and stroke statistics‐2019 update: a report from the American Heart Association. Circulation. 2019;139:e56–e528. [DOI] [PubMed] [Google Scholar]
- 7. Pauley E, Orgel R, Rossi JS, Strassle PD. Age‐stratified national trends in pulmonary embolism admissions. Chest. 2019;156:733–742. [DOI] [PubMed] [Google Scholar]
- 8. Smith SB, Geske JB, Kathuria P, Cuttica M, Schimmel DR, Courtney DM, Waterer GW, Wunderink RG. Analysis of national trends in admissions for pulmonary embolism. Chest. 2016;150:35–45. [DOI] [PMC free article] [PubMed] [Google Scholar]
- 9. Wiener RS, Schwartz LM, Woloshin S. Time trends in pulmonary embolism in the United States: evidence of overdiagnosis. Arch Intern Med. 2011;171:831–837. [DOI] [PMC free article] [PubMed] [Google Scholar]
- 10. Shah NS, Lloyd‐Jones DM, O'Flaherty M, Capewell S, Kershaw KN, Carnethon M, Khan SS. Trends in cardiometabolic mortality in the United States, 1999–2017. JAMA. 2019;322:780–782. [DOI] [PMC free article] [PubMed] [Google Scholar]
- 11. Gregson J, Kaptoge S, Bolton T, Pennells L, Willeit P, Burgess S, Bell S, Sweeting M, Rimm EB, Kabrhel C, et al. Cardiovascular risk factors associated with venous thromboembolism. JAMA Cardiol. 2019;4:163–173. [DOI] [PMC free article] [PubMed] [Google Scholar]
- 12. White RH, Zhou H, Romano PS. Incidence of idiopathic deep venous thrombosis and secondary thromboembolism among ethnic groups in California. Ann Intern Med. 1998;128:737–740. [DOI] [PubMed] [Google Scholar]
- 13. Woolf SH, Schoomaker H. Life expectancy and mortality rates in the United States, 1959–2017. JAMA. 2019;322:1996–2016. [DOI] [PMC free article] [PubMed] [Google Scholar]
Associated Data
This section collects any data citations, data availability statements, or supplementary materials included in this article.
Supplementary Materials
Figures S1–S3