

Abstract
Background
The significance of endo‐epicardial asynchrony (EEA) and atrial conduction block (CB), which play an important role in the pathophysiology of atrial fibrillation (AF) during sinus rhythm is poorly understood. The aim of our study was therefore to examine 3‐dimensional activation of the human right atrium (RA).
Methods and Results
Eighty patients (79% men, 39% history of AF) underwent simultaneous endo‐epicardial sinus rhythm mapping of the inferior, middle and superior RA. Areas of CB were defined as conduction delays of ≥12 ms, EEA as activation time differences of opposite electrodes of ≥15 ms and transmural CB as CB at similar endo‐epicardial sites. CB was more pronounced at the endocardium (all locations P<0.025). Amount, extensiveness and severity of CB was higher at the superior RA. Transmural CB at the inferior RA was associated with a higher incidence of post‐operative AF (P=0.03). EEA occurred up to 84 ms and was more pronounced at the superior RA (superior: 27 ms [interquartile range, 18.3–39.3], versus mid‐RA: 20.3 ms [interquartile range, 0–29.9], and inferior RA: 0 ms [interquartile range, 0–21], P<0.001). Hypertension (P=0.009), diabetes mellitus (P=0.018), and hypercholesterolemia (P=0.015) were associated with a higher degree of EEA. CB (P=0.007) and EEA (P=0.037) were more pronounced in patients with a history of persistent AF compared with patients without AF history.
Conclusions
This study provides important insights into complex atrial endo‐epicardial excitation. Significant differences in conduction disorders between the endo‐ and epicardium and a significant degree of EEA are already present during sinus rhythm and are more pronounced in patients with cardiovascular risk factors or a history of persistent AF.
Keywords: atrial fibrillation, cardiac mapping, electropathology, electrophysiology
Subject Categories: Electrophysiology, Atrial Fibrillation
Nonstandard Abbreviations and Acronyms
- AF
atrial fibrillation
- CB
conduction block
- CD
conduction delay
- EEA
endo‐epicardial asynchrony
- LA
left atrium
- RA
right atrium
- SR
sinus rhythm
- TAT
total activation time
Clinical Perspective
What Is New?
At present, this is the largest right atrial simultaneous endo‐epicardial mapping study performed in patients undergoing cardiac surgery.
Significant differences in atrial conduction disorders between the endo‐ and epicardium and a considerable degree of endo‐epicardial asynchrony are present during sinus rhythm.
Interestingly, the presence of cardiovascular risk factors and a history of atrial fibrillation enhance electrical disturbances in the atria.
What Are the Clinical Implications?
Our findings highlight the complex nature of atrial excitation.
The present study demonstrates that endo‐epicardial asynchrony is most likely a physiological phenomenon, which is aggravated by atrial fibrillation and the presence of cardiovascular risk factors.
Endo‐epicardial mapping provides mechanistic insights into atrial excitation during sinus rhythm and may be useful for guiding patient tailored therapy of atrial fibrillation.
Mapping of atrial excitation is usually performed at either the endo‐ or epicardium, assuming that electrical conduction in the 2‐dimensional plane is representative of transmural excitation. However, prior mapping studies demonstrated that the endo‐ and epicardial layers are excited asynchronously not only during atrial fibrillation (AF) but also during sinus rhythm (SR). 1 , 2 , 3 , 4 This endo‐epicardial asynchrony (EEA) favors transmural propagation of fibrillation waves resulting in so‐called focal waves in the opposite layer, thereby perpetuating the fibrillatory process. A certain degree of EEA is a requisite for the occurrence of transmural conduction and is promoted by difference in conduction disorders between the endo‐ and epicardial plane.
Previous studies have demonstrated that conduction disorders, mainly longitudinal dissociation in conduction, are associated with genesis and perpetuation of atrial tachyarrhythmias such as AF. 5 , 6 Several mapping studies demonstrated that conduction disorders in the epicardial plane play a key role in the pathophysiology of AF. 6 , 7 , 8 , 9 , 10 It is most likely that when conduction disorders occur in either the 2‐dimensional endo‐ or epicardial plane, they also occur in the 3‐dimensional plane, thus transmurally. The first step in understanding “3‐dimensional” atrial excitation is to investigate transmural conduction during SR. However, there are at present no techniques enabling direct assessment of transmural conduction disorders in the in vivo human heart. The aim of our study was therefore to investigate the correlation between features of conduction disorders assessed in the endo‐ and epicardial plane and the degree of EEA by conducting high‐resolution simultaneous endo‐epicardial mapping studies in patients undergoing cardiac surgery.
Methods
The data that support the findings of the present study are available from the corresponding author on reasonable request.
Study Population
The study population consisted of 80 patients undergoing elective primary open heart surgery in the Erasmus Medical Center Rotterdam. Patients underwent either coronary artery bypass surgery, valve surgery or a combination of both. If indicated, patients with a history of AF underwent concomitant AF ablation. Patients with hemodynamic instability, atrial paced rhythm, previous open cardiac surgery, severe liver, or renal failure or severely impaired left ventricular function were excluded from the study. This study was approved by the institutional medical ethics committee (MEC2015‐373), and written informed consent was obtained from all patients. The study was performed according to the principles of the Declaration of Helsinki. Patient characteristics were obtained from electronic medical files.
Simultaneous Endo‐Epicardial Mapping of the Right Atrium
Trained and experienced cardiothoracic surgeons performed simultaneous endo‐epicardial high‐resolution mapping before commencement to extra‐corporal circulation, as previously described in detail. 11 Two electrode arrays, each containing 128 electrodes with an electrode diameter of 0.45 and 2 mm inter‐electrode spacing, were firmed on 2 bendable spatulas and positioned on the exact opposite side of each other. After heparinization and arterial cannulation, a temporary bipolar epicardial pacemaker wire was stitched to the free wall of the right atrium (RA) and served as a temporal reference electrode. The indifferent electrode was connected to a steel wire which was stitched to the subcutaneous tissue of the thoracic wall. Then a purse string suture was placed in the right atrial appendage for venous cannulation. Before venous cannulation, 1 spatula (marked as the endocardial electrode array) was introduced in the RA after incising the right atrial appendage and the incision site was closed with the purse string suture. Simultaneous endo‐epicardial mapping was performed following a predefined mapping scheme with 3 different locations on the RA‐free wall: (1) superior RA, (2) mid‐RA, and (3) inferior RA, as depicted in Figure 1A. During the mapping procedure, real‐time electrograms were visualized on multiple screens to enable intraoperative evaluation of the electrograms. Simultaneous endo‐epicardial mapping was performed for 5 seconds during SR, and included a surface ECG lead, a calibration signal of 2 mV and 1000 ms, a bipolar reference electrogram and all endo‐ and epicardial unipolar electrograms. Recordings were sampled with a rate of 1 kHz, amplified (gain 1000), filtered (bandwidth 0.5–400 Hz), analog‐to‐digital converted (16‐bits) and stored on a secured hard disk.
Figure 1. Simultaneous endo‐epicardial mapping of the right atrium.
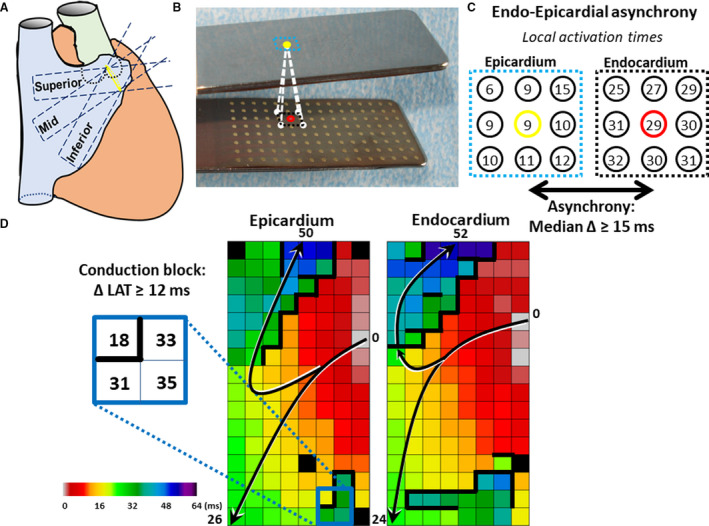
A, Two spatulas with 128‐electrode arrays (Ø electrode=0.4 mm, interelectrode distance=2 mm) are fixed together, 1 spatula is introduced into the right atrium through the incision for venous cannulation and one spatula is positioned on the opposite epicardial surface. Unipolar electrogram recordings are recorded at 3 mapping locations: (1) the superior caval vein (superior), (2) the inferior caval vein (inferior) and in between, (3) the terminal crest (mid). B, In the mapping clamp with endo‐ and epicardial electrode arrays, exact opposite electrodes are marked with yellow or red dots. The surrounding 8 electrodes are marked with black or blue squares. These electrodes are enlarged in C. C, The local activation times of direct opposite and its 8 surrounding electrodes are shown. Differences in local activation time between the reference electrode and the 9 opposite electrodes are calculated for the endo‐ and epicardium. Endo‐epicardial asynchrony was defined as a median time delay ≥15 ms. D, The arrows in the activation maps of the epi‐ and endocardium indicate the main direction of the propagating wavefronts. The conduction map indicates lines of conduction block (CB) (>12 ms) marked by thick lines. Different areas of CB, depicted by thick black lines, are observed in both the epi‐ and endocardium at the same location (<2 mm), indicative of “transmural” CB.
Mapping Data Analysis
Mapping data was analyzed using semi‐automatized custom‐made Python 3.6 software. Activation maps of both the epicardial and the endocardial layer were constructed by annotating the steepest negative slope of atrial potentials recorded at every electrode. Premature atrial complexes, electrograms with injury potentials, and recordings with ≥30% poor quality electrograms were excluded from analysis by consensus of 2 investigators.
Endo‐Epicardial Asynchrony
As demonstrated in Figure 1B and 1C, local endo‐epicardial activation time differences were determined by selecting the median of the time delays within the exact opposite electrode and its 8 surrounding electrodes resulting in an epicardial and endocardial asynchrony map. The combined asynchrony map shows the longest time delay for every endo‐epicardial electrode pair. Consistent with prior mapping studies, EEA was defined as transmural difference in electrical activation of ≥15 ms between every endo‐epicardial electrode pair. 3 , 4 Total amount of EEA during the entire recording period was calculated as a percentage of the total mapping area.
Total activation times (TAT), for both the endo‐ and the epicardium, were calculated by the differences in activation time between the first and latest activated electrode; only mapping recordings with ≥95% marking were included for this specific analysis. All activation maps and calculations were manually checked by 2 investigators.
Conduction Disorders
Consistent with prior epicardial mapping studies, areas of conduction delay (CD) and conduction block (CB) were defined as interelectrode differences in local activation times of, respectively, 7 to 11 ms and ≥12 ms corresponding with effective conduction velocities of 18 to 28 cm/s for CD and <18 cm/s for CB. 6 Areas of uninterrupted CD and CB lines were defined as continuous CDCB lines. In addition, the median and longest length of all CB and continuous CDCB lines were calculated for analyses. The amount of CB and continuous CDCB was calculated as a percentage of the total mapping area. Transmural CB was defined as lines of CB in both layers with a horizontal spatial difference of ≤2 mm. An example of transmural CB is depicted in Figure 1D.
Statistical Analysis
Normally distributed continuous variables were expressed as mean±SD and skewed variables as median with interquartile range (IQR). Categorical data were presented as numbers and percentages and compared with the Chi‐squared test. Wilcoxon signed‐rank test or Kruskal–Wallis test was used to compare continuous parameters between the mapping locations. Friedman test was used to investigate the associations between mapping location (independent variable) and electrophysiological parameters (dependent variable). Comparison of conduction disorders in the endo‐ and epicardial was performed with the Wilcoxon signed rank test. Association of clinical characteristics and electrophysiological parameters were analyzed with the Wilcoxon rank sum test. Spearman rho coefficient was used to determine the correlation between conduction disorders and EEA. A P value of <0.05 was considered statistically significant. Statistical analyses were performed using IBM SPSS Statistics version 21 (IBM Corp, Armonk, NY).
Results
Study Population
Baseline characteristics of the 80 enrolled patients (79% men, aged 66±9 years) are summarized in Table. Patients were categorized by underlying heart disease; ischemic heart disease (n=38, 48%), valvular heart disease (n=23, 29%), or a combination of ischemic/valvular heart disease (n=18, 23%). One patient underwent lone surgical AF ablation. A total of 31 patients had a history of AF, including paroxysmal (n=25, 31%), persistent (n=4, 5%), and longstanding persistent (n=2, 3%). Postoperative AF occurred in 30 patients (37.5%). Left atrial dilatation was present in 27 patients (34%) and the majority of the patients had normal left ventricular function (n=55, 69%).
Table.
Patient Characteristics
| No. of Patients | 80 |
| Age (y) | 66.4±9.0 (range, 46.7–85.5) |
| Men | 63 (78.8) |
| BMI (kg/m2) | 28.2±4.5 (range, 17.4–39.5) |
| Underlying heart disease | n (%) |
| IHD | 38 (47.5) |
| VHD | 23 (28.8) |
| I/VHD | 18 (22.5) |
| Valvular heart disease | 37 (46) |
| MVD | 25 (31.3) |
| AVD | 20 (25.0) |
| TVD | 5 (6.3) |
| History of AF | 31 (38.8) |
| Paroxysmal | 25 (31.3) |
| Persistent | 4 (5.0) |
| Longstanding persistent | 2 (2.5) |
| Cardiovascular risk factors | |
| Hypertension | 51 (63.8) |
| Hypercholesterolemia | 41 (51.3) |
| Diabetes mellitus | 27 (33.8) |
| Left ventricular function | |
| Normal | 55 (68.8) |
| Mild dysfunction | 13 (16.3) |
| Moderate dysfunction | 11 (13.8) |
| Severe dysfunction | 1 (1.3) |
| Right atrial dilatation | 5 (6.3) |
| Antiarrhythmic drugs | 65 (81.3) |
| Class I | 2 (2.5) |
| Class II | 56 (70.0) |
| Class III | 6 (7.5) |
| Class IV | 7 (8.8) |
| Digoxin | 8 (10) |
AF indicates atrial fibrillation; AVD, aortic valve disease; BMI, body mass index; I/VHD, ischemic and valvular heart disease; IHD, ischemic heart disease; MVD, mitral valve disease; TVD, tricuspid valve disease; and VHD, valvular heart disease.
Mapping Data
A total of 80 inferior, 80 mid‐, and 73 superior RA recordings including 337.094 atrial electrograms were of adequate quality for analysis. This yielded in 1395 SR activation maps with a median SR cycle length of 888 ms (IQR, 756–1016) which did not differ between the various mapping locations (all P>0.61). Only for TAT analysis, 74 mapping locations (32%) were excluded as <95% of the mapping area was activated.
Differences in Prevalence of Endo‐ and Epicardial Conduction Disorders
There was no difference in TAT of opposite endocardial and epicardial mapping locations (endocardium: 32 ms [IQR, 25–40], epicardium: 32 ms [IQR, 26–39], all P>0.609). However, TAT at both the endo‐ and epicardium separately was longest at superior RA (endocardium TAT: inferior: 30.5 ms [IQR, 25–38.6] mid‐: 30 ms [IQR, 24–37.8], superior: 37 ms [IQR, 28–44.5] P=0.006, epicardium TAT: inferior: 30 ms [IQR, 25.4–35] mid‐: 31 ms [IQR, 24–40.8] superior: 37 ms [IQR, 31–41], P<0.001).
Figure 2 illustrates the amount of CB (in percentage of the mapping area) for all endo‐ and epicardial mapping locations separately; locations are ranked according to amount of CB in each layer. At the epicardium, the prevalence of CB ranged from 0% to 19.2% (median, 1.1%) and 24.1% of the locations did not contain any lines of CB. At the endocardium, the prevalence of CB ranged from 0% to 21.6% (median, 1.9%) and lines of CB were absent at only 17.2% of the locations. The prevalence of continuous CDCB for the epi‐ and endocardium was, respectively, 1.8% [IQR, 0–5.5] and 3.05% [IQR, 0.4–7.2].
Figure 2. Spatial distribution of atrial conduction disorders.
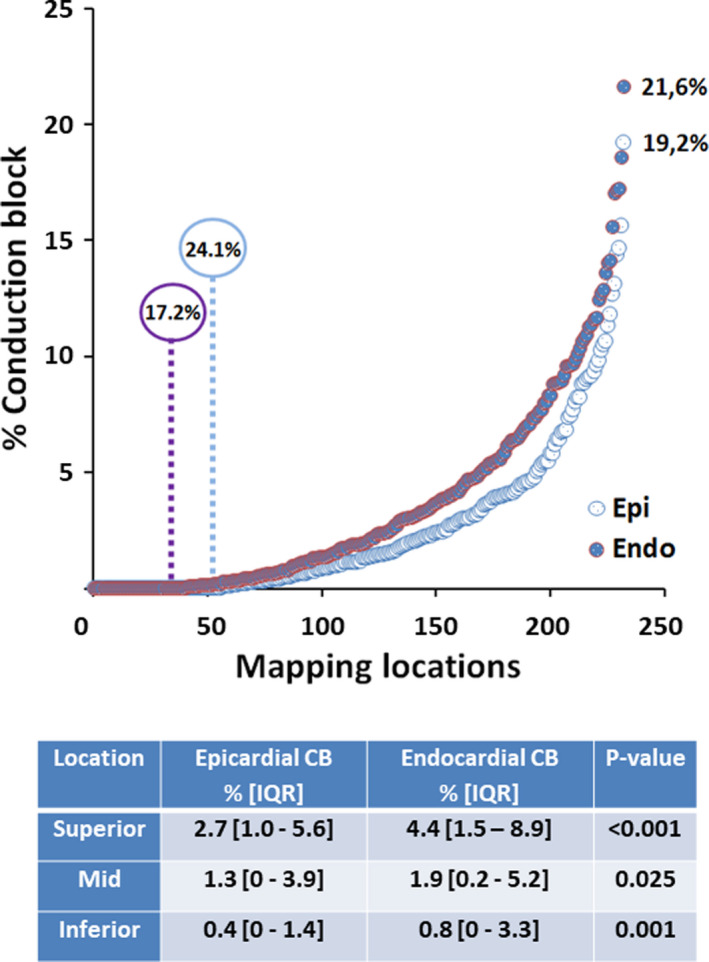
Upper panel: Amount of CB for all endo‐ and epicardial mapping locations separately. The highest amount of CB at the endo‐ and epicardium was, respectively, 21.6% and 19.2%. No CB in either the endo‐ or epicardium occurred in, respectively, 17.2% and 24.1% of all patients. Lower panel: Amount of CB in the endo‐ and epicardial plane for each mapping location separately. The endocardium had significant more CB at each mapping location. CB indicates conduction block; and IQR, interquartile range.
The table in Figure 2 demonstrates the amount of CB in the endo‐ and epicardial plane for the 3 different mapping locations separately. At every location, the amount of CB was highest at the endocardium compared with the epicardium (all P<0.025). Comparing the 3 different locations, the highest amount of CB (4.4% [IQR, 1.5%–8.9%]) occurred at the superior RA endocardium. Similar findings were observed for continuous CDCB; CB was most often observed at the RA superior endocardium (5.2% [IQR, 2%–11.9%], P=0.027). The activation maps of the endo‐ and epicardium, which are depicted on the left and middle panel of Figure 3, clearly demonstrate differences in CB (thick black lines) between adjacent layers.
Figure 3. Endo‐epicardial activation patterns.
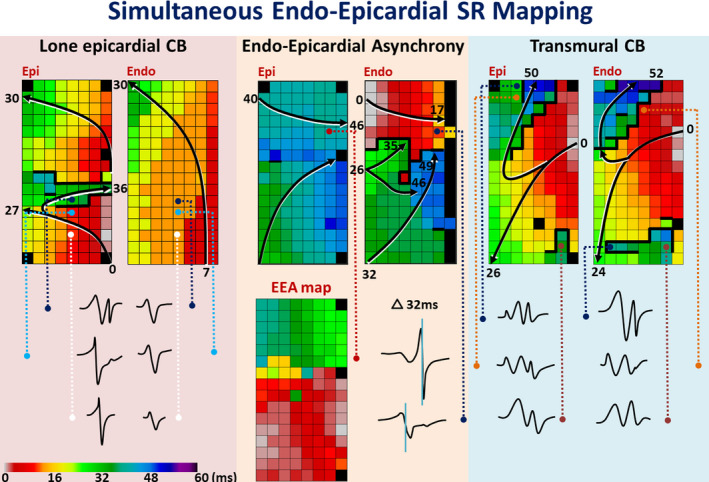
Examples of color coded activation maps demonstrating differences in activation between the endo‐ and epicardium including differences in local electrograms. The arrows display that the main wave trajectories and local activation times are depicted near the head and tail. Thick black lines indicate lines of conduction block. The endo‐epicardial asynchrony map (delay ≥15 ms), shows the time delay assessed at every coupled recording site. CB indicates conduction block; EEA, endo‐epicardial asynchrony; and SR, sinus rhythm.
The total amount of conduction disorders at both the endo‐epicardium combined was higher at the superior RA in patients with hypertension compared with patients without hypertension (CB; P=0.046, 4.3% [IQR, 1.9%–8.5%] versus 2.9% [IQR, 1%–5.2%], CDCB; P=0.027, 6.4% [IQR, 2.5%–10.6%] versus 3% [IQR, 1.4%–5.7%].
Differences in Extensiveness of Endo‐ and Epicardial Conduction Disorders
Examples of color‐coded activation maps shown in Figure 3 demonstrate that areas of CB and continuous CDCB may vary from short scattered short lines to long continuous lines. Length of CB and continuous CDCB lines at the epicardium were, respectively, 3 mm (IQR, 2–6) and 8 mm (IQR, 0–14) whereas at the endocardium, lines of CB and continuous CDCB were, respectively, 4 mm (IQR, 2–6) and 10 mm (IQR, 6–15). Comparing the endo‐ and epicardium, lengths of both CB and continuous CBCD lines were solely significantly longer at the inferior RA endocardium (CB, 3 mm [IQR, 0–5] versus 2 mm [IQR, 0–4], P=0.013; CDCB 8 mm [IQR, 0–13.75] versus 5.5 mm [IQR, 0–10], P=0.007). In patients with hypertension, the length of all endo‐ and epicardial CB lines were again longer at both the superior (P=0.018, 5 mm [IQR, 4–7] versus 4 mm [IQR, 2–6]) and inferior (P=0.036, 4 mm [IQR, 2–6] versus 2 mm [IQR, 0–3.5]) location. However, lengths of continuous CDCB lines were longer in patients with hypertension at only the superior RA (P=0.023, 14 mm [IQR, 10–18] versus 10 mm [IQR, 8–14.3]). Patients with hypercholesterolemia (P=0.013, 4 mm [IQR, 2–6] versus 2 mm [IQR, 0–4]) or diabetes mellitus (P=0.025, 4 mm [IQR, 2–6] versus 2 mm [IQR, 1.5–4]) also had significant longer CB lines at the inferior RA.
Severity of Conduction Block in the Endo‐ and Epicardium
The upper panel of Figure 4 demonstrates all conduction times (n=598 808) measured between neighboring electrodes of the 3 different endo‐ and epicardial mapping locations combined. Of all CTs, 3% was ≥12 ms indicating CB.
Figure 4. Characteristics of atrial conduction disorders.
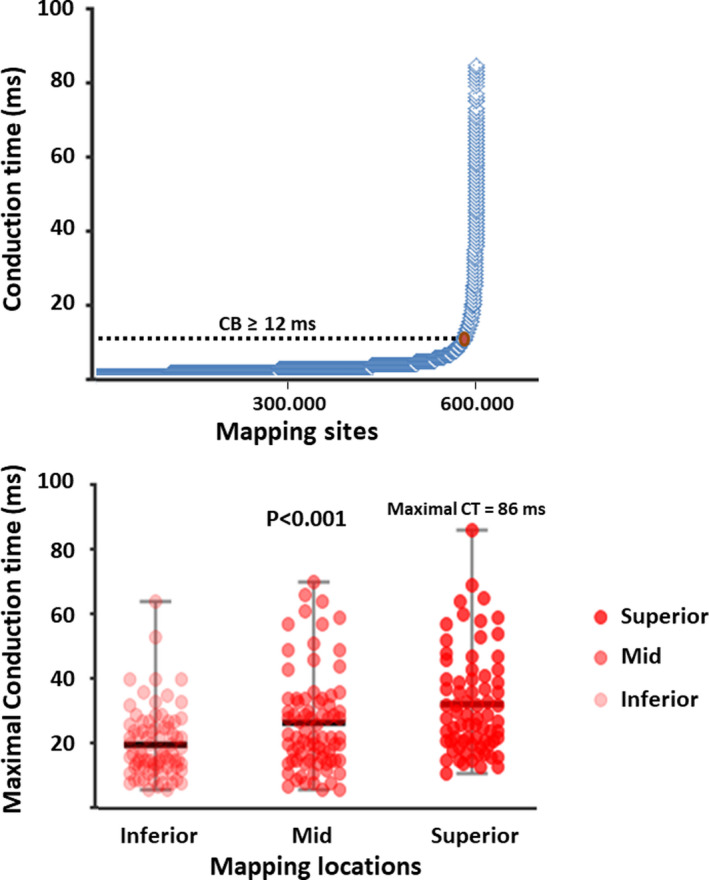
Upper panel: Distribution of all conduction times measured at the 3 mapping locations. Of all 598.808 conduction times, only 3% (n=17.965) was ≥12 ms (cut‐off value for CB). The maximal conduction time between 2 neighboring electrodes measured in our population was 86 ms. Lower panel: Distribution of maximal conduction times, indicating the severity of conduction block, for each mapping location separately. Conduction block was most severe at the superior right atrial location (28 ms [IQR, 21–40.5], P<0.001). CB indicates conduction block; and CT, conduction time.
The lower panel of Figure 4 shows the maximal conduction times obtained from every patient at each of the 3 mapping locations separately. The severity of CB was highest at the superior RA (P<0.001, inferior: 17 ms [IQR, 13–25], mid‐: 22 ms [IQR, 15–33.8], superior: 28 ms [IQR, 21–40.5]). However, in patients with hypertension and hypercholesterolemia, most severe CB occurred at the inferior RA (respectively, P=0.037 at 20 mm [IQR, 14–27] versus 15 mm [IQR, 11–23], and P=0.010 at 20 mm [IQR, 14.5–27] versus 15 mm [IQR, 11–22]).
Transmural Conduction Block
The right panel of Figure 3 shows color‐coded activation maps of both the endo‐and epicardium. The distal part of the mapping arrays (distal in regard to the incision) clearly demonstrates an oblique line of CB which can be observed at both the endo‐ and epicardium and is therefore most likely transmurally present. Transmural CB depicted at the proximal part of the mapping arrays is also present in both layers, however the area of CB is more extensive at the endocardium. The incidence of this so‐called transmural CB also increased from inferior to superior RA (inferior RA, 26.3%; mid‐RA, 39.2%; and superior RA, 57.5% of the patients, P<0.001). Transmural CB at the inferior, relative thin, RA appeared to be associated with a higher risk of postoperative AF (P=0.03).
Endo‐Epicardial Asynchrony
The middle panel of Figure 3 shows an example of color‐coded activation maps of adjacent endo‐ and epicardial layers. Both layers were activated within 52 ms and in the middle of the mapping area, a long line of CB (thick black line) can only be observed at the endocardium. The corresponding EEA map shows that EEA is highly prevalent in the upper part of the mapping area during SR and occurred up to 44 ms in this patient. Electrograms recorded from 2 opposite electrodes clearly demonstrate the differences in local activation times (32 ms).
The prevalence of EEA measured at the 3 different mapping locations together is shown in Figure 5. Of all mapping locations, EEA was observed in 67.4%. EEA was absent in 52.5%, 33.8%, and 15.1% of, respectively, the inferior, mid‐, and superior location. Hence, the prevalence of EEA was highest at the superior RA (84.9% of the patients, P<0.001). The median delay, indicating the degree of EEA, between both layers was highest at the superior RA (superior: 17.5 ms [IQR, 16–21.75] versus mid‐: 17 ms [IQR, 0–20], and inferior: 0 ms [IQR, 0–17], P<0.001). The largest delay in activation time between the endo‐ and epicardium was also highest at the superior RA (superior: 27 ms [IQR, 18.3–39.3] versus mid‐: 20.3 ms [IQR, 0–29.9] and inferior: 0 ms [IQR, 0–21], P<0.001).
Figure 5. Prevalence and degree of endo‐epicardial asynchrony.
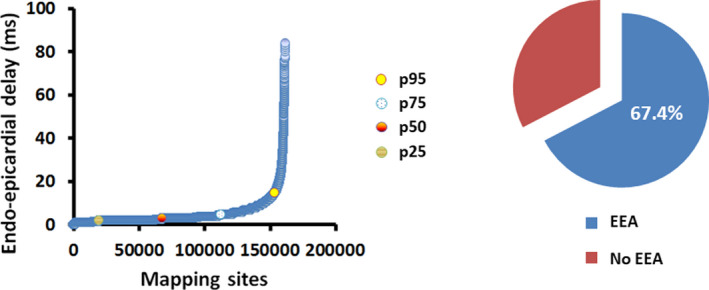
Left panel: Relative distribution of all endo‐epicardial delays (n=161 650) of all local mapping sites, ranked according to degree of endo‐epicardial delay; 5% of all measurements were above the cut‐off value of 15 ms. Right panel: The pie chart shows the percentage of all locations with endo‐epicardial asynchrony in the entire study population. EEA indicates endo‐epicardial asynchrony.
The left panel of Figure 5 shows the relative distribution of all endo‐epicardial delay times (n=161 650) in the entire study population, ranked according to the degree of endo‐epicardial delay. The far majority of all measurements, namely 95% of all endo‐epicardial delay times (n=153 568), was below the EEA cut‐off value of 15 ms. However, the maximal degree of EEA measured during SR at the inferior, mid‐, and superior RA ranged from 61 ms at the inferior RA up to 84 ms at the superior RA. Patients with hypertension (P=0.009, 0.3% [IQR, 0%–3.4%] versus 0% [IQR, 0%–0.4%]), diabetes mellitus (P=0.018, 1% [IQR, 0%–4.8%] versus 0% [IQR, 0%–1%]) and hypercholesterolemia (P=0.015, 0.7% [IQR, 0%–3.4%] versus 0% [IQR, 0%–0.5%]) had a significantly higher degree of EEA at the inferior mapping location compared with patients without these cardiovascular risk factors.
Both the incidence (inferior RA, r=0.78; mid‐RA, r=0.84; and superior RA, r=0.87, all P<0.001) and severity (inferior RA, r=0.69; mid‐RA; r=0.83; and superior RA, r=0.82, all P<0.001) of CB in the endo‐ and epicardium together correlated with the incidence of EEA at every location.
Influence of AF history on conduction disorders and EEA
Comparing endo‐epicardial conduction disorders as described above during SR between patients with no AF history (n=49), paroxysmal AF (n=25) and (longstanding) persistent AF (n=6) resulted in differences solely observed at the inferior RA mapping location. Patients with (longstanding) persistent AF showed more endo‐epicardial CB (median, 3.9% [IQR, 1.9%–5.9%] versus 0.8% [IQR, 0.2%–2.0%], P=0.007), continuous CDCB (median, 6.5% [IQR, 3.7%–11.5%] versus 1.0% [IQR, 0.2%–3.5%], P=0.001) and incidence of EEA (median, 2.5% [IQR, 0.5%–6.2%] versus 0% [IQR, 0%–1.2%], P=0.037) compared with patients with no history of AF. In addition, median and longest length of continuous CDCB lines in the inferior RA were also longer in these patients (median length, 15.5 mm [IQR, 11.5–20.25] versus 8 mm [IQR, 0–12], P=0.005; longest length, 28 mm [IQR, 21–54.5] versus 12 mm [IQR, 6–22] P=0.004).
Discussion
Key Findings
High resolution simultaneous endo‐epicardial SR mapping of the RA in patients with structural heart disease revealed that conduction disorders were more pronounced at the endocardium than the epicardium, particularly at the superior intercaval region. Length of these CB lines was longer in patients with presence of cardiovascular risk factors. A significant degree of EEA is already present during SR, up to 61 ms in the thin inferior RA and up to 84 ms in the thick superior RA, and is also associated with the presence of cardiovascular risk factors. Significant more conduction disorders and EEA are present in patients with persistent AF compared with patients without history of AF.
Superior Intercaval Region: A Predilection Site for Conduction Disorders
It is generally assumed that the complex architecture and anatomy of the RA plays an important role in atrial conduction and arrhythmogenesis. In line with previous endo‐ and/or epicardial mapping studies, conduction disorders occurred more frequently at the superior intercaval region compared with the rest of the RA. 4 , 12 , 13 However, our study was the first to simultaneously measure conduction disorders in both layers demonstrating that conduction disorders occur more frequently at the endocardium than at the epicardium. Heterogeneity of the RA endocardial architecture with discontinuous pectinate muscles transversally originating from the terminal crest may favor this non‐uniform spread of activation. 14 , 15 In contrast to the endocardium, the epicardial layer is more a continuum of cardiomyocytes which may favor smooth atrial conduction. These morphological differences between both layers result in variability in atrial wall thickness and muscle fiber orientation. It is reasonable to assume that differences in conduction disorders between the endo‐ and epicardium are more likely to occur in thicker parts of the atria containing more diversity in fiber orientation.
The terminal crest is an embryological demarcation where the sinus venosus merged with the primitive trabeculated RA, possibly also explaining higher susceptibility for conduction disorders in the superior RA. 16 Anatomical features (eg, sinus node cells, vessels, or epicardial fat) of the superior intercaval region interrupting the smooth muscular structure may also impair atrial conduction resulting in a higher incidence of conduction disorders at this specific site. 17 , 18 , 19
Endo‐Epicardial Asynchrony
The concept of EEA stems from the early 90s, when Schuessler et al. performed simultaneous endo‐epicardial mapping of isolated canine atria and demonstrated an increase of EEA during atrial tachyarrhythmias compared with SR. 1 EEA particularly occurred at the superior, relatively thick RA. Eckstein et al. performed simultaneous endo‐epicardial mapping of the left atrium (LA) in goats during SR and acute AF, after 3 weeks and after 6 months of AF. 2 Almost no EEA was observed during SR, but it did increase hand in hand with AF duration and occurred up to 50 ms. EEA occurred more often at thicker parts of the LA. The occurrence of EEA in especially thick parts of the atria and the association with AF persistence correspond with our findings and also with prior mapping studies examining the RA. 3 , 6 The endo‐ and epicardium of relative thin parts of the atria, for example in between 2 pectinate muscles, are more likely to be activated simultaneously. However, as an inevitable effect of intraoperative in vivo mapping, we were unable to correlate degree of EEA with the exact thickness of the atrial wall.
Our study clearly demonstrates that even during SR, EEA may occur to a significant degree. Therefore, it can be concluded that EEA is not an epiphenomena which is related to rapid activation during AF only. However, in accordance with mapping studies showing an increase of EEA during induced AF, rapid activation during AF may enhance EEA. The present study also demonstrates that EEA may even occur in patients without history of AF. These findings imply that EEA during SR may be a “physiological” phenomena which may aggravate by AF. Recently, our research group extended these observations to humans and provided the first evidence of EEA for both, the RA and LA. 3 , 20 Simultaneous endo‐epicardial mapping of the human LA during SR revealed occurrence of EEA up to 44 ms in the patient with the longest history of AF. 20 Hence, EEA can occur anywhere in both atria. This is in line with observations in prior epicardial mapping studies demonstrating that focal breakthrough waves, which may arise due EEA, occurred throughout both atria without any predilection sites. 21 During AF, we observed that focal breakthrough waves occurred more often in patients with persistent AF compared with acute AF (respectively, median 0.46 per cycle per cm2 versus 0.12, P<0.0001). 6
From an anatomical perspective, asynchronous activation of the endo‐ and epicardium is more likely to occur in thicker parts of the atria, which is in line with results of the present study and previous data. 1 , 2 , 4 However, as already suggested by Schuessler et al., thin parts of the atria are more susceptible to undergo remodeling under pathological circumstances such as pressure/volume overload and cardiovascular risk factors (hypertension, diabetes mellitus, and hypercholesterolemia) affecting the microvasculature and hence function cardiomyocytes. 1 The present study demonstrates that a considerable degree of EEA up to 61 ms is also present in the thinner RA wall (inferior mapping location). Eckstein et al. observed, with persistence of AF (acute AF to 6 months of AF), a decrease in LA wall thickness and increase in EEA. 2 These findings implicate that the absolute thickness of the atrial wall together with the degree of electrical and structural remodeling are important for the occurrence of EEA. Our study provides the first evidence for enhancement of EEA by cardiovascular risk factors.
The fact that EEA increases from induced to persistent forms of AF substantiates that EEA is important for the persistence of AF. The increase in dissociation between both layers may result in fragmentation of fibrillation waves which stabilizes the fibrillatory process because as soon as fibrillation waves die out, they can be “replaced” by fibrillation waves from the opposite layer and vice versa. 3 , 6
Effect of AF History on Conduction Disorders and Endo‐Epicardial Asynchrony
Previous mapping studies demonstrated that incidence of conduction disorders, breakthrough waves, and EEA increase hand in hand with duration of AF. 2 , 3 , 6 These AF‐induced electropathological alterations increase the complexity of the activation patterns and provide a substrate for transmural propagation. 22 , 23 , 24 , 25 Electropathological alterations go together with structural remodeling, such as interstitial fibrosis and remodeling in gap junctions. 2 , 26 , 27 , 28 , 29 It is most likely that remodeling takes not only place in the endo‐ or epicardium but also transmurally. It can therefore be assumed that these structural changes in the atrial wall of patients also disrupt transmural conduction during SR. To date, this has only been demonstrated during AF, however this study provides the first evidence of increased incidence of conduction disorders and EEA in patients with persistent AF already during SR.
Limitations
An inevitable effect of intraoperative in vivo mapping in humans, is that the underlying anatomy such as variability in atrial wall thickness and the degree of trabeculation cannot be retrieved. Therefore, we were unable to correlate the exact underlying anatomy with the mapping data. Simultaneous endo‐epicardial mapping was only performed of the RA in patients undergoing open heart surgery, thereby precluding the LA. However, we recently provided in a pilot study the first proof of EEA in the human LA. 20 Simultaneous endo‐epicardial mapping of the RA and LA is needed as well to gain further insights in the exact role of EEA in the arrhythmogenic substrate of AF. Obtaining SR in patients with (longstanding) persistent AF is challenging and in most cases not successful. This yielded a limited number of SR recordings from patients with a history of (longstanding) persistent AF. Echocardiographic data of sufficient quality to accurately determine RA volume were limited. Therefore, we could not correlate RA volume with conduction disorders and EEA.
Conclusions
Conduction disorders and EEA during SR appear to be most prevalent at the superior RA. Moreover, conduction disorders are more prevalent at the endocardium compared with the epicardium. The presence of cardiovascular risk factors was associated with longer lengths of CB lines at the inferior and superior RA. A significant degree of EEA may already present during SR. In patients with cardiovascular risk factors EEA was more pronounced. SR recordings of patients with persistent AF show more conduction disorders and EEA compared with SR recordings of patients without a history of AF. These findings provide unique insights in complex relationship between atrial excitation and arrhythmogenesis which needs to be further unraveled during AF to improve (ablative) AF therapy.
Sources of Funding
Prof Dr NMS de Groot is supported by funding grants from CardioVasculair Onderzoek Nederland – Atrial Fibrillation Fingerprinting (CVON‐AFFIP, grant number 914728), Nederlandse organisatie voor Wetenschappelijk onderzoek (NWO‐Vidi, grant number 91717339), Biosense Webster USA (ICD 783454) and Medical Delta.
Disclosures
None.
Acknowledgments
The authors would like to kindly thank our colleagues R. Starreveld MSc, C.S. Serban DVM, C.A. Houck MD, L.N. van Staveren MD, W.F.B. van der Does MD and M.S. van Schie MSc, for their help with acquiring mapping data, and we also kindly thank cardiothoracic surgeons J.A. Bekkers MD Phd, P.C. van de Woestijne MD, F.R.N. van Schaagen MD, W.J. van Leeuwen MD and M.W.A. Bekker MD, for performing the mappings. We further would like to thank K. Ben Dahman, software developer, for his assistance in data analysis.
(J Am Heart Assoc. 2020;9:e017069 DOI: 10.1161/JAHA.120.017069.)
For Sources of Funding and Disclosures, see page 10.
References
- 1. Schuessler RB, Kawamoto T, Hand DE, Mitsuno M, Bromberg BI, Cox JL, Boineau JP. Simultaneous epicardial and endocardial activation sequence mapping in the isolated canine right atrium. Circulation. 1993;88:250–263. [DOI] [PubMed] [Google Scholar]
- 2. Eckstein J, Maesen B, Linz D, Zeemering S, van Hunnik A, Verheule S, Allessie M, Schotten U. Time course and mechanisms of endo‐epicardial electrical dissociation during atrial fibrillation in the goat. Cardiovasc Res. 2011;89:816–824. [DOI] [PubMed] [Google Scholar]
- 3. de Groot N, van der Does L, Yaksh A, Lanters E, Teuwen C, Knops P, van de Woestijne P, Bekkers J, Kik C, Bogers A, et al. Direct proof of endo‐epicardial asynchrony of the atrial wall during atrial fibrillation in humans. Circ Arrhythm Electrophysiol. 2016;9e003648 DOI: 10.1161/CIRCEP.115.003648. [DOI] [PubMed] [Google Scholar]
- 4. van der Does L, Knops P, Teuwen CP, Serban C, Starreveld R, Lanters EAH, Mouws E, Kik C, Bogers A, de Groot NMS. Unipolar atrial electrogram morphology from an epicardial and endocardial perspective. Heart Rhythm. 2018;15:879–887. [DOI] [PubMed] [Google Scholar]
- 5. Kleber AG, Rudy Y. Basic mechanisms of cardiac impulse propagation and associated arrhythmias. Physiol Rev. 2004;84:431–488. [DOI] [PubMed] [Google Scholar]
- 6. de Groot NM, Houben RP, Smeets JL, Boersma E, Schotten U, Schalij MJ, Crijns H, Allessie MA. Electropathological substrate of longstanding persistent atrial fibrillation in patients with structural heart disease: epicardial breakthrough. Circulation. 2010;122:1674–1682. [DOI] [PubMed] [Google Scholar]
- 7. Ortiz J, Niwano S, Abe H, Rudy Y, Johnson NJ, Waldo AL. Mapping the conversion of atrial flutter to atrial fibrillation and atrial fibrillation to atrial flutter. Insights into mechanisms. Circ Res. 1994;74:882–894. [DOI] [PubMed] [Google Scholar]
- 8. Teuwen CP, Kik C, van der Does L, Lanters EAH, Knops P, Mouws E, Bogers A, de Groot NMS . Quantification of the arrhythmogenic effects of spontaneous atrial extrasystole using high‐resolution epicardial mapping. Circ Arrhythm Electrophysiol. 2018;11e005745 DOI: 10.1161/CIRCEP.117.005745. [DOI] [PubMed] [Google Scholar]
- 9. Zaman JA, Harling L, Ashrafian H, Darzi A, Gooderham N, Athanasiou T, Peters NS. Post‐operative atrial fibrillation is associated with a pre‐existing structural and electrical substrate in human right atrial myocardium. Int J Cardiol. 2016;220:580–588. [DOI] [PMC free article] [PubMed] [Google Scholar]
- 10. Teuwen CP, Yaksh A, Lanters EA, Kik C, van der Does LJ, Knops P, Taverne YJ, van de Woestijne PC, Oei FB, Bekkers JA, et al. Relevance of conduction disorders in bachmann's bundle during sinus rhythm in humans. Circ Arrhythm Electrophysiol. 2016;9:e00397210.1161/CIRCEP.115.003972. [DOI] [PubMed] [Google Scholar]
- 11. Knops P, Kik C, Bogers AJ, de Groot NM. Simultaneous endocardial and epicardial high‐resolution mapping of the human right atrial wall. J Thorac Cardiovasc Surg. 2016;152:929–931. [DOI] [PubMed] [Google Scholar]
- 12. Lanters EAH, Yaksh A, Teuwen CP, van der Does L, Kik C, Knops P, van Marion DMS, Brundel B, Bogers A, Allessie MA, et al. Spatial distribution of conduction disorders during sinus rhythm. Int J Cardiol. 2017;249:220–225. [DOI] [PubMed] [Google Scholar]
- 13. Arenal A, Almendral J, Alday JM, Villacastin J, Ormaetxe JM, Sande JL, Perez‐Castellano N, Gonzalez S, Ortiz M, Delcan JL. Rate‐dependent conduction block of the crista terminalis in patients with typical atrial flutter: Influence on evaluation of cavotricuspid isthmus conduction block. Circulation. 1999;99:2771–2778. [DOI] [PubMed] [Google Scholar]
- 14. Goodman D, van der Steen AB, van Dam RT. Endocardial and epicardial activation pathways of the canine right atrium. Am J Physiol. 1971;220:1–11. [DOI] [PubMed] [Google Scholar]
- 15. Spach MS, Heidlage JF, Barr RC, Dolber PC. Cell size and communication: role in structural and electrical development and remodeling of the heart. Heart Rhythm. 2004;1:500–515. [DOI] [PubMed] [Google Scholar]
- 16. Sanchez‐Quintana D, Anderson RH, Cabrera JA, Climent V, Martin R, Farre J, Ho SY. The terminal crest: morphological features relevant to electrophysiology. Heart. 2002;88:406–411. [DOI] [PMC free article] [PubMed] [Google Scholar]
- 17. Fedorov VV, Glukhov AV, Chang R, Kostecki G, Aferol H, Hucker WJ, Wuskell JP, Loew LM, Schuessler RB, Moazami N, et al. Optical mapping of the isolated coronary‐perfused human sinus node. J Am Coll Cardiol. 2010;56:1386–1394. [DOI] [PMC free article] [PubMed] [Google Scholar]
- 18. Jongbloed MR, Vicente Steijn R, Hahurij ND, Kelder TP, Schalij MJ, Gittenberger‐de Groot AC, Blom NA. Normal and abnormal development of the cardiac conduction system; implications for conduction and rhythm disorders in the child and adult. Differentiation. 2012;84:131–148. [DOI] [PubMed] [Google Scholar]
- 19. Sanchez‐Quintana D, Cabrera JA, Farre J, Climent V, Anderson RH, Ho SY. Sinus node revisited in the era of electroanatomical mapping and catheter ablation. Heart. 2005;91:189–194. [DOI] [PMC free article] [PubMed] [Google Scholar]
- 20. Kharbanda RK, Kik C, de Knops P, Bogers AJJC, de Groot NMS. Proof of endo‐epicardial asynchrony of the left atrial wall in humans. J Am Coll Cardiol Case Rep. 2020;2:745–749. [DOI] [PMC free article] [PubMed] [Google Scholar]
- 21. Mouws E, Lanters EAH, Teuwen CP, van der Does L, Kik C, Knops P, Bekkers JA, Bogers A, de Groot NMS. Epicardial breakthrough waves during sinus rhythm: depiction of the arrhythmogenic substrate? Circ Arrhythm Electrophysiol. 2017;10e005145 10.1161/CIRCEP.117.005145. [DOI] [PubMed] [Google Scholar]
- 22. Wijffels MC, Kirchhof CJ, Dorland R, Allessie MA. Atrial fibrillation begets atrial fibrillation. A study in awake chronically instrumented goats. Circulation. 1995;92:1954–1968. [DOI] [PubMed] [Google Scholar]
- 23. Schotten U, Verheule S, Kirchhof P, Goette A. Pathophysiological mechanisms of atrial fibrillation: a translational appraisal. Physiol Rev. 2011;91:265–325. [DOI] [PubMed] [Google Scholar]
- 24. Hansen BJ, Zhao J, Csepe TA, Moore BT, Li N, Jayne LA, Kalyanasundaram A, Lim P, Bratasz A, Powell KA, et al. Atrial fibrillation driven by micro‐anatomic intramural re‐entry revealed by simultaneous sub‐epicardial and sub‐endocardial optical mapping in explanted human hearts. Eur Heart J. 2015;36:2390–2401. [DOI] [PMC free article] [PubMed] [Google Scholar]
- 25. Gray RA, Pertsov AM, Jalife J. Incomplete reentry and epicardial breakthrough patterns during atrial fibrillation in the sheep heart. Circulation. 1996;94:2649–2661. [DOI] [PubMed] [Google Scholar]
- 26. Ausma J, van der Velden HM, Lenders MH, van Ankeren EP, Jongsma HJ, Ramaekers FC, Borgers M, Allessie MA. Reverse structural and gap‐junctional remodeling after prolonged atrial fibrillation in the goat. Circulation. 2003;107:2051–2058. [DOI] [PubMed] [Google Scholar]
- 27. van der Velden HM, Ausma J, Rook MB, Hellemons AJ, van Veen TA, Allessie MA, Jongsma HJ. Gap junctional remodeling in relation to stabilization of atrial fibrillation in the goat. Cardiovasc Res. 2000;46:476–486. [DOI] [PubMed] [Google Scholar]
- 28. Burstein B, Nattel S. Atrial fibrosis: mechanisms and clinical relevance in atrial fibrillation. J Am Coll Cardiol. 2008;51:802–809. [DOI] [PubMed] [Google Scholar]
- 29. Nattel S, Harada M. Atrial remodeling and atrial fibrillation: recent advances and translational perspectives. J Am Coll Cardiol. 2014;63:2335–2345. [DOI] [PubMed] [Google Scholar]