

Abstract
Background
Genome‐wide association studies have identified >1000 genetic variants cross‐sectionally associated with blood pressure variation and prevalent hypertension. These discoveries might aid the early identification of subpopulations at risk of developing hypertension or provide targets for drug development, amongst other applications. The aim of the present study was to analyze the association of blood pressure‐associated variants with long‐term changes (10 years) in blood pressure and also to assess their ability to predict hypertension incidence compared with traditional risk variables in a Swedish population.
Methods and Results
We constructed 6 genetic risk scores (GRSs) by summing the dosage of the effect allele at each locus of genetic variants previously associated with blood pressure traits (systolic blood pressure GRS (GRSSBP): 554 variants; diastolic blood pressure GRS (GRSDBP): 481 variants; mean arterial pressure GRS (GRSMAP): 20 variants; pulse pressure GRS (GRSPP): 478 variants; hypertension GRS (GRSHTN): 22 variants; combined GRS (GRScom b): 1152 variants). Each GRS was longitudinally associated with its corresponding blood pressure trait, with estimated effects per GRS SD unit of 0.50 to 1.21 mm Hg for quantitative traits and odds ratios (ORs) of 1.10 to 1.35 for hypertension incidence traits. The GRScomb was also significantly associated with hypertension incidence defined according to European guidelines (OR, 1.22 per SD; 95% CI, 1.10‒1.35) but not US guidelines (OR, 1.11 per SD; 95% CI, 0.99‒1.25) while controlling for traditional risk factors. The addition of GRScomb to a model containing traditional risk factors only marginally improved discrimination (Δarea under the ROC curve = 0.001–0.002).
Conclusions
GRSs based on discovered blood pressure‐associated variants are associated with long‐term changes in blood pressure traits and hypertension incidence, but the inclusion of genetic factors in a model composed of conventional hypertension risk factors did not yield a material increase in predictive ability.
Keywords: association, blood pressure, genetics, hypertension, incidence, prediction
Subject Categories: Hypertension
Nonstandard Abbreviations and Acronyms
- AHA
American Heart Association
- AUC
area under the ROC curve
- BMI
body mass index
- CADM2
cell adhesion molecule 2 gene
- DBP
diastolic blood pressure
- GLACIER
Gene×Lifestyle Interactions and Complex Traits Involved in Elevated Disease Risk
- GRS
genetic risk score
- GWAS
Genome Wide Association Study
- HTN‐EUR
hypertension according to European guidelines
- HTN‐US
hypertension according to US guidelines
- MAP
mean arterial pressure
- OR
odds ratio
- PP
pulse pressure
- SBP
systolic blood pressure
Clinical Perspective
What Is New?
Genetic variants discovered in blood pressure Genome Wide Association Studies showed a significant association with long‐term blood pressure changes.
The addition of a set of genetic variants to traditional risk factors does not materially improve the accuracy on the prediction of future hypertension.
What Are the Clinical Implications?
A genetic risk score based on cross‐sectionally associated blood pressure genetic variants was also associated with a longitudinal effect on blood pressure but it did not significantly enhance predictions of incident hypertension obtained from traditional risk factor models.
High blood pressure is the leading risk factor for coronary artery disease, cerebrovascular disease, kidney disease, and heart failure 1 , 2 , 3 and causes around 13% of all deaths worldwide. 4 Blood pressure is influenced by age, sex, lifestyle (eg, smoking, alcohol, physical activity, and obesity) and genetic factors. 5 , 6 , 7 , 8 More than 1000 genetic variants have been associated with blood pressure variation and hypertension in cross‐sectional analyses. 9 , 10 , 11 , 12 However, few studies have analyzed the association of genetic variants in relationship to longitudinal changes in blood pressure or incident hypertension, 13 , 14 , 15 , 16 , 17 and those that did focused on small subsets of all known blood pressure‐associated loci.
Genetic markers that allow early detection of people at risk of developing hypertension might be clinically relevant if they facilitate the identification of subpopulations in need of early monitoring and/or intervention. Previous prospective studies have evaluated the improvement on the predicted ability of hypertension incidence of a set of genetic variants but this has not been reported for the corpus of blood pressure loci. In 2013, a Swedish study showed that a genetic risk score (GRS) composed of 29 blood pressure‐associated single nucleotide polymorphisms marginally improved the predictive ability of a set of anthropometric, clinical, socioeconomic, and lifestyle variables on hypertension incidence, from an area under the ROC curve (AUC) of 0.662 for non‐genetic factors to an AUC of 0.664 for the joint model. 13 In the same year, a study conducted in 32 669 Finnish individuals showed that a GRS constructed on 32 genetic variants associated with systolic and diastolic blood pressure (SBP and DBP, respectively) did not significantly improve cardiovascular disease risk discrimination over the Framingham risk score variables. 18 Another study in a Korean population showed that a GRS composed of 4 single nucleotide polymorphisms did not substantially improve the accuracy to predict incident hypertension when added to a model composed of traditional risk factors (ΔAUC=0.001). 17
The aims of the present study were: (1) to assess the association of previously identified blood pressure‐associated loci with long‐term (10‐year) changes in blood pressure traits and (2) to examine the predictive ability of these genetic variants in relation to well‐known predictors of incident hypertension. The current analyses were performed within the context of a European Research Council project called Novel Approaches to Systematically Characterise Exercise and Nutrient‐Responsive Genes in Type 2 Diabetes and Cardiovascular Disease (NASCENT).
METHODS
To conform to informed consent requirements, applications for access to individual level data must first be reviewed and approved by the Northern Sweden Biobank. Further information about the application process can be obtained from Ms. Åsa Ågren (asa.agren@umu.se).
Study Participants
The analyses were conducted in the GLACIER (Gene×Lifestyle Interactions and Complex Traits Involved in Elevated Disease Risk) study cohort (N ≈19 000), which is nested within the Västerbotten Health Survey (Västerbottens hälsoundersökning; VHU), 19 , 20 a prospective, population‐based cohort study based in the population of Västerbotten in Northern Sweden. In VHU, residents within the county have since 1985 been invited to attend a comprehensive health examination within the years of their 40th, 50th, and 60th birthdays. Initially, residents aged 30 years were also invited, but this was later discontinued. For the present analyses, 4603 GLACIER participants had available genotype and baseline blood pressure data and, of these, 3925 participants had 10‐year follow‐up data available. Baseline examinations were performed between 1989 to 2001 and follow‐up examinations between 2000 to 2011. All participants provided written informed consent and the study was approved by the Regional Ethical Review Board in Umeå, Sweden.
Blood Pressure Phenotypes
Clinical measures in the GLACIER study are described in detail elsewhere. 19 SBP and DBP assessed before September 2009 were obtained once, after 5‐minute rest, with the participant in a recumbent position. Thereafter, blood pressures were measured twice with the participant seated; the average of these 2 values being used in analyses. Thus, validated conversion algorithms were used to align the blood pressure measurements taken before and after September 2009. 21 Mean arterial pressure (MAP) is defined as the average pressure throughout the cardiac cycle and was calculated as 1/3(SBP)+2/3(DBP). Pulse pressure (PP), which is a proxy for arterial stiffness, was also calculated (PP=SBP−DBP). According to hypertension definitions provided by the American College of Cardiology and the American Heart Association (AHA), 22 participants were defined as having hypertension according to US guidelines (HTN‐US) if they satisfied at least 1 of the 3 following criteria: (1) being on antihypertensive treatment, (2) SBP ≥130 mm Hg or (3) DBP ≥80 mm Hg. As hypertension definition is slightly different in European 2018 Guidelines 23 a second hypertension phenotype (HTN‐EUR) was created following these thresholds. In this case, participants were categorized as hypertensive if (1) they were on antihypertensive treatment, (2) their SBP was ≥140 mm Hg or (3) their DBP was ≥90 mm Hg. Participants using blood pressure lowering medication were excluded from the association analyses where SBP, DBP, PP, or MAP were the outcomes.
Traditional Risk Factors
Prediction algorithms for hypertension typically include the following predictor variables: age, sex, body mass index (BMI), blood pressure, glycemic variables, smoking, and physical activity. 24 These predictors were also included in the current prediction analyses and were considered “traditional” risk factors. Weight (to the nearest 0.1 kg) and height (to the nearest 1 cm) were measured with a calibrated balance‐beam scale and a wall‐mounted stadiometer, respectively, with participants wearing indoor clothing without shoes. BMI was calculated as weight (kg)/height (m)2. Plasma glucose was measured with a Reflotron bench‐top analyzer (Roche Diagnostics Scandinavia, Umeå, Sweden) in capillary blood after an overnight fast and 2 hours later following the administration of a standard 75 g oral glucose load. In prediction analyses including fasting and 2 hours glucose, a variable indicating the duration of fasting was added to the model; among the participants included in the prediction analyses, 94% had fasted for a minimum of 8 hours before the baseline visit. Participants using antihyperglycemic medications were excluded from the prediction analyses. Smoking status was assessed using a self‐administered questionnaire that participants completed at the time of the health examination; participants were categorized as “current smokers,” “former smokers,” “non‐smokers,” “occasional smokers,” and “former occasional smokers.” Leisure time physical activity during the past 3 months was assessed through a modified version of the International Physical Activity Questionnaire 25 , 26 and categorized as “never,”“occasionally,” “1 to 2 times/week,” “2 to 3 times/week,” or “>3 times/week.” Both smoking status and leisure time physical activity were treated as categorical variables.
Genotyping and Imputation
DNA was extracted from peripheral white blood cells. Genotyping was performed using Illumina's Infinium HumanCore‐24v1.1 BeadChip genotyping array 27 at SciLife Lab, Uppsala, Sweden. Quality control of the genotyped data was conducted following published recommendations. 28 , 29 Following these recommendations, related participants with identity by descent values >0.1875 (n=440 participants) were excluded.
The genotype data were subsequently imputed using the 1000 Genome imputation panel 30 on the Michigan imputation server (https://imputationserver.sph.umich.edu). 31
Genetic Risk Scores
A review of the published literature on GWAS (Genome Wide Association Studies) for blood pressure traits (ie, SBP, DBP, MAP, PP, and hypertension) was performed to find loci associated at a genome‐wide level of statistical significance in European ancestry populations with the index traits. A total of 1405 genetic variants was obtained from 22 different papers published until the end of 2018 9 , 10 , 11 , 12 , 32 , 33 , 34 , 35 , 36 , 37 , 38 , 39 , 40 , 41 , 42 , 43 , 44 , 45 , 46 , 47 , 48 , 49 (Table S1). Of all the reviewed studies, multiple blood pressure‐associated variants within single loci were identified using LDlink 50 ; to maximize the efficiency of subsequent analyses, we selected the variant with the highest functionality score from each block of variants (defined as those in linkage disequilibrium at r 2>0.8) using 3DSNP. 51 In 3DSNP, each variant is scored based on data on 6 functional categories (ie, 3‐dimensional interacting genes, enhancer state, promoter state, transcription factor binding sites, sequence motifs altered, and conservation score). This score quantitatively measures the functionality of the genetic variants, which helps select important variants from a large pool. The obtained subset totaled 1226 genetic variants, 1177 of them being present in the GLACIER 1000 Genome‐imputed genetic data set. Twenty‐two variants were excluded owing to: (1) deviations from Hardy‐Weinberg expectations (P<1E‐06), (2) a minor allele frequency <1% and/or (3) having an imputation quality score <0.3. Three variants were also excluded as their alleles in the GLACIER data set did not match with the ones in the literature review. Thus, 1152 variants passed the quality control steps and were used to construct the genetic risk scores (GRS) used in the subsequent association and prediction analyses described below.
Five unweighted GRSs were generated by summing the dosage of the effect allele (ie, the allele associated with a higher blood pressure value or increased risk of hypertension) at each established locus for: (1) SBP (GRSSBP: 554 variants), (2) DBP (GRSDBP: 481 variants), (3) MAP (GRSMAP: 20 variants), (4) PP (GRSPP: 478 variants) and (5) hypertension (GRSHTN: 22 variants). In addition, a sixth GRS including all the genetic variants associated with any of the 5 blood pressure traits was created (GRScomb: 1152 variants). All the GRSs generated in this article were unweighted (ie, the magnitude of the effect of each genetic variant was not considered in their construction). To properly weight the GRSs in the present article we would need a set of coefficients from previous studies aiming to test the association of genetic variants with change in blood pressure over time, as the main aim of the present analyses is focused on longitudinal effects of the genetic variables. However, such coefficients are not available at the moment as the original GWAS analyses from which the genetic variants were extracted were cross‐sectional analyses. The minimum theoretical value of all 6 GRSs is 0 and the maximum theoretical values are 1108 for GRSSBP, 962 for GRSDBP, 40 for GRSMAP, 956 for GRSPP, 44 for GRSHTN and 2304 for GRScomb. A participant with the maximum theoretical value of a GRS would have 2 effect alleles for all the genetic variants included in each GRS. The population distribution of the number of blood pressure increasing alleles is normally distributed, as each genetic variant is inherited independently. Of note, the probability that anyone carries all or none of the risk alleles within a GRS of this nature is vanishingly small (Figure S1); indeed, the ranges of values for the 6 GRSs in the GLACIER cohort are: GRSSBP=500 to 608, GRSDBP=451 to 547, GRSMAP=12 to 32, GRSPP=415 to 513, GRSHTN=14 to 34, and GRScomb=1065 to 1232. Two genetic variants (rs169287 and rs78378222) showed discordant effect alleles for DBP and PP. The effect allele associated with DBP was selected when creating the GRScomb and the effect allele associated with each trait was selected to create GRSDBP and GRSPP.
Statistical Analysis
All statistical analyses were performed in R (version 3.4.1). 52
Association Analyses
Generalized linear regression models were used to test the association of the GRSs and individual genetic variants (assuming an additive mode of inheritance) with the corresponding blood pressure traits. A generalized linear regression model with a binomial family specification and a logit link function was used when the outcomes of interest were binary (eg, hypertension incidence) while a generalized linear regression model with a gaussian family and an identity link was used when outcomes were continuous variables (eg, SBP). In cross‐sectional analyses, the baseline blood pressure measure or hypertension prevalence was used as the dependent variable and the models were adjusted for baseline values of age, age2, sex, BMI, and first 4 genetic principal components for genetic markers accounting for population substructure. In longitudinal analyses of continuous blood pressure traits, change in blood pressure was modeled using the follow‐up measurement of the blood pressure trait as the dependent variable, while adjusting the model for the respective trait’s baseline value:
where γF represents a blood pressure trait at follow‐up and γB at baseline, α is the intercept, βi represent the estimated effect size parameters for each corresponding variable, ageB is the age at baseline, BMIaverage is the average between baseline and follow‐up values of BMI, PC1‐4 are the first 4 principal components, and ε represents error. This model was chosen over the delta model (ie, follow‐up value minus baseline value as dependent variable) as the follow‐up blood pressure value varies as a function of the baseline blood pressure measurement (ie, participants with higher baseline blood pressure values will presumably have higher blood pressure values in the follow‐up compared with participants with lower baseline blood pressure values), which requires the baseline blood pressure measurement to appear in the right‐hand side of the equation. 53 In the longitudinal models for the hypertension phenotypes, the prevalent cases of hypertension were excluded and incident hypertension (ie, hypertension yes/no at the 10‐year follow‐up visit) was used as the dependent variable. The models were adjusted for age, age2, sex, follow‐up duration, average BMI (of the BMI measured at the baseline and follow‐up visit), and the first 4 genetic principal components. The Benjamini and Hochberg 54 false discovery rate (FDR) was used to correct for multiple testing. All GRSs were standardized by subtracting each trait’s mean value and dividing by its SD. The coefficients obtained in the cross‐sectional and longitudinal analyses for each of the genetic variants were paired and compared using a dependent samples sign test in the BSDA 55 package to test for differences between longitudinal and cross‐sectional genetic effects.
Analyses Assessing Predictive Ability
For each of the hypertension phenotypes, participants defined as having hypertension at baseline were excluded for these analyses and the predictive abilities of 3 models (a genetic model, a traditional risk factor model, and a joint model) for incident hypertension were assessed using logistic regression analyses. The genetic model included baseline age, baseline age2, sex, follow‐up duration, and GRScomb as predictor variables; the traditional risk factor model included the baseline values (where relevant) for age, age2, sex, follow‐up duration, BMI, fasting and 2 hours glucoses, SBP and DBP, fasting status, smoking status, and leisure time physical activity; the joint model included the variables in the traditional risk factor model plus the GRScomb variable. Age and sex were included in all models as both are strong predictors of hypertension. Continuously distributed traditional risk factors and GRScomb were standardized subtracting the variable mean and dividing by the variable SD to make effect sizes comparable.
To evaluate if there was a statistically significant improvement in the prediction performance by adding blood pressure‐associated genetic variants to the traditional risk factors, logistic regression was used to test the statistical significance of the GRScomb regression coefficient while controlling for traditional risk factors, as recommended elsewhere. 56 , 57 We also evaluated the magnitude of the improvement by calculating the change in the AUC (ΔAUC) using the pROC 58 package. According to the literature, there are no valid significance tests ΔAUC when estimates are derived from the same data used to fit the models. 59 Thus, P values of ΔAUC were not calculated. Calibration (ie, over‐ or under‐estimation of the predicted responses relative to the observed responses) was evaluated by comparing predicted probabilities and observed probabilities using calibration plots. Internal validation of discrimination and calibration was performed using bootstrapping analysis on the logistic regression with 1500 iterations in the rms package. 60 For discrimination analyses, a corrected discrimination index value was obtained that was transformed to the corrected AUC value.
Underlying GRS×environment interactions were assessed following the method describe in a previous article. 61 For that purpose, continuous blood pressure traits were initially adjusted for their covariates and the residuals were standardized by an inverse‐normal transformation. Thereafter, the standardized residuals were regressed on the GRS corresponding to each trait to test for association of the GRS with trait variability. Besides, as we hypothesized that genetic factors could exert a different effect specially depending on sex, age, BMI, and baseline blood pressure, these specific interactions were tested by adding the following interaction terms to the joint model: GRScomb×sex, GRScomb×age, GRScomb×BMI, GRScomb×SBP and GRScomb×DBP.
RESULTS
Participant characteristics are summarized in Table S2 and Figure S2 displays the delta blood pressure values by quartiles of the GRSs. At baseline, 2548 participants were classified as having hypertension according to US guidelines (HTN‐US) and 1183 according to European guidelines (HTN‐EUR). During the 10‐year follow‐up (mean=9.9±0.4 years), 42.7% and 28.1% of the cohort that was initially not classified as hypertensive according to US and European guidelines, respectively, developed hypertension. A statistically significant (P<0.0001) overall increase in all 4 continuous blood pressure traits (SBP, DBP, PP, and MAP) was observed from baseline to follow‐up.
Association Analyses
Continuous Blood Pressure Traits
All GRSs (ie GRSSBP, GRSDBP, GRSMAP and GRSPP) were positively associated with 10‐year changes in their respective traits (Table 1 and Table S3). Differences of 1 SD in each GRS were associated with a 1.21, 0.81, 0.50, and 0.97 mm Hg increase in SBP, DBP, MAP, and PP per decade follow‐up, respectively. Average BMI and baseline blood pressure measurement were also significantly associated with increases in SBP, DBP, MAP, and PP (Table S3). Compared with those participants in first GRS quartiles, participants in the fourth quartiles of the GRSs had 3.58, 1.90, 1.55, and 2.06 mm Hg greater increases in SBP, DBP, MAP, and PP per decade follow‐up, respectively (Figure 1). In individual genetic variant analyses (Tables S4 through S7), 1 variant (rs62250714) showed a significant longitudinal association with PP after multiple‐test correction (β=1.17 mm Hg per allele per 10‐year follow‐up, SE=0.28, P FDR=1.61E‐02) (Table S7). The same genetic variant showed a nominally significant association with long‐term change in SBP (P=4.92E‐04; Table S4). In addition, 27 other SBP‐associated genetic variants, 34 DBP‐associated variants, 1 MAP‐associated variant, and 32 PP‐associated variants were nominally associated with long‐term changes in their respective trait (Tables S4 through S7). The genetic effects on baseline (cross‐sectional) blood pressure differed significantly from the effects on change in blood pressure during follow‐up (longitudinal) for SBP (P=2E‐03) and DBP (P=2.2E‐02) but not for MAP (P=0.82) and PP (P=0.61).
Table 1.
Cross‐Sectional and Longitudinal Associations of the Trait‐Specific GRSs for Blood Pressure Traits
| Phenotypes | Cross‐Sectional Analysis | Longitudinal Analysis | ||||||
|---|---|---|---|---|---|---|---|---|
| n | Beta or OR (Per 1 SD) | 95% CI | P Value | n | Beta or OR (Per 1 SD per decade) | 95% CI | P Value | |
| SBP, mm Hg | 4354 | 2.49 | 2.07–2.92 | <2E‐16 | 3626 | 1.21 | 0.73–1.68 | 5.68E‐07 |
| DBP, mm Hg | 4354 | 1.58 | 1.29–1.86 | <2E‐16 | 3626 | 0.81 | 0.52–1.10 | 5.00E‐08 |
| MAP, mm Hg | 4354 | 0.85 | 0.54–1.16 | 6.09E‐08 | 3626 | 0.50 | 0.19–0.81 | 1.39E‐03 |
| PP, mm Hg | 4353 | 1.17 | 0.86–1.47 | 9.53E‐14 | 3623 | 0.97 | 0.61–1.32 | 1.54E‐07 |
| HTN‐US (GRSHTN) | 4603 | 1.16 | 1.09–1.24 | 1.85‐06 | 2054 | 1.12 | 1.02–1.23 | 1.36E‐02 |
| HTN‐US (GRScomb) | 4603 | 1.35 | 1.27–1.44 | <2E‐16 | 2054 | 1.20 | 1.10–1.32 | 1.04E‐04 |
| HTN‐EUR (GRSHTN) | 4603 | 1.21 | 1.13–1.30 | 1.64E‐07 | 3418 | 1.10 | 1.02–1.19 | 1.53E‐02 |
| HTN‐EUR (GRScomb) | 4603 | 1.45 | 1.35–1.56 | <2E‐16 | 3418 | 1.35 | 1.25–1.47 | 2.84E‐13 |
The covariates for the cross‐sectional regression model were: baseline values of age, age2, and BMI, plus sex, and the first 4 genetic principal components. The covariates for the longitudinal regression model were: baseline values of age, age2, and the dependant variable, plus sex, follow‐up duration, average BMI between the 2 visits, and the first 4 genetic principal components. DBP indicates diastolic blood pressure; GRS, genetic risk score; GRScomb, GRS including all the genetic variants associated with any blood pressure trait; GRSHTN, hypertension GRS; HTN‐US, hypertension according to US guidelines; HTN‐EUR, hypertension according to European guidelines; MAP, mean arterial blood pressure; OR, odds ratio; PP, pulse pressure; and SBP, systolic blood pressure.
Figure 1. Associations of quartiles of the GRSs with their corresponding traits’ change during follow‐up; systolic blood pressure (A) diastolic blood pressure (B) mean arterial blood pressure, (C) and pulse pressure (D).

DBP indicates diastolic blood pressure; GRS, genetic risk score; GRSDBP, GRS including genetic variants associated with DBP; GRSMAP, GRS including genetic variants associated with MAP; GRSPP, GRS including genetic variants associated with PP; GRSSBP, GRS including genetic variants associated with SBP; MAP, mean arterial blood pressure; PP, pulse pressure; and SBP, systolic blood pressure.
Hypertension
GRSHTN and GRScomb were both significantly associated with incidence of the 2 hypertension phenotypes. GRSHTN was associated with a 12% increase in the odds of developing hypertension according to US guidelines and 10% according to European guidelines; while GRScomb associated with increases of 20% for HTN‐US and 35% for HTN‐EUR (Table 1). Participants in the highest quartile of the GRScomb had roughly twice the odds of developing HTN‐EUR (OR, 2.28; 95% CI, 1.82, 2.86) compared with those in the lowest quartile (Figure 2B), while the OR of developing HTN‐US in the highest versus lowest quartile is 1.48 (95% CI, 1.13–1.94; Figure 2A). Fifty‐six genetic variants were nominally associated with incidence of HTN‐US (Table S8) and 64 with incidence of HTN‐EUR (Table S9), 6 of these variants being associated with both hypertension traits.
Figure 2. Associations of quartiles of the GRScomb with incidence of HTN‐US (A) and of HTN‐EUR (B).

GRScomb indicates genetic risk score including all the genetic variants associated with any blood pressure trait; HTN‐EUR, hypertension according to European guidelines; HTN‐US, hypertension according to US guidelines; and OR, odds ratio.
Contribution of GRScomb to Hypertension Prediction
To evaluate if the predictive ability of incident hypertension improves with the inclusion of genetic risk variants, we tested the significance of the GRScomb variable when added to the traditional model (Figure 3; Tables S10 and S11). The GRScomb variable significantly contributed to the risk of HTN‐EUR incidence while controlling for the traditional risk factors (OR, 1.22 per SD; 95% CI, 1.10, 1.35). The estimated effect of GRScomb was comparable in magnitude with that of DBP and was larger than the estimated effect of BMI and fasting or 2 hours glucose (Figure 3C; Table S11). HTN‐EUR incidence increased across deciles of GRScomb, from 19% in the lowest decile to 34% in the highest decile (Figure 3D). However, the GRScomb variable did not significantly contribute to the risk of HTN‐US incidence (Figure 3A; Table S10).
Figure 3. Odds ratios (95% CI) of predictors in the joint model for HTN‐US incidence (A) and HTN‐EUR incidence (C). Incidence of HTN‐US (B) and HTN‐EUR (D) by deciles of the GRScomb.

BMI indicates body mass index; GRScomb, genetic risk score including all the genetic variants associated with any blood pressure trait; HTN‐EUR, hypertension according to European guidelines; HTN‐US, hypertension according to US guidelines; and OR, odds ratio.
Discrimination
After internal validation using bootstrapping, the traditional risk factor model showed higher predictive accuracy of incident hypertension (AUCs=0.721 for HTN‐US and 0.764 for HTN‐EUR) than the genetic model (AUCs=0.649 for HTN‐US and 0.653 for HTN‐EUR) (Table 2). The AUCs of the traditional risk factor models were not materially improved when adding the genetic factors for any of the hypertension incidence phenotypes (joint model AUCs=0.722 for HTN‐US and 0.766 for HTN‐EUR; ΔAUC=0.001–0.002).
Table 2.
Discrimination and Calibration Measures for the two Hypertension Incidence Phenotypes
| Measures | HTN‐US | HTN‐EUR |
|---|---|---|
| Discrimination | ||
| AUC genetic model | 0.653 (0.625–0.681) | 0.656 (0.633–0.680) |
| AUC genetic model after internal validation | 0.649 | 0.653 |
| AUC traditional risk model | 0.736 (0.71–0.761) | 0.773 (0.752–0.793) |
| AUC traditional risk model after internal validation | 0.721 | 0.764 |
| AUC joint model | 0.738 (0.712–0.763) | 0.776 (0.756–0.796) |
| AUC joint model after internal validation | 0.722 | 0.766 |
| Calibration | ||
| Slope | 0.913 | 0.949 |
| Intercept | −0.023 | −0.037 |
Measures are given as value (95% CI) when possible. AUC indicates area under the ROC curve; HTN‐EUR, hypertension according to European guidelines; and HTN‐US, hypertension according to US guidelines.
Calibration
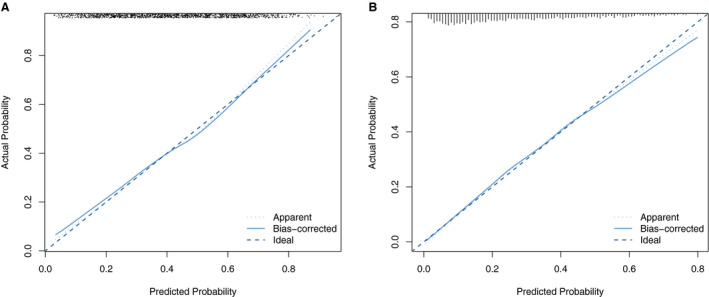
Calibration was assessed using calibration plots (Figure 4), which were internally validated through bootstrapping. A slope of 1 and an intercept of 0 represent perfect calibration. After internal validation, the joint model showed calibration slopes of 0.913 and 0.949 and intercepts of −0.023 and −0.037 for HTN‐US and HTN‐EUR, respectively. In general, the models exhibited good calibration.
Figure 4. Calibration plot for the prediction model including both genetic and traditional risk factors for hypertension incidences according to US guidelines (A) and according to European guidelines (B).
Gene×Environment Interactions
None of the GRSs was associated with their corresponding continuous trait’s variation (Table S12), suggesting an absence of major interactions with environmental factors. In explicit interaction tests, no significant interactions between GRScomb and either sex (Table S13), age (Table S14), BMI (Table S15), baseline SBP (Table S16), or baseline DBP (Table S17) were detected for any of the hypertension phenotypes.
DISCUSSION
This is, to our knowledge, the first study to comprehensively assess associations with changes in blood pressure and the prediction accuracy of incident hypertension for the corpus of blood pressure‐associated genetic variants until the end of 2018. Six different GRSs for 5 different blood pressure traits (SBP, DBP, MAP, PP, and HTN) were constructed based on published evidence. All GRSs were associated with change in their corresponding blood pressure traits during follow‐up in this Swedish cohort. After correction for multiple testing, rs62250714 (CADM2; Cell Adhesion Molecule 2 Gene) showed a significant association with 10‐year change in PP. These findings may aid the biological understanding of age‐related blood pressure deterioration by highlighting biological pathways whose perturbation may cause this life‐threatening trait.
After controlling for traditional risk factors associated with hypertension, the combined GRS, including all blood pressure trait‐associated genetic variants (GRScomb), was significantly associated with hypertension incidence defined using European guidelines but not with hypertension incidence defined using US guidelines. This difference could be attributable to the thresholds used to define hypertension in each case. The European definition uses higher SBP and DBP thresholds so this subgroup of participants has by definition higher levels of blood pressure, so it may be enriched for genetic risk variants, which ultimately will convey a stronger association in the analyses.
Although the GRScomb significantly improved the predictive ability of the traditional risk model when hypertension was defined using European guidelines, there was no material increase in the predictive ability conveyed by the genetic variants (ΔAUC=0.002). Thus, according to the analyses conducted in this research the gathered genetic evidence is unlikely to enhance predictions of incident hypertension obtained from traditional risk factors models.
Although all the GRSs examined here demonstrated cross‐sectional and longitudinal associations with their respective blood pressure traits, the effect estimates yielded from the longitudinal models were of smaller magnitude than those derived from the cross‐sectional models. This may be because these variants were detected in cross‐sectional GWAS analyses, which may have biased against the discovery of variants that convey time‐varying effects for reasons explained elsewhere. 62 Besides, the GLACIER study contributed data to 4 out of the 22 GWAS analyses used to select the genetic variants included in the present study, which might have overestimated the strength of the cross‐sectional associations. It is also plausible that amongst the hundreds of loci studied here, subsets exist that work in concert to modulate changes in blood pressure over time, which are not adequately characterized using the GRSs used here.
The GRSs (per SD unit) were associated with 0.50 to 1.21 mm Hg increases in blood pressure traits over a decade of follow‐up, which although seemingly small in magnitude may be of clinical relevance, as even modest increments in blood pressure change can increase the risk of cardiovascular diseases across the lifespan. 3 , 63 The odds of incident hypertension ranged from 1.10 to 1.35 per SD per decade follow‐up, with the highest risk attributable to the GRS combining all the genetic variants associated to all the blood pressure traits (GRScomb; ORs, 1.20 and 1.35 per SD per decade follow‐up for HTN‐US and HTN‐EUR, respectively) than for the GRS created using only the genetic variants specifically associated with hypertension (GRSHTN; ORs, 1.12 and 1.10 per SD per 10 years for HTN‐US and HTN‐EUR, respectively).
In individual genetic variant analyses corrected for multiple testing, only one of the blood pressure‐associated genetic variants (rs62250714) was significantly associated with long‐term changes in blood pressure (specifically PP). Located on chromosome 3, rs62250714 is an intronic variant proximal to CADM2. CADM2 has been previously implicated in variations in BMI, 64 physical activity 64 and impulsive personality traits 65 among other phenotypes. A further 186 genetic variants showed nominally significant (P<0.05) longitudinal associations with blood pressure variation. These variants, if independently replicated, may shed light on genetic pathways affecting long‐term blood pressure deteriorations in blood pressure control.
Several studies showed that including genetic information in models assessing the predictive use of traditional risk factors in hypertension and cardiovascular diseases was of no material predictive value. 13 , 17 , 18 Subsequent GWAS meta‐analyses in large cross‐sectional analyses have identified hundreds of novel loci associated with blood pressure and hypertension. 10 , 11 Nevertheless, as the present study shows, these genetic variants, at least when characterized in conventionally‐defined GRS, do not materially improve the predictive accuracy of a conventional risk factor model for incident hypertension. There are numerous factors that may undermine the use of genetics in the prediction of hypertension. For example, since GRScomb is based on hundreds of common variants with small effects on blood pressure, even those participants with equivalently high GRS values are likely to carry different combinations of risk alleles; this type of heterogeneity is likely to lead to a degree of misclassification of genetic risk. Advances in the identification of rarer blood pressure variants with much larger effect estimates and their inclusion in the risk algorithms might also raise predictive ability. It is also possible that genetic factors convey different effects on hypertension incidence in subsets of the population and that genetic prediction algorithms that consider this might be more effective. This possibility was tested in the present study for sex, age, BMI, and baseline blood pressure values, but we found no clear evidence that the predictive ability of the algorithms would be improved if one were to include these interactions. A possible exception is for BMI and HTN‐EUR, where we found tentative evidence (P=0.06 for GRS*BMI interaction) that genetic effects might differ conditional on BMI level.
A potential limitation of the current analyses is that family history of hypertension was not included in the traditional risk factor model as this information was not collected in the GLACIER study. The absence of longitudinal GWAS analyses on the other hand limited the possibility to build and test a weighted GRS using appropriate weights. Besides, the GLACIER cohort is of European ancestry and additional studies will therefore be needed to determine if our findings are generalizable to other ancestries. Moreover, the environmental risk factors for hypertension in northern Sweden may differ from other populations. It is also important to keep in mind that longitudinal analyses with only 2 data points as the present analyses are not able to distinguish real change from the measurement error. 66 Finally, because the follow‐up examination occurred 10 years after baseline, it is possible that people at the highest genetic risk of cardiovascular diseases died in the interim and therefore were excluded from the current analyses, which may have led to an underestimation of the genetic effects.
Sources of Funding
This research was undertaken as part of a research program supported by the European Research Council (CoG‐2015_681742_NASCENT), Swedish Research Council (Distinguished Young Researchers Award in Medicine), Swedish Heart‐Lung Foundation, and the Novo Nordisk Foundation, all grants to Prof. Franks. This work was also supported by Swedish Foundation for Strategic Research: IRC15‐0067.
Disclosures
None.
Supporting information
Tables S1–S17
Figures S1–S2
Acknowledgments
We thank the participants, health professionals, and data managers involved in the Västerbotten Health Survey. We are also grateful to the staff of the Northern Sweden Biobank for preparing materials and to K. Enqvist and T. Johansson (Västerbottens County Council, Umeå, Sweden) for DNA preparation.
(J Am Heart Assoc. 2020;9:e014513 DOI: 10.1161/JAHA.119.014513.)
For Sources of Funding and Disclosures, see page 11.
REFERENCES
- 1. Safar ME, Levy BI, Struijker‐Boudier H. Current perspectives on arterial stiffness and pulse pressure in hypertension and cardiovascular diseases. Circulation. 2003;107:2864–2869. [DOI] [PubMed] [Google Scholar]
- 2. Poulter N. Global risk of cardiovascular disease. Heart. 2003;89(suppl 2):ii2–ii5. [DOI] [PMC free article] [PubMed] [Google Scholar]
- 3. Vasan RS, Larson MG, Leip EP, Evans JC, O'Donnell CJ, Kannel WB, Levy D. Impact of high‐normal blood pressure on the risk of cardiovascular disease. N Engl J Med. 2001;345:1291–1297. [DOI] [PubMed] [Google Scholar]
- 4. WHO . Raised blood pressure. 2018. Available at: http://www.who.int/gho/ncd/risk_factors/blood_pressure_prevalence_text/en/. Accessed May 6, 2018.
- 5. van Rijn MJ, Schut AF, Aulchenko YS, Deinum J, Sayed‐Tabatabaei FA, Yazdanpanah M, Isaacs A, Axenovich TI, Zorkoltseva IV, Zillikens MC, et al. Heritability of blood pressure traits and the genetic contribution to blood pressure variance explained by four blood‐pressure‐related genes. J Hypertens. 2007;25:565–570. [DOI] [PubMed] [Google Scholar]
- 6. Fava C, Burri P, Almgren P, Groop L, Hulthen UL, Melander O. Heritability of ambulatory and office blood pressure phenotypes in swedish families. J Hypertens. 2004;22:1717–1721. [DOI] [PubMed] [Google Scholar]
- 7. Poveda A, Chen Y, Brandstrom A, Engberg E, Hallmans G, Johansson I, Renstrom F, Kurbasic A, Franks PW. The heritable basis of gene‐environment interactions in cardiometabolic traits. Diabetologia. 2017;60:442–452. [DOI] [PMC free article] [PubMed] [Google Scholar]
- 8. Hottenga JJ, Boomsma DI, Kupper N, Posthuma D, Snieder H, Willemsen G, de Geus EJ. Heritability and stability of resting blood pressure. Twin Res Hum Genet. 2005;8:499–508. [DOI] [PubMed] [Google Scholar]
- 9. Ehret GB, Ferreira T, Chasman DI, Jackson AU, Schmidt EM, Johnson T, Thorleifsson G, Luan J, Donnelly LA, Kanoni S, et al. The genetics of blood pressure regulation and its target organs from association studies in 342,415 individuals. Nat Genet. 2016;48:1171–1184. [DOI] [PMC free article] [PubMed] [Google Scholar]
- 10. Warren HR, Evangelou E, Cabrera CP, Gao H, Ren M, Mifsud B, Ntalla I, Surendran P, Liu C, Cook JP, et al. Genome‐wide association analysis identifies novel blood pressure loci and offers biological insights into cardiovascular risk. Nat Genet. 2017;49:403–415. [DOI] [PMC free article] [PubMed] [Google Scholar]
- 11. Wain LV, Vaez A, Jansen R, Joehanes R, van der Most PJ, Erzurumluoglu AM, O'Reilly PF, Cabrera CP, Warren HR, Rose LM, et al. Novel blood pressure locus and gene discovery using genome‐wide association study and expression data sets from blood and the kidney. Hypertension. 2017;70:e4–e19. [DOI] [PMC free article] [PubMed] [Google Scholar]
- 12. Evangelou E, Warren HR, Mosen‐Ansorena D, Mifsud B, Pazoki R, Gao H, Ntritsos G, Dimou N, Cabrera CP, Karaman I, et al. Genetic analysis of over 1 million people identifies 535 new loci associated with blood pressure traits. Nat Genet. 2018;50:1412–1425. [DOI] [PMC free article] [PubMed] [Google Scholar]
- 13. Fava C, Sjogren M, Montagnana M, Danese E, Almgren P, Engstrom G, Nilsson P, Hedblad B, Guidi GC, Minuz P, et al. Prediction of blood pressure changes over time and incidence of hypertension by a genetic risk score in swedes. Hypertension. 2013;61:319–326. [DOI] [PubMed] [Google Scholar]
- 14. Chang YC, Chiu YF, Lee IT, Ho LT, Hung YJ, Hsiung CA, Quertermous T, Donlon T, Lee WJ, Lee PC, et al. Common ALDH2 genetic variants predict development of hypertension in the SAPPHIRe prospective cohort: gene‐environmental interaction with alcohol consumption. BMC Cardiovasc Disord. 2012;12:58. [DOI] [PMC free article] [PubMed] [Google Scholar]
- 15. Bonnet F, Roussel R, Natali A, Cauchi S, Petrie J, Laville M, Yengo L, Froguel P, Lange C, Lantieri O, et al. Parental history of type 2 diabetes, TCF7L2 variant and lower insulin secretion are associated with incident hypertension. Data from the DESIR and RISC cohorts. Diabetologia. 2013;56:2414–2423. [DOI] [PubMed] [Google Scholar]
- 16. Fava C, Danese E, Montagnana M, Sjogren M, Almgren P, Engstrom G, Nilsson P, Hedblad B, Guidi GC, Minuz P, et al. Serine/threonine kinase 39 is a candidate gene for primary hypertension especially in women: results from two cohort studies in Swedes. J Hypertens. 2011;29:484–491. [DOI] [PubMed] [Google Scholar]
- 17. Lim NK, Lee JY, Lee JY, Park HY, Cho MC. The role of genetic risk score in predicting the risk of hypertension in the Korean population: Korean Genome and Epidemiology Study. PLoS One. 2015;10:e0131603. [DOI] [PMC free article] [PubMed] [Google Scholar]
- 18. Havulinna AS, Kettunen J, Ukkola O, Osmond C, Eriksson JG, Kesaniemi YA, Jula A, Peltonen L, Kontula K, Salomaa V, et al. A blood pressure genetic risk score is a significant predictor of incident cardiovascular events in 32,669 individuals. Hypertension. 2013;61:987–994. [DOI] [PMC free article] [PubMed] [Google Scholar]
- 19. Hallmans G, Agren A, Johansson G, Johansson A, Stegmayr B, Jansson JH, Lindahl B, Rolandsson O, Soderberg S, Nilsson M, et al. Cardiovascular disease and diabetes in the Northern Sweden Health and Disease Study Cohort—evaluation of risk factors and their interactions. Scand J Public Health Suppl. 2003;61:18–24. [DOI] [PubMed] [Google Scholar]
- 20. Norberg M, Wall S, Boman K, Weinehall L. The Västerbotten Intervention Programme: background, design and implications. Glob Health Action. 2010;3 10.3402/gha.v3i0.4643. [DOI] [PMC free article] [PubMed] [Google Scholar]
- 21. Ng N, Carlberg B, Weinehall L, Norberg M. Trends of blood pressure levels and management in Vasterbotten County, Sweden, during 1990–2010. Glob Health Action. 2012;5:1–12. [DOI] [PMC free article] [PubMed] [Google Scholar]
- 22. Whelton PK, Carey RM, Aronow WS, Casey DE Jr, Collins KJ, Dennison Himmelfarb C, DePalma SM, Gidding S, Jamerson KA, Jones DW, et al. 2017 ACC/AHA/AAPA/ABC/ACPM/AGS/APhA/ASH/ASPC/NMA/PCNA guideline for the prevention, detection, evaluation, and management of high blood pressure in adults: executive summary: a report of the American College of Cardiology/American Heart Association Task Force on clinical practice guidelines. Hypertension. 2018;71:1269–1324. [DOI] [PubMed] [Google Scholar]
- 23. Williams B, Mancia G, Spiering W, Agabiti Rosei E, Azizi M, Burnier M, Clement DL, Coca A, de Simone G, Dominiczak A, et al. 2018 ESC/ESH guidelines for the management of arterial hypertension. Eur Heart J. 2018;39:3021–3104. [DOI] [PubMed] [Google Scholar]
- 24. Echouffo‐Tcheugui JB, Batty GD, Kivimaki M, Kengne AP. Risk models to predict hypertension: a systematic review. PLoS One. 2013;8:e67370. [DOI] [PMC free article] [PubMed] [Google Scholar]
- 25. Hallal PC, Victora CG. Reliability and validity of the international physical activity questionnaire (IPAQ). Med Sci Sports Exerc. 2004;36:556. [DOI] [PubMed] [Google Scholar]
- 26. Craig CL, Marshall AL, Sjostrom M, Bauman AE, Booth ML, Ainsworth BE, Pratt M, Ekelund U, Yngve A, Sallis JF, et al. International physical activity questionnaire: 12‐country reliability and validity. Med Sci Sports Exerc. 2003;35:1381–1395. [DOI] [PubMed] [Google Scholar]
- 27. Infinium humancore‐24v1.1 beadchip. 2017. Available at: https://www.illumina.com/content/dam/illumina‐marketing/documents/products/datasheets/datasheet_human_core_beadchip.pdf. Accessed September 24, 2017.
- 28. McRae AF. Analysis of genome‐wide association data. Methods Mol Biol. 2017;1526:161–173. [DOI] [PubMed] [Google Scholar]
- 29. Anderson CA, Pettersson FH, Clarke GM, Cardon LR, Morris AP, Zondervan KT. Data quality control in genetic case‐control association studies. Nat Protoc. 2010;5:1564–1573. [DOI] [PMC free article] [PubMed] [Google Scholar]
- 30. Genomes Project C , Auton A, Brooks LD, Durbin RM, Garrison EP, Kang HM, Korbel JO, Marchini JL, McCarthy S, McVean GA, Abecasis GR. A global reference for human genetic variation. Nature. 2015;526:68–74. [DOI] [PMC free article] [PubMed] [Google Scholar]
- 31. Das S, Forer L, Schonherr S, Sidore C, Locke AE, Kwong A, Vrieze SI, Chew EY, Levy S, McGue M, et al. Next‐generation genotype imputation service and methods. Nat Genet. 2016;48:1284–1287. [DOI] [PMC free article] [PubMed] [Google Scholar]
- 32. Liu C, Kraja AT, Smith JA, Brody JA, Franceschini N, Bis JC, Rice K, Morrison AC, Lu Y, Weiss S, et al. Meta‐analysis identifies common and rare variants influencing blood pressure and overlapping with metabolic trait loci. Nat Genet. 2016;48:1162–1170. [DOI] [PMC free article] [PubMed] [Google Scholar]
- 33. Ganesh SK, Chasman DI, Larson MG, Guo X, Verwoert G, Bis JC, Gu X, Smith AV, Yang ML, Zhang Y, et al. Effects of long‐term averaging of quantitative blood pressure traits on the detection of genetic associations. Am J Hum Genet. 2014;95:49–65. [DOI] [PMC free article] [PubMed] [Google Scholar]
- 34. International Consortium for Blood Pressure Genome‐Wide Association S , Ehret GB, Munroe PB, Rice KM, Bochud M, Johnson AD, Chasman DI, Smith AV, Tobin MD, Verwoert GC, Hwang S‐J, et al. Genetic variants in novel pathways influence blood pressure and cardiovascular disease risk. Nature. 2011;478:103–109. [DOI] [PMC free article] [PubMed] [Google Scholar]
- 35. Newton‐Cheh C, Johnson T, Gateva V, Tobin MD, Bochud M, Coin L, Najjar SS, Zhao JH, Heath SC, Eyheramendy S, et al. Genome‐wide association study identifies eight loci associated with blood pressure. Nat Genet. 2009;41:666–676. [DOI] [PMC free article] [PubMed] [Google Scholar]
- 36. Ganesh SK, Tragante V, Guo W, Guo Y, Lanktree MB, Smith EN, Johnson T, Castillo BA, Barnard J, Baumert J, et al. Loci influencing blood pressure identified using a cardiovascular gene‐centric array. Hum Mol Genet. 2013;22:1663–1678. [DOI] [PMC free article] [PubMed] [Google Scholar]
- 37. Wain LV, Verwoert GC, O'Reilly PF, Shi G, Johnson T, Johnson AD, Bochud M, Rice KM, Henneman P, Smith AV, et al. Genome‐wide association study identifies six new loci influencing pulse pressure and mean arterial pressure. Nat Genet. 2011;43:1005–1011. [DOI] [PMC free article] [PubMed] [Google Scholar]
- 38. Surendran P, Drenos F, Young R, Warren H, Cook JP, Manning AK, Grarup N, Sim X, Barnes DR, Witkowska K, et al. Trans‐ancestry meta‐analyses identify rare and common variants associated with blood pressure and hypertension. Nat Genet. 2016;48:1151–1161. [DOI] [PMC free article] [PubMed] [Google Scholar]
- 39. Kato N, Loh M, Takeuchi F, Verweij N, Wang X, Zhang W, Kelly TN, Saleheen D, Lehne B, Leach IM, et al. Trans‐ancestry genome‐wide association study identifies 12 genetic loci influencing blood pressure and implicates a role for DNA methylation. Nat Genet. 2015;47:1282–1293. [DOI] [PMC free article] [PubMed] [Google Scholar]
- 40. Levy D, Ehret GB, Rice K, Verwoert GC, Launer LJ, Dehghan A, Glazer NL, Morrison AC, Johnson AD, Aspelund T, et al. Genome‐wide association study of blood pressure and hypertension. Nat Genet. 2009;41:677–687. [DOI] [PMC free article] [PubMed] [Google Scholar]
- 41. Johnson AD, Newton‐Cheh C, Chasman DI, Ehret GB, Johnson T, Rose L, Rice K, Verwoert GC, Launer LJ, Gudnason V, et al. Association of hypertension drug target genes with blood pressure and hypertension in 86,588 individuals. Hypertension. 2011;57:903–910. [DOI] [PMC free article] [PubMed] [Google Scholar]
- 42. Tragante V, Barnes MR, Ganesh SK, Lanktree MB, Guo W, Franceschini N, Smith EN, Johnson T, Holmes MV, Padmanabhan S, et al. Gene‐centric meta‐analysis in 87,736 individuals of European ancestry identifies multiple blood‐pressure‐related loci. Am J Hum Genet. 2014;94:349–360. [DOI] [PMC free article] [PubMed] [Google Scholar]
- 43. Johnson T, Gaunt TR, Newhouse SJ, Padmanabhan S, Tomaszewski M, Kumari M, Morris RW, Tzoulaki I, O'Brien ET, Poulter NR, et al. Blood pressure loci identified with a gene‐centric array. Am J Hum Genet. 2011;89:688–700. [DOI] [PMC free article] [PubMed] [Google Scholar]
- 44. Salvi E, Kutalik Z, Glorioso N, Benaglio P, Frau F, Kuznetsova T, Arima H, Hoggart C, Tichet J, Nikitin YP, et al. Genomewide association study using a high‐density single nucleotide polymorphism array and case‐control design identifies a novel essential hypertension susceptibility locus in the promoter region of endothelial NO synthase. Hypertension. 2012;59:248–255. [DOI] [PMC free article] [PubMed] [Google Scholar]
- 45. Padmanabhan S, Melander O, Johnson T, Di Blasio AM, Lee WK, Gentilini D, Hastie CE, Menni C, Monti MC, Delles C, et al. Genome‐wide association study of blood pressure extremes identifies variant near UMOD associated with hypertension. PLoS Genet. 2010;6:e1001177. [DOI] [PMC free article] [PubMed] [Google Scholar]
- 46. Hoffmann TJ, Ehret GB, Nandakumar P, Ranatunga D, Schaefer C, Kwok PY, Iribarren C, Chakravarti A, Risch N. Genome‐wide association analyses using electronic health records identify new loci influencing blood pressure variation. Nat Genet. 2017;49:54–64. [DOI] [PMC free article] [PubMed] [Google Scholar]
- 47. Kraja AT, Cook JP, Warren HR, Surendran P, Liu C, Evangelou E, Manning AK, Grarup N, Drenos F, Sim X, et al. New blood pressure‐associated loci identified in meta‐analyses of 475 000 individuals. Circ Cardiovasc Genet. 2017;10:e001778. [DOI] [PMC free article] [PubMed] [Google Scholar]
- 48. Giri A, Hellwege JN, Keaton JM, Park J, Qiu C, Warren HR, Torstenson ES, Kovesdy CP, Sun YV, Wilson OD, et al. Trans‐ethnic association study of blood pressure determinants in over 750,000 individuals. Nat Genet. 2019;51:51–62. [DOI] [PMC free article] [PubMed] [Google Scholar]
- 49. Takeuchi F, Akiyama M, Matoba N, Katsuya T, Nakatochi M, Tabara Y, Narita A, Saw WY, Moon S, Spracklen CN, et al. Interethnic analyses of blood pressure loci in populations of east asian and european descent. Nat Commun. 2018;9:5052. [DOI] [PMC free article] [PubMed] [Google Scholar]
- 50. Machiela MJ, Chanock SJ. LDassoc: an online tool for interactively exploring genome‐wide association study results and prioritizing variants for functional investigation. Bioinformatics. 2018;34:887–889. [DOI] [PMC free article] [PubMed] [Google Scholar]
- 51. Lu Y, Quan C, Chen H, Bo X, Zhang C. 3DSNP: a database for linking human noncoding SNPs to their three‐dimensional interacting genes. Nucleic Acids Res. 2017;45:D643–D649. [DOI] [PMC free article] [PubMed] [Google Scholar]
- 52. R Core Team . R: A Language and Environment for Statistical Computing. Vienna, Austria: R Foundation for Statistical Computing; 2018. [Google Scholar]
- 53. Allison PD. Change scores as dependent variables in regression analysis. Sociol Methodol. 1990;20:93–114. [Google Scholar]
- 54. Benjamini Y, Hochberg Y. Controlling the false discovery rate—a practical and powerful approach to multiple testing. J R Stat Soc Ser B Methodol. 1995;57:289–300. [Google Scholar]
- 55. Arnholt AT, Evans B. BSDA: Basic Statistics and Data Analysis. R package version 1.2.0, 2017. Available at: https://CRAN.R‐project.org/package=BSDA. Accessed April 22, 2020. [Google Scholar]
- 56. Pepe MS, Kerr KF, Longton G, Wang Z. Testing for improvement in prediction model performance. Stat Med. 2013;32:1467–1482. [DOI] [PMC free article] [PubMed] [Google Scholar]
- 57. Pencina MJ, Neely B, Steyerberg EW. RE: net risk reclassification p values: valid or misleading? J Natl Cancer Inst. 2015;107:355. [DOI] [PubMed] [Google Scholar]
- 58. Robin X, Turck N, Hainard A, Tiberti N, Lisacek F, Sanchez JC, Muller M. pROC: an open‐source package for R and S plus to analyze and compare ROC curves. BMC Bioinformatics. 2011;12:77. [DOI] [PMC free article] [PubMed] [Google Scholar]
- 59. Pepe MS, Janes H, Li CI. Net risk reclassification p values: valid or misleading? J Natl Cancer Inst. 2014;106:dju041. [DOI] [PMC free article] [PubMed] [Google Scholar]
- 60. Jr Harrell FE. rms: Regression Modeling Strategies. 2017. Available at: https://CRAN.R‐project.org/package=rms. Accessed April 24, 2020. [Google Scholar]
- 61. Yang J, Loos RJ, Powell JE, Medland SE, Speliotes EK, Chasman DI, Rose LM, Thorleifsson G, Steinthorsdottir V, Magi R, et al. FTO genotype is associated with phenotypic variability of body mass index. Nature. 2012;490:267–272. [DOI] [PMC free article] [PubMed] [Google Scholar]
- 62. Kurbasic A, Poveda A, Chen Y, Agren A, Engberg E, Hu FB, Johansson I, Barroso I, Brandstrom A, Hallmans G, et al. Gene‐lifestyle interactions in complex diseases: design and description of the GLACIER and VIKING studies. Curr Nutr Rep. 2014;3:400–411. [DOI] [PMC free article] [PubMed] [Google Scholar]
- 63. Lewington S, Clarke R, Qizilbash N, Peto R, Collins R, Prospective Studies C . Age‐specific relevance of usual blood pressure to vascular mortality: a meta‐analysis of individual data for one million adults in 61 prospective studies. Lancet. 2002;360:1903–1913. [DOI] [PubMed] [Google Scholar]
- 64. Klimentidis YC, Raichlen DA, Bea J, Garcia DO, Wineinger NE, Mandarino LJ, Alexander GE, Chen Z, Going SB. Genome‐wide association study of habitual physical activity in over 377,000 uk biobank participants identifies multiple variants including CADM2 and APOE. Int J Obes (Lond). 2018;42:1161–1176. [DOI] [PMC free article] [PubMed] [Google Scholar]
- 65. Sanchez‐Roige S, Fontanillas P, Elson SL, Gray JC, de Wit H, MacKillop J, Palmer AA. Genome‐wide association studies of impulsive personality traits (BIS‐11 and UPPS‐P) and drug experimentation in up to 22,861 adult research participants identify loci in the CACNA1I and CADM2 genes. J Neurosci. 2019;39:2562–2572. [DOI] [PMC free article] [PubMed] [Google Scholar]
- 66. Singer JD, Willett JB. Applied Longitudinal Data Analysis: Modeling Change and Event Occurrence. New York, USA: Oxford University Press; 2003. [Google Scholar]
Associated Data
This section collects any data citations, data availability statements, or supplementary materials included in this article.
Supplementary Materials
Tables S1–S17
Figures S1–S2