

Abstract
Background
Epeleuton is 15‐hydroxy eicosapentaenoic acid ethyl ester, a second‐generation synthetic n‐3 fatty acid derivative of eicosapentaenoic acid. The primary objective was to assess the effect of epeleuton on markers of nonalcoholic fatty liver disease (NAFLD) with post hoc analyses of cardiometabolic markers.
Methods and Results
In a multicenter, randomized, double‐blind, placebo‐controlled trial, 96 adults with nonalcoholic fatty liver disease and body mass index 25 to 40 were randomized in a 1:1:1 ratio to receive epeleuton 2 g/day, epeleuton 1 g/day, or placebo for 16 weeks. A total of 27% of patients had diabetes mellitus. Primary end points of changes in alanine aminotransferase and liver stiffness did not improve at week 16. Secondary and post hoc analyses investigated changes in cardiometabolic markers. Epeleuton 2 g/day significantly decreased triglycerides, very‐low‐density lipoprotein cholesterol, and total cholesterol without increasing low‐density lipoprotein cholesterol. Despite a low mean baseline hemoglobin A1C (HbA1C; 6.3±1.3%), epeleuton 2 g/day significantly decreased HbA1c (−0.4%; P=0.026). Among patients with baseline HbA1c >6.5%, epeleuton 2 g/day decreased HbA1c by 1.1% (P=0.047; n=26). Consistent dose‐dependent reductions were observed for fasting plasma glucose, insulin, and insulin resistance indices. Epeleuton 2 g/day decreased circulating markers of cardiovascular risk and endothelial dysfunction. Epeleuton was well tolerated, with a safety profile not different from placebo.
Conclusions
While epeleuton did not meet its primary end points on alanine aminotransferase or liver stiffness, it significantly decreased triglycerides, HbA1C, plasma glucose, and inflammatory markers. These data suggest epeleuton may have potential for cardiovascular risk reduction and nonalcoholic fatty liver disease by simultaneously targeting hypertriglyceridemia, hyperglycemia, and systemic inflammation. Further trials are planned.
Registration
URL: https://www.clinicaltrials.gov; Unique identifier: NCT02941549.
Keywords: 15‐HEPE, DS102, epeleuton, n‐3 fatty acid
Subject Categories: Clinical Studies, Inflammation, Lipids and Cholesterol, Cardiovascular Disease
Nonstandard Abbreviations and Acronyms
- 15(S)‐HEPE
15‐hydroxy eicosapentaenoic acid
- Adipo‐IR
adipose insulin resistance
- AE
adverse event
- ALT
alanine aminotransferase
- BMI
body mass index
- EPA
eicosapentaenoic acid
- HbA1C
hemoglobin A1C
- HDL‐C
high‐density lipoprotein cholesterol
- HOMA‐IR
homeostatic model assessment for insulin resistance
- hsCRP
high‐sensitivity C‐reactive protein
- LDL‐C
low‐density lipoprotein cholesterol
- mITT
modified intention‐to-treat
- NAFLD
nonalcoholic fatty liver disease
- RLP‐C
remnant lipoprotein cholesterol
- VLDL‐C
very-low‐density lipoprotein cholesterol
Clinical Perspective
What Is New?
In this phase IIa randomized, double‐blind, placebo‐controlled trial, epeleuton, a second‐generation synthetic n‐3 fatty acid derivative of eicosapentaenoic acid, did not decrease the primary end points, liver stiffness, or alanine aminotransferase levels in patients with obesity and nonalcoholic fatty liver disease.
Post hoc analysis revealed hypothesis‐generating findings that epeleuton decreased triglycerides, inflammatory markers, insulin resistance indices, and meaningfully decreased hemoglobin A1C, a novel finding for an n‐3 fatty acid.
What Are the Clinical Implications?
Future trials will be necessary to determine whether epeleuton may have meaningful potential for cardiovascular risk reduction and nonalcoholic fatty liver disease by simultaneously targeting hypertriglyceridemia, hyperglycemia, and systemic inflammation, and to assess the full therapeutic potential of epeleuton.
Nonalcoholic fatty liver disease (NAFLD) is becoming the most common cause of liver disease globally and results from the buildup of fat within the liver commonly in the setting of weight gain and insulin resistance. 1 There are no approved therapies for the treatment of NAFLD, and thus patients can suffer from progressive liver fibrosis and decompensation. Alongside the development of liver disease, many patients with NAFLD are at increased risk of type 2 diabetes mellitus, dyslipidemia, chronic kidney disease, and cardiovascular disease. 1 Indeed, cardiovascular disease remains the leading cause of morbidity and mortality globally, with persistently high rates of ischemic events reported in many populations. 2
Despite the prevalent use of statins; blood pressure control; and therapeutic counseling for smoking abstinence, weight management, and physical activity, ischemic heart disease remains the leading cause of premature adult mortality worldwide. 3 Recent advances in primary and secondary prevention of cardiovascular events provide hope that new therapies targeting various cardiovascular risk factors including elevated triglycerides, inflammation, and hyperglycemia will produce benefits additional to current prevention strategies including low‐density lipoprotein cholesterol (LDL‐C) management with statins. 4 , 5 , 6 , 7 While the novel glucose‐lowering medications for patients with type 2 diabetes mellitus may lessen cardiovascular risk largely independent of glucose lowering per se, there is evidence for cardiovascular benefits of glucose lowering, and Mendelian randomization studies support this. 8 , 9 , 10
Results from the JELIS (Japan Eicosapentaenoic Acid Lipid Intervention Study) and the REDUCE‐IT (Reduction of Cardiovascular Events With Icosapent Ethyl–Intervention Trial) demonstrated superior cardiovascular outcomes with the experimental intervention. In addition, complementary results from several recent epidemiologic and Mendelian randomization studies have advanced treatment of hypertriglyceridemia specifically with higher‐dose eicosapentaenoic acid (EPA) as a potential paradigm for cardiovascular risk reduction. 5 , 11 , 12 , 13 , 14 , 15 Indeed, in the primary analyses of the aforementioned trials, the risk of major adverse cardiovascular events was reduced by 19% and 25%, respectively, compared with the control arms following treatment with EPA's ethyl ester, icosapent ethyl, in patients on optimized statin therapy. 5 , 11 These findings contrast with results from other medications that reduce triglycerides, including low‐dose n‐3 fatty acid combination products (EPA plus docosahexaenoic acid), fibrates, and niacin, where reductions in cardiovascular events have not been significant in the statin era. 16 , 17 Cumulatively, this may suggest that the JELIS and REDUCE‐IT studies do not establish a purely triglyceride‐based paradigm for cardiovascular risk reduction but instead support specific cardiovascular benefits of actions at the EPA axis.
Similarly, recent cardiovascular outcome trials of antihyperglycemic medications have shown that in patients with type 2 diabetes mellitus and established atherosclerotic cardiovascular disease, antihyperglycemic agents can reduce the risk of future cardiovascular events. 18 , 19 , 20 Glucagon‐like peptide 1 receptor agonists and sodium‐glucose cotransporter‐2 inhibitors have emerged as therapeutic classes that significantly reduce the risk of major adverse cardiovascular events in secondary prevention cohorts. 4 However, a recent meta‐analysis did not show similar favorable effects of sodium‐glucose cotransporter‐2 inhibitors for primary prevention of ischemic events in patients without established atherosclerotic cardiovascular disease. 21 Furthermore, cardiovascular outcome trials of dipeptidyl peptidase 4 inhibitors have not shown any cardiovascular benefits. 22 Together, these results indicate that new antihyperglycemic agents that have additional cardiovascular benefits may provide incremental improvements in outcomes compared with current antihyperglycemic therapeutic classes.
Epeleuton is 15‐hydroxy eicosapentaenoic acid (15(S)‐HEPE) ethyl ester, a second‐generation synthetic n‐3 fatty acid derivative of EPA. 15(S)‐HEPE, at much lower concentrations, is an endogenous downstream 15‐lipoxygenase metabolite of EPA that has been associated with potent anti‐inflammatory and antiproliferative effects in nonclinical studies. 23 , 24 The therapeutic effects of 15(S)‐HEPE are thought to be induced by pleiotropic modes of action. We postulated that because of the expected increase in fatty acid oxidation and basal metabolic rate following n‐3 fatty acid treatment, 25 and the observed improvement of NAFLD histology, hepatic fat content, alanine aminotransferase (ALT) and markers of fibrosis in preclinical testing, epeleuton may exert a beneficial treatment effect in patients with NAFLD.
This phase 2a trial was designed to investigate the efficacy and safety of 2 doses of epeleuton; 1 and 2 g/day compared with placebo in patients with NAFLD, a body mass index (BMI) between 25.0 and 40.0 kg/m2, and elevated serum ALT. Because of the high prevalence of metabolic syndrome, type 2 diabetes mellitus, and dyslipidemia in patients with NAFLD, 1 secondary and post hoc analyses were undertaken to compare the lipid‐lowering, antihyperglycemic, and anti‐inflammatory effects of epeleuton 1 g/day and epeleuton 2 g/day with placebo. On the basis of nonclinical pharmacology studies, we hypothesized that epeleuton may exert superior triglyceride‐lowering and anti‐inflammatory effects than its endogenous precursor EPA and may provide additional therapeutic benefits attributable to its distinct chemical structure.
METHODS
Study Design and Oversight
The data that support the findings of this study may be made available from the corresponding author upon reasonable request. This was a 16‐week, multicenter, international, randomized, double‐blind, placebo‐controlled, phase 2a trial (NCT02941549) of epeleuton in patients with NAFLD and elevated BMI. The trial was approved by the central and local institutional review boards or ethics committees and was conducted according to the provisions of the International Conference on Harmonization for Good Clinical Practice, the World Health Organization Declaration of Helsinki, and all applicable regulatory requirements. All participants provided written informed consent before participation in the trial.
Study Participants and Study Conduct
Patients were assigned to trial treatment in accordance with the randomization schedule in permuted blocks stratified according to trial site. Patients meeting all inclusion and no exclusion criteria were randomized in a 1:1:1 ratio to epeleuton 2 g/day (epeleuton 1 g twice daily), epeleuton 1 g/day (epeleuton 500 mg twice daily) or placebo (light liquid paraffin) twice daily.
Eligibility criteria at screening included an age of 18 to 75 years, NAFLD based on the presence of hepatic steatosis on imaging or histology in the absence of secondary causes, BMI between 25.0 and 40.0 kg/m2, and ALT ≥1.5 times the upper limit of normal and <5 times upper limit of normal. Exclusion criteria included weight change >5% in the 3 months before screening, history of gastric bypass surgery, history of or scheduled orthotopic liver transplant, hemoglobin A1C (HbA1c) ≥9%, decompensated or severe liver disease, or patients requiring antihyperglycemic treatment or lipid‐lowering treatment who were not on a stable dose for at least 3 months before screening. Patients were excluded from the trial if they used dietary supplements containing n‐3 or n‐6 fatty acids in the 4 weeks before baseline. Detailed inclusion and exclusion criteria are provided in Table S1.
End Points
The primary end points were changes from baseline to week 16 in ALT and liver stiffness as measured by transient elastography. This was the first clinical trial of epeleuton in this patient population. A sample size of 32 participants per group was estimated to provide 80% power for each of the primary end points, assuming a 20% difference in the percentage change between each epeleuton treatment group and placebo, a standard deviation of 25%, a 2‐sided alpha rate of 0.05 and accounting for a 20% dropout rate. ALT was assessed at baseline and weeks 2, 4, 8, 12, 16, and the week 20 posttreatment follow‐up visit. Liver stiffness was assessed at baseline and week 16.
Changes from baseline of hepatic fat as measured by the controlled attenuation parameter, 26 an ultrasound‐based method for hepatic steatosis measurement, measured at baseline and week 16; homeostatic model assessment for insulin resistance (HOMA‐IR), 27 a surrogate measure of β‐cell function and insulin resistance based on fasting plasma glucose and insulin, measured at baseline and weeks 2, 4, 8, 12, 16, and 20; and adipose insulin resistance (Adipo‐IR), 28 a measure of impaired suppression of lipolysis in the presence of high insulin levels that has been associated with impaired glucose tolerance and elevated plasma free fatty acid levels, measured at baseline and weeks 2, 4, 8, 12, 16, and 20, were assessed as secondary end points.
Lipid and glycemic values were initially measured as safety parameters in the study at baseline and weeks 2, 4, 8, 12, 16, and 20. Post hoc analyses assessed percentage changes from baseline to week 16 of triglycerides, very‐low‐density lipoprotein cholesterol (VLDL‐C), non–high‐density lipoprotein cholesterol (HDL‐C), total cholesterol, HDL‐C, low‐density lipoprotein cholesterol (LDL‐C), and remnant lipoprotein cholesterol (RLP‐C). Non–HDL‐C was calculated by subtracting HDL‐C from total cholesterol. RLP‐C was derived by subtracting LDL‐C from non–HDL‐C. Changes from baseline of HbA1c, fasting plasma glucose, insulin, free fatty acids, and hsCRP (high‐sensitivity C‐reactive protein) were also assessed.
High‐throughput ultrasensitive serum proteomic analyses (OLINK proximity extension assay platform) 29 were performed to quantify changes from baseline to week 16 of a panel of 364 circulating biomarkers associated with systemic inflammation, fibrosis, endothelial dysfunction, cardiovascular risk, and other biological processes. Analytes and bioanalytical laboratories are detailed in Table S2.
Blood samples for trough plasma total and unesterified 15(S)‐HEPE concentrations were collected via direct venipuncture before the first daily dose at baseline; during treatment weeks 2, 4, 8, and 16; and at the week 20 posttreatment follow‐up. Plasma unesterified and total 15(S)‐HEPE concentrations were determined by Charles River Laboratories (Edinburgh) using a validated liquid chromatography–tandem mass spectrometry method.
Statistical Analysis
The primary population for efficacy analyses was a modified intention‐to‐treat (mITT) population that consisted of all randomized patients who received at least 1 dose of the study drug and had 1 postbaseline measurement. The safety population consisted of all patients who received at least 1 dose of the study drug.
The primary end points ALT and liver stiffness, and the prespecified secondary end points hepatic fat measured by controlled attenuation parameter, HOMA‐IR, and Adipo‐IR at each visit were analyzed using a mixed model of repeated measures under missing‐at‐random assumptions. The mixed model of repeated measures included treatment group, visit, and treatment‐by‐visit interaction as fixed effects and baseline as well as treatment‐by‐baseline as interaction terms. Least squares means and corresponding 95% CIs for each treatment group, along with overall and pair‐wise P values were calculated. A 2‐sided P<0.05 was considered statistically significant for all comparisons.
Analysis of changes in triglycerides, non–HDL‐C, VLDL‐C, LDL‐C, HDL‐C, total cholesterol, and RLP‐C were performed using a Wilcoxon rank sum test with the Hodges‐Lehmann median and 95% CIs. The Wilcoxon rank‐sum test was selected as a nonparametric test that is robust against outliers.
Changes from baseline of HbA1c, fasting plasma glucose, insulin, and hsCRP were analyzed using an ANCOVA model with baseline value as a covariate. The proportion of patients with elevated HbA1C that normalized at end of treatment was analyzed using logistic regression with baseline HbA1C as a covariate. A nonparametric ANCOVA model was applied to fasting plasma glucose and insulin because of the presence of outliers.
For analysis of serum proteomics, normalized protein expression values were modeled using a linear mixed effects model with visit, treatment, and the interaction between them as fixed effects and a random intercept for each patient. Post hoc contrasts were used to estimate the changes with treatment within each treatment group. P values of serum proteomics were adjusted for multiple testing using the Benjamini–Hochberg procedure, 30 which controls for false discovery rate.
For all efficacy end points, a hierarchical closed testing procedure was used for comparing each of the epeleuton treatment groups with placebo. Epeleuton 2 g/day versus placebo was tested first. If the test was not significant, the comparison of epeleuton 1 g/day versus placebo was not considered eligible for declaring significance even if the P value was <0.05. A pairwise comparison of epeleuton 2 g versus epeleuton 1 g was also conducted and considered as descriptive. No statistical testing of adverse event rates was performed. Analysis of adverse event rates was descriptive.
Statistical analyses of the primary and secondary end points were conducted using SAS Version 9.2 or above. Post hoc analyses were conducted using SAS JMP Version 14.2.
Results
Patient Population
Between December 2016 and January 2019, a total of 96 patients were enrolled and randomized in permuted blocks of 3 to each of the treatment groups. A total of 33 patients were randomly assigned to epeleuton 2 g/day, 32 to epeleuton 1 g/day, and 31 to placebo. Patient disposition including the numbers of patients who were screened, randomized to a treatment group, and included in the mITT population are shown in the Consolidated Standards of Reporting Trials flow diagram in Figure 1.
Figure 1. Consolidated Standards of Reporting Trials flow diagram of subject disposition.

mITT indicates modified intention‐to‐treat.
Baseline patient characteristics of the mITT population are listed in Table 1. Serum ALT and liver stiffness were higher at baseline in the placebo group, triglycerides were higher in the epeleuton 2 g/day group. Baseline characteristics were otherwise comparable across treatment groups. Median ALT concentrations at baseline were 74.0, 70.5, and 96.5 U/L in the epeleuton 2 g/day, epeleuton 1 g/day, and placebo groups, respectively. Median liver stiffness was 7.90, 8.16, and 8.42 kPa in the epeleuton 2 g/day, epeleuton 1 g/day, and placebo groups, respectively. Median triglyceride levels were 242.0, 146.0, and 150.0 mg/dL in the epeleuton 2 g/day, epeleuton 1 g/day, and placebo groups, respectively. Median LDL‐C levels were 133.0, 133.0, and 138.5 mg/dL in the epeleuton 2 g/day, epeleuton 1 g/day, and placebo groups, respectively. Most (88.2%) patients were not on statin therapy before screening. Baseline HbA1c (%) and fasting plasma glucose were comparable across the treatment groups. Mean HbA1c at baseline was 6.2%; 28.0% of patients had an HbA1c >6.5% at baseline, and 18.3% of patients had a HbA1c >7.0% at baseline; and 25.8% of trial participants were on antihyperglycemic medications.
Table 1.
Baseline Patient Characteristics (mITT Population)
| Epeleuton 2 g/d | Epeleuton 1 g/d | Placebo | |
|---|---|---|---|
| Characteristic | (N=31) | (N=32) | (N=30) |
| Sex, n (%) | |||
| Female | 10 (32.3) | 12 (37.5) | 9 (30.0) |
| Age, y | |||
| Mean (SD) | 45.7 (12.0) | 50.8 (13.7) | 48.8 (11.7) |
| Race, n (%) | |||
| White | 31 (100.00) | 30 (93.75) | 27 (90.00) |
| Other | 0 (0.00) | 2 (6.25) | 3 (10.00) |
| Weight, kg | |||
| Mean (SD) | 95.0 (17.8) | 98.3 (19.3) | 101.2 (16.4) |
| Body mass index, kg/m2 | |||
| Mean (SD) | 31.6 (3.6) | 33.4 (4.4) | 33.4 (4.8) |
| Diabetes mellitus, n (%) | 9 (29.0) | 8 (25.0) | 8 (26.7) |
| Alanine aminotransferase, U/L | |||
| Median (IQR) | 74.0 (40.0) | 70.5 (46.0) | 96.5 (45.0) |
| Liver stiffness, kPa | |||
| Median (IQR) | 7.90 (5.4) | 8.16 (3.2) | 8.42 (4.5) |
| HbA1c (%) | |||
| Mean (SD) | 6.3 (1.31) | 6.2 (1.29) | 6.2 (1.02) |
| HbA1c >6.5%, n (%) | 10 (32.3) | 9 (28.1) | 8 (26.7) |
| HbA1c >7.0%, n (%) | 6 (19.4) | 6 (18.8) | 5 (16.7) |
| Fasting plasma glucose, mg/dL | |||
| Mean (SD) | 119.1 (42.8) | 110.9 (29.9) | 120.3 (40.2) |
| Triglycerides, mg/dL | |||
| Median (IQR) | 242.0 (155.0) | 146.0 (122.3) | 150.0 (94.3) |
| LDL cholesterol, mg/dL | |||
| Median (IQR) | 133.0 (49.0) | 133.0 (59.5) | 138.5 (59.3) |
| Statin use, n (%) | 3 (9.7) | 4 (12.5) | 4 (13.3) |
| Antihyperglycemic use, n (%) | 8 (25.8) | 9 (28.1) | 7 (23.3) |
HbA1c indicates hemoglobin A1C; IQR, interquartile range; and LDL, low‐density lipoprotein.
Primary and Secondary End Points
Treatment with epeleuton at 1 and 2 g/day doses did not result in improvements of the primary end points of serum ALT and liver stiffness at week 16 compared with placebo (Table 2). A decrease from baseline was observed in all treatment groups for both ALT and liver stiffness, reaching significance in the placebo group (ALT, P=0.0008; liver stiffness, P=0.0003) where higher median baseline concentrations were observed (Table 1). ALT decreased by 6.9, 10.1, and 16.3 U/L in the epeleuton 1 g/day, epeleuton 2 g/day, and placebo groups, respectively. Liver stiffness decreased by 1.3, 0.7, and 2.2 kPa in the epeleuton 1 g/day, epeleuton 2 g/day, and placebo groups, respectively.
Table 2.
Change in ALT, Liver Stiffness, and Hepatic Fat
| Epeleuton | Placebo (n=30) | |||||||
|---|---|---|---|---|---|---|---|---|
| Epeleuton 2 g/d (n=31) | Epeleuton 1 g/d (n=32) | |||||||
|
Baseline Value Mean (SD) |
Change From Baseline LS Mean (95% CI) |
P Value (vs Placebo) |
Baseline Value Mean (SD) |
Change From Baseline LS Mean (95% CI) |
P Value (vs Placebo) |
Baseline Value Mean (SD) |
Change From Baseline LS Mean (95% CI) |
|
| ALT, U/L |
93.3 (47.6) |
−10.1 (−36.9, 16.8) * P=0.0737 |
0.7309 |
82.7 (33.8) |
−6.9 (−34.5, 20.7) * P=0.7347 |
0.5946 |
98.1 (35.0) |
−16.3 (−44.2, 11.7) * P =0.0008 |
| Liver stiffness, kPa |
8.99 (6.74) |
−0.73 (−1.55, 0.10) * P=0.1165 |
0.0058 |
8.53 (3.50) |
−1.31 (−2.11, −0.51) * P =0.0038 |
0.0763 |
9.10 (4.12) |
−2.23 (−3.07, −1.38) * P =0.0003 |
| Hepatic fat measured by CAP, dB/m |
327.8 (31.7) |
−22.4 (−43.0, −1.8) * P =0.0093 |
0.4593 |
310.3 (49.5) |
−16.3 (−36.8, 4.1) * P=0.083 |
0.7671 |
332.9 (43.8) |
−12.3 (−34.4, 9.9) * P =0.0106 |
ALT indicates alanine aminotransferase; CAP, controlled attenuation parameter; and LS, least squares.
Indicates P value of within‐group change from baseline.
Analysis of subgroups with BMI >30 and BMI <30 was generally consistent with the mITT analysis for liver stiffness. Among patients with baseline BMI <30, epeleuton 1 and 2 g/day‐treated patients had higher ALT concentrations at baseline and numerically greater reductions than placebo. Conversely, placebo‐treated patients had higher baseline ALT concentrations in the subgroup with BMI >30 and exhibited numerically greater reductions suggesting that changes in ALT were dependent on baseline concentrations (Table S3).
Treatment with epeleuton produced a dose‐dependent reduction of hepatic fat assessed by controlled attenuation parameter, greatest in the epeleuton 2 g/day group but the between‐group comparison did not reach significance at the week 16 end‐of‐treatment visit. Hepatic fat decreased by 16.3, 22.4, and 12.3 U/L in the epeleuton 1 g/day, epeleuton 2 g/day, and placebo groups, respectively (Table 2).
In a dose‐dependent manner, HOMA‐IR improved compared with placebo. Epeleuton 2 g/day reduced least squares mean HOMA‐IR significantly compared with placebo (epeleuton 2 g/day –2.04 points versus placebo −0.39 points; P=0.006) (Table 3 and Figure 2). A similar pattern of dose‐dependent improvement was observed for Adipo‐IR. Epeleuton 2 g/day induced a statistically significant least squares mean decrease of Adipo‐IR compared with placebo (epeleuton 2 g/day −21.07 points versus placebo +3.66 points; P=0.017) (Table 3 and Figure 2).
Table 3.
Change in HbA1c, Glycemic Parameters, Insulin Resistance Parameters, and hsCRP
| Epeleuton | Placebo (n=30) | ||||||||
|---|---|---|---|---|---|---|---|---|---|
| Epeleuton 2 g/d (n=31) | Epeleuton 1 g/d (n=32) | ||||||||
|
Baseline Value Mean (SD) |
Change From Baseline Mean (SD) |
P Value (vs Placebo) |
Baseline Value Mean (SD) |
Change From Baseline Mean (SD) |
P Value (vs Placebo) |
Baseline Value Mean (SD) |
Change From Baseline Mean (SD) |
||
| HbA1c (%) | 6.3 (1.31) | −0.42 (0.75) | 0.0255 | 6.2 (1.29) | −0.10 (0.49) | 0.6827 | 6.2 (1.02) | −0.08 (0.44) | |
| Subgroups | |||||||||
| HbA1c (%) >6.5% | 7.9 (1.03) n=10 | −1.13 (0.91) | 0.0474 | 7.8 (1.25) n=9 | −0.33 (0.84) | 0.8523 | 7.6 (0.75) n==8 | −0.26 (0.66) | |
| HbA1c (%) >7.0% | 8.6 (0.55) n=6 | −1.30 (1.06) | 0.1044 | 8.4 (1.1) n=6 | −0.58 (0.99) | 0.7628 | 8.1 (0.42) n=5 | −0.36 (0.78) | |
| Fasting Plasma Glucose, mg/dL | 119.1 (42.8) | −6.5 (24.1) | 0.0320 | 110.9 (29.9) | −2.2 (12.9) | 0.3155 | 120.3 (40.2) | −0.2 (14.9) | |
| Fasting Plasma FFA, mmol/L | 0.6 (0.24) | −0.05 (0.18) | 0.1245 | 0.5 (0.27) | −0.02 (0.28) | 0.2437 | 0.5 (0.20) | 0.05 (0.24) | |
| Fasting Plasma insulin, uU/L | 20.5 (19.6) | −5.15 (22.00) | 0.1967 | 26.1 (21.4) | −3.87 (10.53) | 0.3295 | 21.2 (11.8) | 0.06 (11.70) | |
| hsCRP, mg/L | 2.7 (2.3) | 1.3 (6.3) | 0.8524 | 3.0 (1.9) | 0.81 (5.7) | 0.9751 | 3.3 (3.2) | 0.07 (3.8) | |
|
Baseline Value Mean (SD) |
Change From Baseline LS Mean (95% CI) |
P Value |
Baseline Value Mean (SD) |
Change From Baseline LS Mean (95% CI) |
P Value |
Baseline Value Mean (SD) |
Change From Baseline LS Mean (95% CI) |
|
|---|---|---|---|---|---|---|---|---|
| HOMA‐IR | 6.1 (5.6) | −2.04 (−2.9, −1.2) | 0.0056 | 7.6 (7.8) | −0.33 (−1.2, 0.6) | 0.9064 | 6.6 (4.9) | −0.39 (−1.3, 0.5) |
| Adipo‐IR | 81.7 (65.5) | −21.07 (−36.4, −5.7) | 0.0168 | 91.2 (70.4) | −10.68 (−26.8, 5.4) | 0.1622 | 75.4 (62.7) | 3.66 (−12.5, 19.9) |
Adipo‐IR indicates adipose tissue insulin resistance; FFA, free fatty acid; HbA1c, hemoglobin A1c; HOMA‐IR, homeostatic model assessment for insulin resistance; hsCRP, high‐sensitivity C‐reactive protein; and LS, least squares.
Figure 2. Change in HbA1c, glycemic, and insulin resistance parameters.
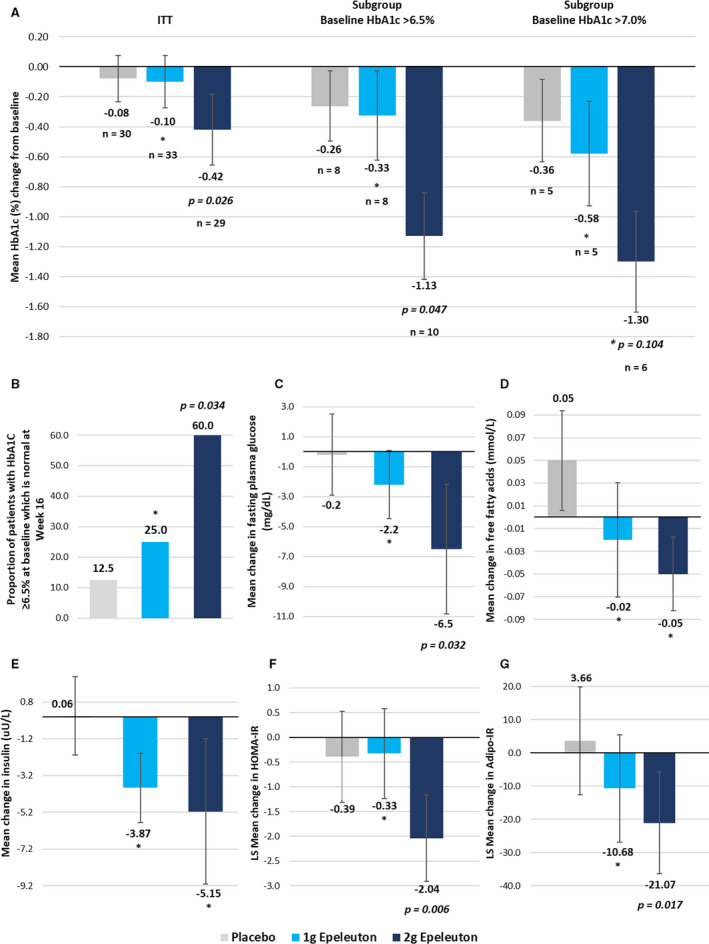
A, Change in HbA1C (%) in placebo and epeleuton groups. B, Proportion of patients with HbA1c >6.5% at baseline which is normal at week 16. C, Change in fasting plasma glucose in placebo and epeleuton groups. D, Change in plasma free fatty acids in placebo and epeleuton groups. E, Change in insulin in placebo and epeleuton groups. F, LS mean change in HOMA‐IR in placebo and epeleuton groups. G, LS mean change in Adipo‐IR in placebo and epeleuton groups. For (A, C, D and E) error bars denote standard error. For (F and G) error bars denote 95% CIs. Adipo‐IR indicates adipose tissue insulin resistance; HbA1c, hemoglobin A1c; HOMA‐IR, homeostatic model assessment for insulin resistance; and LS, least squares. * denotes nonsignificant P values (>0.05) compared with placebo.
Effects of Epeleuton on Triglycerides, Non–HDL‐C, VLDL‐C, and Other Lipid Parameters
Epeleuton significantly decreased triglycerides and other atherogenic lipids from baseline to end‐of‐treatment (Figure 3, Table 4 and Figure S1). In the mITT population, epeleuton 1 g/day reduced median triglyceride levels by 4.6% (P=0.016 versus placebo, P=0.94 versus baseline) and epeleuton 2 g/day reduced median triglyceride levels by 13.9% (P=0.0001 versus placebo, P=0.017 versus baseline). However, median triglyceride levels increased by 24.1% in the placebo group (P=0.008). Analysis of subgroups with elevated triglyceride levels at baseline indicated that in both epeleuton treatment groups, patients with higher baseline triglyceride levels exhibited greater improvements, whereas in the placebo group patients exhibited smaller changes from baseline (Table S4). In patients with triglycerides ≥150 mg/dL at baseline (n=52), treatment with epeleuton 1 and 2 g/day resulted in reductions of 20.3% (P=0.052 versus placebo) and 22.0% (P=0.011 versus placebo) compared with placebo, which exhibited a smaller change from baseline than in the mITT population (+13.9%). Greater reductions from baseline were observed for both epeleuton 1 g/day (−20.6%) and 2 g/day (−25.1%) in patients with triglycerides ≥200 mg/dL at baseline (n = 35), and no increase from baseline was observed for placebo‐treated patients (−5.0%).
Figure 3. Median percentage change in lipid levels in patients receiving placebo, epeleuton 1 g/day or epeleuton 2 g/day (intention‐to‐treat population).

A, Changes in lipid levels at week 16. B, Changes in triglycerides levels at week 16 in the mITT population and subgroups excluding outliers and with elevated triglycerides at baseline. P values are from the Wilcoxon rank‐sum test. Error bars denote 95% CIs. HDL‐C indicates high‐density lipoprotein cholesterol; LDL‐C, low‐density lipoprotein cholesterol; RLP‐C, remnant‐like particle cholesterol; and VLDL‐C, very‐low‐density lipoprotein cholesterol. *Denotes nonsignificant P values (>0.05) compared with placebo.
Table 4.
Median Placebo‐Corrected Percentage Change in Lipid Levels in Patients Receiving Epeleuton 2 g/day or Epeleuton 1 g/day (Intention‐to‐Treat Population)
| Epeleuton | Placebo (n=30) | Between‐Group Differences | ||||||||
|---|---|---|---|---|---|---|---|---|---|---|
| Epeleuton 2 g/d (n=31) | Epeleuton 1 g/d (n=32) | |||||||||
| Baseline Value (mg/dL) | Percent Change From Baseline |
P Value vs Placebo |
Baseline Value (mg/dL) | Percent Change From Baseline |
P Value vs Placebo |
Baseline Value (mg/dL) | Percent Change From Baseline | Epeleuton 2 g/d vs Placebo (%) | Epeleuton 1 g/d vs Placebo (%) | |
| Triglycerides, mg/dL |
242.0 (155.0) |
−13.9 (48.7) * P=0.017 |
0.0001 |
146.0 (122.3) |
−4.6 (54.2) * P=0.94 |
0.0163 |
150.0 (94.3) |
24.1 (47.9) * P=0.008 |
−40.2 (−60.1, −21.5) |
−26.7 (−46.3, −7.1) |
| VLDL‐C, mg/dL |
48.0 (30.0) |
−14.6 (52.9) * P=0.06 |
0.0003 |
28.5 (23.8) |
0.0 (54.1) * P=0.89 |
0.0265 |
29.5 (18.8) |
24.1 (52.2) * P=0.001 |
−39.4 (−60.2, −18.6) |
−25.7 (−45.1, −3.9) |
| Non–HDL‐C, mg/dL |
183.0 (95.0) |
−7.0 (20.0) * P=0.26 |
0.0583 |
165.5 (42.8) |
4.2 (19.7) * P=0.13 |
0.9117 |
165.0 (61.8) |
4.4 (23.1) * P=0.14 |
−8.1 (−17.5, 0.3) |
0.5 (−8.5, 8.8) |
| RLP‐C, mg/dL |
45.0 (29.0) |
−10.0 (48.4) * P=0.25 |
0.0031 |
28.5 (22.5) |
0.0 (45.7) * P=0.66 |
0.0259 |
25.5 (15.3) |
21.2 (71.5) * P=0.003 |
−34.6 (−57.8, −11.9) |
−23.1 (−45.2, −2.8) |
| Total cholesterol, mg/dL |
231.0 (89.0) |
−4.8 (15.8) * P=0.18 |
0.0278 |
206.0 (42.8) |
2.1 (19.0) * P=0.18 |
0.8382 |
213.5 (68.0) |
3.9 (16.7) * P=0.06 |
−8.0 (−14.9, −0.8) |
−0.7 (−8.7, 6.6) |
| LDL‐C, mg/dL |
133.0 (49.0) |
−0.5 (24.4) * P=0.92 |
0.8941 |
133.0 (59.5) |
5.5 (26.8) * P=0.06 |
0.2366 |
138.5 (59.3) |
−2.0 (24.4) * P=0.76 |
−0.5 (−9.4, 8.8) |
5.8 (−5.1, 15.4) |
| HDL‐C, mg/dL |
41.0 (19.0) |
0.0 (16.6) * P=0.80 |
0.8590 |
43.5 (13.8) |
6.7 (16.7) * P=0.0004 |
0.0686 |
42.0 (11.0) |
0.0 (22.9) * P=0.55 |
0.2 (−8.6, 8.4) |
6.7 (−0.3, 14.3) |
HDL‐C indicates high‐density lipoprotein cholesterol; LDL‐C, low‐density lipoprotein cholesterol; RLP‐C, remnant‐like particle cholesterol; and VLDL‐C, very‐low‐density lipoprotein cholesterol.
Indicates P value of within‐group change from baseline. Baseline values and percent changes from baseline are presented as median (interquartile ranges). Median differences between treatment groups and 95% CIs were estimated with the Hodges‐Lehmann method. P values are from the Wilcoxon rank‐sum test.
Epeleuton did not affect LDL‐C levels relative to placebo at either dose. Similar to the dose‐dependent triglyceride‐lowering effect observed, epeleuton 2 g/day produced greater reductions of other lipid parameters than epeleuton 1 g/day. Epeleuton 2 g/day significantly reduced VLDL‐C (P=0.0003), RLP‐C (P=0.003) and total cholesterol (P=0.028) with no effect on HDL‐C. Epeleuton 2 g/day also reduced non–HDL‐C (P=0.058) (Table 4).
Effects of Epeleuton on Glycemic Control and Insulin Sensitivity
Epeleuton produced a dose‐dependent and significant decrease in HbA1c from baseline to end of treatment compared with placebo (Figure 2, Table 3, and Figures S2 and S3). Epeleuton 2 g/day significantly reduced mean HbA1C by 0.42% (P=0.026) compared with placebo (−0.08%). Epeleuton 1 g/day did not significantly reduce HbA1C compared with placebo. Analysis of subgroups by baseline HbA1c indicated that patients with higher HbA1c at baseline exhibited greater HbA1C improvements compared with the mITT population (Table 3). In patients with HbA1c >6.5% at baseline (mean baseline HbA1c, 7.9%), treatment with epeleuton 2 g/day resulted in a significant mean HbA1c reduction of 1.13% (P=0.047; n=26) compared with placebo (−0.26%). Furthermore, among patients with HbA1c >6.5% at baseline, a significantly greater proportion of patients in the epeleuton 2 g/day group (60.0%) than in the placebo group (12.5%) achieved an HbA1c <6.5% at week 16 (P=0.034).
Additionally, epeleuton produced consistent dose‐dependent reductions of multiple indicators of glycemic control and insulin sensitivity including fasting plasma glucose, insulin, and plasma free fatty acids, with greater reductions noted in the epeleuton 2 g/day group (Table 3 and Figure 2). Epeleuton 2 g/day significantly decreased fasting plasma glucose (mean change—epeleuton 2 g/day −6.5 mg/dL versus placebo −0.2 mg/dL; P=0.032). Epeleuton did not affect blood pressure or body weight (Table S5).
Effects of Epeleuton on Markers of Cardiovascular Risk and Inflammation
HsCRP did not change significantly compared with placebo in either of the epeleuton treatment groups (Table 3). However, epeleuton 2 g/day significantly decreased multiple circulating inflammatory markers including cellular adhesion molecules, chemokines, tumor necrosis factor receptor superfamily members, and other biomarkers of cardiovascular risk and diabetes mellitus (Table S6 and Figures S4 through S8). Epeleuton 1 g/day and placebo did not produce significant decreases of markers of cardiovascular risk and inflammation (Tables S7 and S8).
Plasma 15(S)‐HEPE Concentrations
All plasma unesterified 15(S)‐HEPE concentrations were below quantifiable limits for predose samples in all treatment groups as well as for most postdose samples for the placebo group. Predose plasma total 15(S)‐HEPE concentrations were detectable, were similar for placebo, epeleuton 1 g/day, and epeleuton 2 g/day.
Plasma 15(S)‐HEPE concentrations were at pharmacokinetic steady state by 4 weeks and were maintained throughout the 16‐week treatment period. Mean plasma unesterified 15(S)‐HEPE concentrations across trial weeks 2 through 16 were 43.5 and 62.0 ng/mL for epeleuton 1 and 2 g/day, respectively. Mean plasma total 15(S)‐HEPE concentrations across trial weeks 2 through 16 were 355 and 952 ng/mL for epeleuton and 2 g/day, respectively. Concentrations of 15(S)‐HEPE generally increased in a dose‐dependent manner. Concentration versus time profiles for plasma total and unesterified 15(S)‐HEPE in each of the treatment groups are presented in Figures S9 and S10.
Safety
Treatment‐emergent adverse events AEs were reported in 15 (45.5%) patients in the epeleuton 2 g/day group, 20 (62.5%) patients in the epeleuton 1 g/day group and 17 (54.8%) patients in the placebo group. Most treatment‐emergent AEs were mild‐to‐moderate in severity and considered unrelated to study drug. The most common treatment‐emergent AEs were gastrointestinal disorders which were mild‐to‐moderate in intensity and occurred in 6 (18.2%) patients in the epeleuton 2 g/day group, 9 (28.1%) patients in the epeleuton 1 g/day group and 7 (22.6%) patients in the placebo group. One patient in the placebo group (3.2%) discontinued treatment because of a treatment‐emergent AE. No patients in the epeleuton groups discontinued treatment due to an adverse event. In total, 2 non–study drug–related serious AEs were reported during the trial, a pilonidal cyst in a patient in the placebo group and schizophrenia in a patient in the epeleuton 2 g/day group. No serious AEs were considered related to the study drug. No clinically meaningful adverse changes in laboratory parameters, electrocardiographic parameters, vital signs, or physical examinations were noted.
Discussion
In this phase 2a trial, the primary end points of changes in serum ALT and liver stiffness were not met at either dose of epeleuton at 16 weeks. Although numerical decreases were observed in all treatment groups, changes from baseline were significant only in the placebo group that had notably higher median ALT and liver stiffness levels at baseline compared with the epeleuton treatment groups, possibly indicating a regression to the mean effect.
Epeleuton 2 g/day significantly decreased hepatic fat from baseline, although the between‐group comparison between epeleuton 2 g/day and placebo was not significant at week 16. These results are consistent with other short‐duration n‐3 fatty acid studies in patients with NAFLD. 31 , 32 In a phase 2 trial conducted to investigate the effect of dapaglifozin monotherapy, n‐3 carboxylic acid (EPA and docosahexanoic acid) monotherapy and combination treatment with dapaglifozin and n‐3 carboxylic acids on hepatic fat in patients with NAFLD and type 2 diabetes mellitus, both monotherapy groups had significant decreases in hepatic fat from baseline after 12 weeks of treatment, but no significant change occurred in the placebo group. However, only the combination treatment reduced hepatic fat significantly compared with placebo. Notably, n‐3 carboxylic acids did not significantly decrease the levels of hepatocellular injury biomarkers including serum ALT despite the effects on hepatic fat. 31 Both the significant decrease of hepatic fat from baseline and the lack of effect on ALT with n‐3 carboxylic acids mirror the results of the present trial with epeleuton, though, given baseline differences, further studies are needed to validate such findings.
We hypothesized that epeleuton would have beneficial effects in patients with NAFLD because of improvements in liver histology, hepatic fat content, and inflammation observed in preclinical studies and the reported effects of n‐3 fatty acids on fatty acid oxidation and hepatic fat. 25 Although the primary end points were not met in the present trial, changes in hepatic fat indicate a potential utility for epeleuton in the treatment of NAFLD that requires further investigation. Future studies may need to consider longer treatment durations to establish the full effect of epeleuton on hepatic steatosis and combinatorial approaches with complementary therapies to address the multiplicity of pathways responsible for the development of fatty liver injury.
Furthermore, epeleuton decreased triglycerides, VLDL‐C, RLP‐C, total cholesterol, and non–HDL‐C in a dose‐dependent manner, although increases were seen in the placebo group. Additionally, analyses of subgroups with elevated triglycerides at baseline, ≥150 mg/dL, and ≥200 mg/dL demonstrated greater reductions at both doses of epeleuton, suggesting that in a prospectively selected hypertriglyceridemic population, further reductions may be achieved.
The observed reductions in triglycerides with an EPA derivative, while post hoc and hypothesis generating, are particularly relevant after the REDUCE‐IT trial that demonstrated treatment of patients with hypertriglyceridemia on optimized statins with icosapent ethyl resulted in significant reductions in major adverse cardiovascular outcomes. As a result, the REDUCE‐IT results have established a new paradigm for residual cardiovascular risk reduction. 5 , 33 Furthermore, despite the lower daily dose of epeleuton, the reductions of triglycerides observed in the present trial are comparable to those seen in REDUCE‐IT and ANCHOR (Effect of AMR101 [Ethyl Icosapentate] on Triglyceride (Tg) Levels in Patients on Statins With High Tg Levels (≥200 and <500 mg/dL), a phase III trial of icosapent ethyl in patients with high triglyceride levels. 5 , 34 However, it should be acknowledged that differences in trial populations limit the scope of such comparisons.
Notably, the therapeutic effects of epeleuton on multiple lipids were observed without an increase in LDL‐C. This is consistent with results from studies with other EPA‐axis n‐3 fatty acid treatments. 5 , 11 , 34 Definitive differences in cardiovascular outcomes between EPA axis treatments and combination EPA/docosahexaenoic acid treatments will be clarified following the results of the STRENGTH (Statin Residual Risk Reduction With EpaNova in High Cardiovascular Risk Patients With Hypertriglyceridemia) trial, an event‐driven trial of n‐3 carboxylic acids, in statin‐treated patients with high triglyceride and low HDL‐C levels. 35 Notably, the STRENGTH trial has been discontinued following the recommendation of an independent data monitoring committee because of a low likelihood of demonstrating a benefit to patients. 36
Although other studies with n‐3 fatty acids including icosapent ethyl and other EPA preparations have demonstrated a triglyceride‐lowering effect, this has not been associated with an improvement of glycemic control or insulin resistance. 34 , 37 Instead, it had been speculated that non‐EPA n‐3 fatty acids may increase HbA1c levels and predispose to the development of diabetes mellitus. 38 In the present trial, epeleuton 2 g/day significantly decreased, rather than increased, HbA1c at week 16 despite a relatively low mean baseline HbA1c (6.3%). Analysis of subgroups by baseline HbA1c levels indicated that patients with higher HbA1c at baseline exhibited greater improvements. In patients with HbA1c >6.5% at baseline, epeleuton significantly decreased HbA1c by 1.13%. The HbA1c‐lowering effects seen in this trial, while post hoc and hypothesis generating, indicate epeleuton's potential as a novel antihyperglycemic agent for patients with type 2 diabetes mellitus. Importantly, the results in the subgroup analyses, although in a small sample, are comparable to those seen after treatment with most established antihyperglycemics for longer durations of 24 weeks or more. 39 , 40
Epeleuton's effects on hyperglycemia and insulin resistance are also evident in the broadly consistent decreases of multiple parameters including fasting plasma glucose, insulin, and free fatty acids. In this trial, treatment with epeleuton 2 g/day produced significant decreases of HOMA‐IR, which quantifies insulin resistance and beta cell function and correlates with estimates using euglycemic clamp methods. 27
One of the potential explanations for increased risk in patients with high triglycerides is the presence of a proinflammatory state. 41 In fact, it has been speculated that the effects of icosapent ethyl on rates of ischemic events in the REDUCE‐IT trial are not fully explained by its triglyceride‐lowering effect. 42 It is postulated that an anti‐inflammatory effect may have contributed to the magnitude of reduction seen in REDUCE‐IT. In the present analysis, epeleuton 2 g/day did not decrease hsCRP but significantly decreased the circulating levels of an array of chemokines, adhesion molecules, tumor necrosis factor receptor superfamily members, and other markers of endothelial dysfunction, cardiovascular, and diabetes mellitus risk. Notably, in phase 3 studies of icosapent ethyl, reductions of hsCRP compared with baseline levels were observed only at the higher 4 g/day dose and not at the 2 g/day dose, which may suggest that similarly a higher dose of epeleuton is required to decrease hsCRP. 34 , 43 The positive data at the 2 g/day dose and the lack of effect of the lower dose of epeleuton on most inflammatory markers provide mechanistic indications that epeleuton may exert a meaningful systemic and/or tissue‐level anti‐inflammatory effect when administered above a certain dose threshold. These findings also suggest there is merit in examining a dose of 4 g/day in the future.
In summary, the present work builds on the accumulating evidence that multiple strategies may delay the progression of atherosclerosis and reduce the incidence of ischemic events. Treatment of hypertriglyceridemia, hyperglycemia, and inflammation have been individually shown to effectively reduce cardiovascular risk and the rate of ischemic events. Epeleuton is a synthetic EPA‐derived second‐generation n‐3 fatty acid with a therapeutic profile distinct from other n‐3 fatty acids. The results of this trial, while post hoc and exploratory, have identified epeleuton's unique potential to address synergistically multiple axes of cardiovascular risk and several aspects of the metabolic syndrome.
Limitations
The present results are partly based on post hoc analyses, which include subgroups. Although comparisons were made between randomized groups, minimizing the risk of residual confounding, it cannot be fully excluded. Of note, LDL cholesterol levels were not optimized at baseline, and most patients were not on a statin. Additionally, baseline ALT and liver stiffness levels were higher in the placebo group, and baseline triglyceride levels were higher in the epeleuton 2 g/day group. The reported positive post hoc results indicate meaningful therapeutic potential, but they are hypothesis generating and must be reproduced prospectively in patients with hypertriglyceridemia and type 2 diabetes mellitus.
Conclusions
Epeleuton was well tolerated, with a safety profile not different from placebo, and although the primary end‐points of serum ALT and liver stiffness were not met, its administration was associated with significant dose‐dependent decreases of triglycerides, total cholesterol, and multiple atherogenic lipids without raising LDL‐C. Additionally, epeleuton meaningfully decreased HbA1c and fasting plasma glucose, and improved insulin resistance and systemic levels of inflammation and endothelial dysfunction markers. These data suggest that epeleuton may have important therapeutic potential for cardiovascular risk reduction by simultaneously targeting hypertriglyceridemia, hyperglycemia, and inflammation. Further studies will be necessary to confirm these hypothesis‐generating findings and to investigate the full therapeutic effects of epeleuton for the treatment of NAFLD, hyperglycemia and diabetes mellitus, dyslipidemia, and prevention of ischemic events.
Sources of Funding
This work was supported by Afimmune. Afimmune was involved in the design and conduct of the trial, collection, analysis, and interpretation of data; and preparation of this manuscript. Dr Newsome was supported by the National Institute of Health Research (NIHR) Birmingham Biomedical Research Centre (BRC). The views expressed are those of the authors and not necessarily those of the NHS, the NIHR or the Department of Health.
Disclosures
Dr Climax is the CEO and a shareholder of Afimmune and DS Biopharma. Dr Newsome has received grants, consultancy, and nonfinancial support from Novo Nordisk; consultancy from Shire; grants and consultancy from Boehringer Ingelheim; consultancy from Intercept Pharmaceuticals; consultancy from Afimmune; speaker fees from Norgine; consultancy from Gilead Sciences; and consultancy from Pfizer. Drs Hamza, Weissbach, and Coughlan are employees of Afimmune and DS Biopharma. Dr Sattar has consulted for, or received speaker fees from, Afimmune, Amgen, Boehringer Ingelheim, AstraZeneca, Eli Lilly, Novo Nordisk, Sanofi, and Janssen and has received research grant support from Boehringer Ingelheim. Dr McGuire has received honoraria for clinical trial leadership from AstraZeneca, Sanofi Aventis, Janssen, Boehringer Ingelheim, Merck & Co, Pfizer, Novo Nordisk, Lexicon, Eisai Inc, GlaxoSmithKline, and Esperion and honoraria for consultancy from AstraZeneca, Sanofi Aventis, Eli Lilly and Company, Boehringer Ingelheim, Merck & Co, Pfizer, Novo Nordisk, Metavant, Applied Therapeutics, and Afimmune. Dr Bhatt discloses the following relationships—Advisory Board: Cardax, CellProthera, Cereno Scientific, Elsevier Practice Update Cardiology, Level Ex, Medscape Cardiology, PhaseBio, PLx Pharma, Regado Biosciences; Board of Directors: Boston VA Research Institute, Society of Cardiovascular Patient Care, TobeSoft; Chair: American Heart Association Quality Oversight Committee; Data Monitoring Committees: Baim Institute for Clinical Research (formerly Harvard Clinical Research Institute, for the PORTICO trial, funded by St. Jude Medical, now Abbott), Cleveland Clinic (including for the ExCEED trial, funded by Edwards), Contego Medical (Chair, PERFORMANCE 2), Duke Clinical Research Institute, Mayo Clinic, Mount Sinai School of Medicine (for the ENVISAGE trial, funded by Daiichi Sankyo), Population Health Research Institute; Honoraria: American College of Cardiology (Senior Associate Editor, Clinical Trials and News, ACC.org; Vice‐Chair, ACC Accreditation Committee), Baim Institute for Clinical Research (formerly Harvard Clinical Research Institute; RE‐DUAL PCI clinical trial steering committee funded by Boehringer Ingelheim; AEGIS‐II executive committee funded by CSL Behring), Belvoir Publications (Editor in Chief, Harvard Heart Letter), Duke Clinical Research Institute (clinical trial steering committees, including for the PRONOUNCE [A Trial Comparing Cardiovascular Safety of Degarelix Versus Leuprolide in Patients With Advanced Prostate Cancer and Cardiovascular Disease] trial, funded by Ferring Pharmaceuticals), HMP Global (Editor in Chief, Journal of Invasive Cardiology), Journal of the American College of Cardiology (Guest Editor; Associate Editor), K2P (Co‐Chair, interdisciplinary curriculum), Level Ex, Medtelligence/ReachMD (CME steering committees), MJH Life Sciences, Population Health Research Institute (for the COMPASS operations committee, publications committee, steering committee, and USA national co‐leader, funded by Bayer), Slack Publications (Chief Medical Editor, Cardiology Today's Intervention), Society of Cardiovascular Patient Care (Secretary/Treasurer), WebMD (CME steering committees); Other: Clinical Cardiology (Deputy Editor), NCDR‐ACTION Registry Steering Committee (Chair), VA CART Research and Publications Committee (Chair); Research Funding: Abbott, Afimmune, Amarin, Amgen, AstraZeneca, Bayer, Boehringer Ingelheim, Bristol‐Myers Squibb, Cardax, Chiesi, CSL Behring, Eisai, Ethicon, Ferring Pharmaceuticals, Forest Laboratories, Fractyl, Idorsia, Ironwood, Ischemix, Lexicon, Lilly, Medtronic, Pfizer, PhaseBio, PLx Pharma, Regeneron, Roche, Sanofi Aventis, Synaptic, The Medicines Company; Royalties: Elsevier (Editor, Cardiovascular Intervention: A Companion to Braunwald's Heart Disease); Site Co‐Investigator: Biotronik, Boston Scientific, CSI, St. Jude Medical (now Abbott), Svelte; Trustee: American College of Cardiology; Unfunded Research: FlowCo, Merck, Novo Nordisk, Takeda.
Supporting information
Tables S1–S8
Figures S1–S10
Acknowledgments
The authors thank all patients and investigators who participated in the trial. The authors thank Prof Naga P. Chalasani, Prof Arun J. Sanyal, and Prof Scott L. Friedman for their valuable contributions to the clinical development of epeleuton.
J Am Heart Assoc. 2020;9:e016334 DOI: 10.1161/JAHA.119.016334.
Supplementary Materials for this article are available at https://www.ahajournals.org/doi/suppl/10.1161/JAHA.119.016334
For Sources of Funding and Disclosures, see page 15.
References
- 1. Sattar N, Forrest E, Preiss D. Non‐alcoholic fatty liver disease. BMJ. 2014;g4596. [DOI] [PMC free article] [PubMed] [Google Scholar]
- 2. Herrington W, Lacey B, Sherliker P, Armitage J, Lewington S. Epidemiology of atherosclerosis and the potential to reduce the global burden of atherothrombotic disease. Circ Res. 2016;535–546. [DOI] [PubMed] [Google Scholar]
- 3. Anon . Global, regional, and national age–sex specific all‐cause and cause‐specific mortality for 240 causes of death, 1990–2013: a systematic analysis for the Global Burden of Disease Study 2013. Lancet. 2015;117–171. [DOI] [PMC free article] [PubMed] [Google Scholar]
- 4. Zelniker TA, Wiviott SD, Raz I, Im K, Goodrich EL, Furtado RHM, Bonaca MP, Mosenzon O, Kato ET, Cahn A, et al. Comparison of the effects of glucagon‐like peptide receptor agonists and sodium‐glucose cotransporter 2 inhibitors for prevention of major adverse cardiovascular and renal outcomes in type 2 diabetes mellitus. Circulation. 2019;2022–2031. [DOI] [PubMed] [Google Scholar]
- 5. Bhatt DL, Steg PG, Miller M, Brinton EA, Jacobson TA, Ketchum SB, Doyle RT, Juliano RA, Jiao L, Granowitz C, et al. Cardiovascular risk reduction with icosapent ethyl for hypertriglyceridemia. N Engl J Med. 2019;11–22. [DOI] [PubMed] [Google Scholar]
- 6. Ridker PM, Everett BM, Thuren T, MacFadyen JG, Chang WH, Ballantyne C, Fonseca F, Nicolau J, Koenig W, Anker SD, et al. Antiinflammatory therapy with canakinumab for atherosclerotic disease. N Engl J Med. 2017;1119–1131. [DOI] [PubMed] [Google Scholar]
- 7. Verma S, Leiter LA, Mazer CD, Bain SC, Buse J, Marso S, Nauck M, Zinman B, Bosch‐Traberg H, Rasmussen S, et al. Liraglutide reduces cardiovascular events and mortality in type 2 diabetes mellitus independently of baseline low‐density lipoprotein cholesterol levels and statin use: results from the LEADER trial. Circulation. 2018;1605–1607. [DOI] [PubMed] [Google Scholar]
- 8. Ray KK, Seshasai SRK, Wijesuriya S, Sivakumaran R, Nethercott S, Preiss D, Erqou S, Sattar N. Effect of intensive control of glucose on cardiovascular outcomes and death in patients with diabetes mellitus: a meta‐analysis of randomised controlled trials. Lancet. 2009;1765–1772. [DOI] [PubMed] [Google Scholar]
- 9. Ross S, Gerstein HC, Eikelboom J, Anand SS, Yusuf S, Paré G. Mendelian randomization analysis supports the causal role of dysglycaemia and diabetes in the risk of coronary artery disease. Eur Heart J. 2015;1454–1462. [DOI] [PubMed] [Google Scholar]
- 10. Bhatt DL. Yes, hyperglycaemia is indeed a modifiable cardiac risk factor: so says Mendel. Eur Heart J. 2015;1424–1427. [DOI] [PubMed] [Google Scholar]
- 11. Yokoyama M, Origasa H, Matsuzaki M, Matsuzawa Y, Saito Y, Ishikawa Y, Oikawa S, Sasaki J, Hishida H, Itakura H, et al. Effects of eicosapentaenoic acid on major coronary events in hypercholesterolaemic patients (JELIS): a randomised open‐label, blinded endpoint analysis. Lancet. 2007;1090–1098. [DOI] [PubMed] [Google Scholar]
- 12. Ference BA, Kastelein JJP, Ray KK, Ginsberg HN, Chapman MJ, Packard CJ, Laufs U, Oliver‐Williams C, Wood AM, Butterworth AS, et al. Association of triglyceride‐lowering LPL variants and LDL‐C–lowering LDLR variants with risk of coronary heart disease. JAMA. 2019;364. [DOI] [PMC free article] [PubMed] [Google Scholar]
- 13. Nichols GA, Philip S, Reynolds K, Granowitz CB, Fazio S. Increased residual cardiovascular risk in patients with diabetes and high versus normal triglycerides despite statin‐controlled LDL cholesterol. Diabetes Obes Metab. 2019;366–371. [DOI] [PMC free article] [PubMed] [Google Scholar]
- 14. Bhatt DL, Steg PG, Miller M, Brinton EA, Jacobson TA, Ketchum SB, Doyle RT, Juliano RA, Jiao L, Granowitz C, et al. Effects of icosapent ethyl on total ischemic events. J Am Coll Cardiol. 2019;2791–2802. [DOI] [PubMed] [Google Scholar]
- 15. Bhatt DL, Miller M, Brinton EA, Jacobson TA, Steg PG, Ketchum SB, Doyle RT, Juliano RA, Jiao L, Granowitz C, et al. REDUCE‐IT USA: results from the 3,146 patients randomized in the United States. Circulation. 2020;367–375. [DOI] [PMC free article] [PubMed] [Google Scholar]
- 16. Ganda OP, Bhatt DL, Mason RP, Miller M, Boden WE. Unmet need for adjunctive dyslipidemia therapy in hypertriglyceridemia management. J Am Coll Cardiol. 2018;330–343. [DOI] [PubMed] [Google Scholar]
- 17. Patel PN, Patel SM, Bhatt DL. Cardiovascular risk reduction with icosapent ethyl. Curr Opin Cardiol. 2019;721–727. [DOI] [PubMed] [Google Scholar]
- 18. Wiviott SD, Raz I, Bonaca MP, Mosenzon O, Kato ET, Cahn A, Silverman MG, Zelniker TA, Kuder JF, Murphy SA, et al. Dapagliflozin and cardiovascular outcomes in type 2 diabetes. N Engl J Med. 2019;347–357. [DOI] [PubMed] [Google Scholar]
- 19. Neal B, Perkovic V, Mahaffey KW, de Zeeuw D, Fulcher G, Erondu N, Shaw W, Law G, Desai M, Matthews DR. Canagliflozin and cardiovascular and renal events in type 2 diabetes. N Engl J Med. 2017;644–657. [DOI] [PubMed] [Google Scholar]
- 20. Marso SP, Daniels GH, Brown‐Frandsen K, Kristensen P, Mann JFE, Nauck MA, Nissen SE, Pocock S, Poulter NR, Ravn LS, et al. Liraglutide and cardiovascular outcomes in type 2 diabetes. N Engl J Med. 2016;311–322. [DOI] [PMC free article] [PubMed] [Google Scholar]
- 21. Zelniker TA, Wiviott SD, Raz I, Im K, Goodrich EL, Bonaca MP, Mosenzon O, Kato ET, Cahn A, Furtado RHM, et al. SGLT2 inhibitors for primary and secondary prevention of cardiovascular and renal outcomes in type 2 diabetes: a systematic review and meta‐analysis of cardiovascular outcome trials. Lancet. 2019;31–39. [DOI] [PubMed] [Google Scholar]
- 22. Scirica BM, Bhatt DL, Braunwald E, Steg PG, Davidson J, Hirshberg B, Ohman P, Frederich R, Wiviott SD, Hoffman EB, et al. Saxagliptin and cardiovascular outcomes in patients with type 2 diabetes mellitus. N Engl J Med. 2013;1317–1326. [DOI] [PubMed] [Google Scholar]
- 23. Vang K, Ziboh VA. 15‐lipoxygenase metabolites of gamma‐linolenic acid/eicosapentaenoic acid suppress growth and arachidonic acid metabolism in human prostatic adenocarcinoma cells: possible implications of dietary fatty acids. Prostaglandins Leukot Essent Fatty Acids. 2005;363–372. [DOI] [PubMed] [Google Scholar]
- 24. Schuchardt JP, Schneider I, Willenberg I, Yang J, Hammock BD, Hahn A, Schebb NH. Increase of EPA‐derived hydroxy, epoxy and dihydroxy fatty acid levels in human plasma after a single dose of long‐chain omega‐3 PUFA. Prostaglandins Other Lipid Mediat. 2014;23–31. [DOI] [PMC free article] [PubMed] [Google Scholar]
- 25. Couet C, Delarue J, Ritz P, Antoine JM, Lamisse F. Effect of dietary fish oil on body fat mass and basal fat oxidation in healthy adults. Int J Obes Relat Metab Disord. 1997;637–643. [DOI] [PubMed] [Google Scholar]
- 26. Sasso M, Beaugrand M, de Ledinghen V, Douvin C, Marcellin P, Poupon R, Sandrin L, Miette V. Controlled attenuation parameter (CAP): a novel VCTETM guided ultrasonic attenuation measurement for the evaluation of hepatic steatosis: preliminary study and validation in a cohort of patients with chronic liver disease from various causes. Ultrasound Med Biol. 2010;1825–1835. [DOI] [PubMed] [Google Scholar]
- 27. Matthews DR, Hosker JP, Rudenski AS, Naylor BA, Treacher DF, Turner RC. Homeostasis model assessment: insulin resistance and β‐cell function from fasting plasma glucose and insulin concentrations in man. Diabetologia. 1985;412–419. [DOI] [PubMed] [Google Scholar]
- 28. Gastaldelli A, Gaggini M, DeFronzo RA. Role of adipose tissue insulin resistance in the natural history of type 2 diabetes: results from the San Antonio Metabolism Study. Diabetes. 2017;815–822. [DOI] [PubMed] [Google Scholar]
- 29. Assarsson E, Lundberg M, Holmquist G, Björkesten J, Thorsen SB, Ekman D, Eriksson A, Dickens ER, Ohlsson S, Edfeldt G, et al. Homogenous 96‐plex PEA immunoassay exhibiting high sensitivity, specificity, and excellent scalability. PLoS One. 2014;9:e95192. [DOI] [PMC free article] [PubMed] [Google Scholar]
- 30. Benjamini Y, Hochberg Y. Controlling the false discovery rate: a practical and powerful approach to multiple testing. J R Statist Soc B. 1995;289–300. [Google Scholar]
- 31. Eriksson JW, Lundkvist P, Jansson P‐A, Johansson L, Kvarnström M, Moris L, Miliotis T, Forsberg G‐B, Risérus U, Lind L, et al. Effects of dapagliflozin and n‐3 carboxylic acids on non‐alcoholic fatty liver disease in people with type 2 diabetes: a double‐blind randomised placebo‐controlled study. Diabetologia. 2018;1923–1934. [DOI] [PMC free article] [PubMed] [Google Scholar]
- 32. Spooner MH, Jump DB. Omega‐3 fatty acids and nonalcoholic fatty liver disease in adults and children: where do we stand? Curr Opin Clin Nutr Metab Care. 2019;103–110. [DOI] [PMC free article] [PubMed] [Google Scholar]
- 33. Boden WE, Bhatt DL, Toth PP, Ray KK, Chapman MJ, Lüscher TF. Profound reductions in first and total cardiovascular events with icosapent ethyl in the REDUCE‐IT trial: why these results usher in a new era in dyslipidaemia therapeutics. Eur Heart J. 2020;2304–2312. [DOI] [PMC free article] [PubMed] [Google Scholar]
- 34. Ballantyne CM, Bays HE, Kastelein JJ, Stein E, Isaacsohn JL, Braeckman RA, Soni PN. Efficacy and safety of eicosapentaenoic acid ethyl ester (AMR101) therapy in statin‐treated patients with persistent high triglycerides (from the ANCHOR study). Am J Cardiol. 2012;984–992. [DOI] [PubMed] [Google Scholar]
- 35. Nicholls SJ, Lincoff AM, Bash D, Ballantyne CM, Barter PJ, Davidson MH, Kastelein JJP, Koenig W, McGuire DK, Mozaffarian D, et al. Assessment of omega‐3 carboxylic acids in statin‐treated patients with high levels of triglycerides and low levels of high‐density lipoprotein cholesterol: Rationale and design of the STRENGTH trial. Clin Cardiol. 2018;1281–1288. [DOI] [PMC free article] [PubMed] [Google Scholar]
- 36. Update on Phase III STRENGTH trial for Epanova in mixed dyslipidaemia. (AstraZeneca website). 2020. Available at: https://www.astrazeneca.com/media-centre/press-releases/2020/update-on-phase-iii-strength-trial-for-epanova-in-mixed-dyslipidaemia-13012020.html. Accessed July 10, 2020.
- 37. Chowdhury IN. Clinical review, NDA 202057, Vascepa/Icosapent Ethyl. 2012. Available at: http://www.accessdata.fda.gov/drugsatfda_docs/nda/2012/202057Orig1s000MedR.pdf. Accessed July 10, 2020.
- 38. Mozaffarian D, Wu JHY. Omega‐3 fatty acids and cardiovascular disease: effects on risk factors, molecular pathways, and clinical events. J Am Coll Cardiol. 2011;2047–2067. [DOI] [PubMed] [Google Scholar]
- 39. Fioretto P, Giaccari A, Sesti G. Efficacy and safety of dapagliflozin, a sodium glucose cotransporter 2 (SGLT2) inhibitor, in diabetes mellitus. Cardiovasc Diabetol. 2015;142. [DOI] [PMC free article] [PubMed] [Google Scholar]
- 40. Barnett AH, Mithal A, Manassie J, Jones R, Rattunde H, Woerle HJ, Broedl UC. Efficacy and safety of empagliflozin added to existing antidiabetes treatment in patients with type 2 diabetes and chronic kidney disease: a randomised, double‐blind, placebo‐controlled trial. Lancet Diabetes Endocrinol. 2014;369–384. [DOI] [PubMed] [Google Scholar]
- 41. Miller M, Stone NJ, Ballantyne C, Bittner V, Criqui MH, Ginsberg HN, Goldberg AC, Howard WJ, Jacobson MS, Kris‐Etherton PM, et al. Triglycerides and cardiovascular disease. Circulation. 2011;2292–2333. [DOI] [PubMed] [Google Scholar]
- 42. Kastelein JJP, Stroes ESG. FISHing for the miracle of eicosapentaenoic acid. N Engl J Med. 2019;89–90. [DOI] [PubMed] [Google Scholar]
- 43. Bays HE, Ballantyne CM, Braeckman RA, Stirtan WG, Soni PN. Icosapent ethyl, a pure ethyl ester of eicosapentaenoic acid: effects on circulating markers of inflammation from the MARINE and ANCHOR Studies. Am J Cardiovasc Drugs. 2013;37–46. [DOI] [PMC free article] [PubMed] [Google Scholar]
Associated Data
This section collects any data citations, data availability statements, or supplementary materials included in this article.
Supplementary Materials
Tables S1–S8
Figures S1–S10