

Abstract
Emerging research has identified metabolic pathways that are crucial for the proper regulation of immune cells and how, when deranged, can cause immune dysfunction and disease progression. However, due to technical limitations such insights have relied heavily on bulk measurements in immune cells, often activated in vitro. But with the emergence of single-cell applications, researchers can now estimate the metabolic state of individual immune cells in clinical samples. Here, we review these single-cell techniques and their ability to validate common principles in immunometabolism, while also revealing context-dependent metabolic heterogeneity within the immune cell compartment. We also discuss current gaps and limitations, as well as identifying future opportunities to move the field forward towards the development of therapeutic targets and improved diagnostic capabilities.
Introduction
Metabolism is at the core of all biological processes and can be broadly subdivided into anabolic processes that use energy and building blocks for biosynthesis, and catabolic processes that provide the raw material for anabolism as well as producing energy to fuel biological functions. In addition to these functions, metabolic enzymes and intermediates have important regulatory roles and are major controllers of cellular behavior. Recent studies in the field of immunometabolism have demonstrated a close connection between metabolic programs and the specific immune functions they support during both health and disease (Ayres, 2020; Buck et al., 2017; Makowski et al., 2020; O’Neill et al., 2016). Dysregulation of these core metabolic programs is linked to many modern diseases, including cancer and chronic inflammatory metabolic diseases such as diabetes, obesity, atherosclerosis and rheumatoid arthritis (Ketelhuth et al., 2019; Koelwyn et al., 2018; Lim et al., 2020; Tabas and Bornfeldt, 2020; Turbitt et al., 2020). Yet, a detailed understanding of the immunometabolic remodeling that occurs in pathogenic settings is mostly lacking, largely due to the complex nature of the diseases and involved cellular phenotypes.
Alterations in nutrient levels, oxygen availability, the presence of signaling factors and crosstalk with neighboring cells induce metabolic changes that allow the cell to function in its specific tissue microenvironment (Caputa et al., 2019; Van den Bossche and Saraber, 2018). As every cell resides in a unique environment, no single cell within our body is completely identical metabolically, phenotypically and functionally. Addressing the spatiotemporal aspect of immunometabolism and unravelling this complexity at a single-cell resolution will move the immunometabolism field forward, allowing translation to clinical applications and understanding the fundamentals of in vivo immunology. Indeed, to fully understand the mechanisms by which cellular metabolism regulates immunity and disease progression researchers need to be able to resolve the trajectory by which immune cells metabolically transit into their effector phenotype. Arguably, single-cell profiling technology possess the power to address all of the above questions, even at the current state of development.
In this Perspective, we explore how current and emerging state-of-the-art technologies contribute to our understanding of metabolic regulation of immunity and discuss the transition from bulk to single-cell immunometabolic profiling (Ahl et al., 2020; Hartmann et al., 2020; Levine et al., 2020; Miller et al., 2017; Xiao et al., 2019).
Common bulk metabolic analyses
Extracellular flux analysis.
Extracellular flux analyzers, such as the Seahorse apparatus, perform real-time recordings of the extracellular acidification rate (ECAR) and oxygen consumption rate (OCR) as key readouts of metabolism, and as such provide indirect measurements of glycolysis and mitochondrial respiration, respectively. While the use of specific substrates and inhibitors allows one to investigate the relative preference of a cell for glucose, glutamine or fatty acids, extracellular flux analysis does not yield detailed information about the activity of metabolic pathways outside of glycolysis and the TCA cycle within the mitochondria. Nevertheless, the fact that this technology allows the easy, fast and reasonably affordable profiling of cells in a 96-well format strongly contributed to the expansion of the immunometabolism field (Pelgrom et al., 2016; Van den Bossche et al., 2015; van der Windt et al., 2016). Some of the key findings obtained using the Seahorse instrument include the glycolytic switch and mitochondrial dysfunction in inflammatory macrophages, increased glycolysis in effector T cells and activated dendritic cells and the heightened mitochondrial respiration in T memory cells and IL-4-activated macrophages (Everts et al., 2014; Huang et al., 2014; Van den Bossche et al., 2016; van der Windt et al., 2012). Noteworthy, ECAR is a surrogate marker for glycolysis and it is important to stress that acidification may not always result from enhanced glycolysis. Indeed, CO2 production within respiring mitochondria and/or extracellular release of TCA cycle intermediates (e.g. succinate) also acidify the culture medium. This limitation can be overcome by performing targeted metabolomics or fluxomics for the glycolysis pathway.
Steady state metabolomics.
For a given timepoint, metabolomics measures steady state levels of a broad range of metabolites via liquid or gas chromatography mass spectrometry (LCMS or GCMS). While untargeted metabolomics measures hundreds of metabolites in biological samples, targeted metabolomics assesses preselected metabolites and yields data with higher sensitivity and allows for accurate absolute quantification of metabolite concentrations. In addition to measuring small metabolites, high-resolution MS-based profiling has been recently applied in “shotgun” lipidomics to profile the lipidome of differentially activated macrophages (Dennis et al., 2010; Hsieh et al., 2020). Most MS-based approaches still require relatively high levels of input material (on the order of 100,000s of cells), yet recent developments provide an avenue to spatially measure metabolites at a single-cell resolution. For more in-depth information on the recent developments in the field of spatial and single-cell metabolomics we refer to excellent reviews on key emerging methods, including matrix-assisted laser desorption ionization (MALDI)-MS imaging and secondary ion mass spectrometry (SIMS) (Duncan et al., 2019; Gilmore et al., 2019). Combining such analysis with the single-cell approaches discussed in this Perspective will certainly help to unravel the immunometabolism at single-cell resolution within complex tissue microenvironments in vivo.
Fluxomics.
Altered flow through a given pathway does not necessarily correlate directly with metabolite levels within this pathway as measured by metabolomic profiling at a set timepoint. The use of stable isotope 13C-labeled or 15N-labeled substrates and measurement of isotopologues through targeted mass spectrometry at serial time points allows one to determine metabolic fluxes and pathway dynamics. While metabolomics provides a “snapshot” of the metabolites present at one particular moment, 13C/15N label-tracing (or so-called fluxomics) could be regarded as a “movie” that yields insight into the relative flux through distinct metabolic paths. The use of such analyses is still in its infancies at single-cell resolution but can be readily used by the community to quantify the rates of specific metabolic reactions in bulk approaches such as the Mass Isotopomer Multi-Ordinate Spectral Analysis (MIMOSA fluxomics) as developed in the Kibbey Lab (Alves et al., 2015).
Key immunometabolism concepts derived from bulk analyses
The descriptions of the distinct metabolic pathways below provide minimal immunometabolism background for the distinct metabolic proteins that are most frequently targeted in the single-cell metabolic profiling approaches discussed later in this article. For more details on immunometabolism, we refer to excellent and more comprehensive reviews on this subject in diverse immune cells and diseases (Ayres, 2020; Buck et al., 2017; Makowski et al., 2020; O’Neill et al., 2016).
Glycolysis supports diverse immune effector functions.
Immune activation is an energy-demanding process that is typically accompanied by an increase in glycolytic flux. Glycolysis starts with the uptake of glucose by glucose transporters (e.g. GLUT1, which is predominant in immune cells) and subsequent processing in the cytosol to yield pyruvate, generating ATP and reducing NAD+ to NADH during the process (Figure 1A). Elegant research highlights the direct control of immune effector functions by the glycolytic enzymes hexokinase 1 and 2 (HK1 and HK2), glyceraldehyde-3-phosphate dehydrogenase (GAPDH), enolase and the pyruvate kinase isoenzyme M2 (PKM2) (Chang et al., 2013; Galvan-Pena et al., 2019; Moon et al., 2015; Palsson-McDermott et al., 2015). To maintain glycolytic flux in the absence of mitochondrial oxidative phosphorylation, cells can reduce pyruvate to lactate via lactate dehydrogenase (LDH) to recycle NADH into NAD+. This fermentation reaction can be measured as ECAR in Seahorse analysis when protons, along with glycolysis-derived lactate, are exported from the cell by monocarboxylate transporter MCT1. While glycolysis is most prominent in inflammatory immune effector cells (Krawczyk et al., 2010; Michalek et al., 2011), it is critical for diverse modes of immune activation, including alternative macrophage activation and the induction of T regulatory (Treg) cells, and glycolytic rates differ between B and T lymphocytes (Caro-Maldonado et al., 2014; De Rosa et al., 2015; Huang et al., 2016; Van den Bossche et al., 2016) (Figure 1B).
Figure 1 – Key metabolic pathways in immune cell subtypes.

A. Overview of the most important metabolic pathways regulating immune cells, including the metabolic targets that were used in recent single-cell profiling approaches. B. Summary of the metabolic characteristics and needs of various immune cell subsets as detailed in the text and as reviewed earlier elsewhere (O’Neill et al., 2016; Van den Bossche et al., 2017).
The pentose phosphate pathway is particularly important in inflammatory myeloid cells.
The pentose phosphate pathway (PPP) branches off from the glycolytic pathway when hexokinase-derived glucose-6-phosphate is oxidized by G6P dehydrogenase (G6PD), the rate-limiting step of the PPP (Figure 1A). This oxidative branch generates reducing equivalents of NADPH that have multiple roles in immune cells. Neutrophils and inflammatory macrophages use the PPP and especially NADPH oxidase to generate reactive oxygen species (ROS) to combat infectious agents (Figure 1B). Moreover, NADPH is used to generate fatty acids (through fatty acid synthesis, FAS) and anti-oxidants, such as glutathione, that prevent excessive tissue damage. Nucleotide and amino acid precursors needed to support cell proliferation are produced in the non-oxidative branch of the PPP. Together, both branches of the PPP support anabolic programs and immune effector functions (Baardman et al., 2018; Haschemi et al., 2012).
The TCA cycle and ETC as a central hub.
The TCA cycle and mitochondrial electron transport chain (ETC)-based energy production are key elements of life as most cells rely on energy production via oxidative phosphorylation (OXPHOS) which is typically evaluated measuring OCR. Compared to glycolysis, OXPHOS is much more efficient in generating energy, and thus this pathway is typically associated with the longevity of homeostatic immune cells such as alternatively activated macrophages or B and T memory cells (Lam et al., 2016; van der Windt et al., 2013). Yet, during pro-inflammatory activation of macrophages, the TCA cycle is significantly remodeled via downregulation of IDH and SDH activity (Jha et al., 2015). The latter is achieved through direct inhibition by the immunoregulatory metabolite itaconate that is specifically produced by ACOD1/IRG1 in activated myeloid cells (Lampropoulou et al., 2016; O’Neill and Artyomov, 2019; Swain et al., 2020).
Fatty acid metabolism supports immune cell phenotypes and functions.
Fatty acid oxidation (FAO) is a catabolic pathway converting fatty acids into products like acetyl-CoA, NADH and FADH2 which are used in the mitochondria to generate energy. Carnitine palmitoyl transferase 1 and 2 (CPT1/CPT2) shuttle long-chain fatty acids into the mitochondrial matrix for subsequent oxidation to acetyl-CoA by hydroxyacyl-CoA dehydrogenase (HADHA). Experiments using often too high concentrations of the CPT1-inhibitor etomoxir suggested that FAO is particularly important in IL-4-induced macrophages, memory T cells and Tregs (Michalek et al., 2011; van der Windt et al., 2012; Vats et al., 2006). Yet, recent literature employing cell-specific genetic knockouts for CPT1 and CPT2 reports that FAO is mostly dispensable for these processes (Divakaruni et al., 2018; Nomura et al., 2016; Raud et al., 2018; Van den Bossche and van der Windt, 2018).
As opposed to FAO, fatty acid synthesis (FAS) is an anabolic pathway converting cytosolic acetyl-CoA into lipids. Acetyl-CoA carboxylase (ACC) first carboxylates acetyl-CoA to malonyl-CoA which is subsequently elongated by fatty acid synthase (FASN). FAS supports cellular proliferation of effector T cells and is key to configure the plasma membrane for inflammatory signaling in macrophages, and for endoplasmic reticulum synthesis to allow cytokine secretion by activated dendritic cells (DCs)(Everts et al., 2014; Wang et al., 2011).
Amino acid metabolism is differentially regulated in distinct immune cells.
Immune activation of T cells is associated with an increased demand for amino acid metabolism as exemplified by the importance of L-type amino acid transporter 1 (LAT1, CD98, SLC7A5) and the serine pathway for successful signaling upon TCR engagement (Hayashi et al., 2013; Ma et al., 2017; Ma et al., 2019). Furthermore, amino acids play a role in fine-tuning the specific direction of immune responses. For instance, both Th1 and Th17 cells increase glutamine usage via the transporter protein ASCT2 in response to antigen receptor stimulation, whereas anti-inflammatory Tregs are not affected by altered glutamine supply (Nakaya et al., 2014). Glutaminase (GLS) converts glutamine into glutamate to fuel the TCA cycle, and this pathway promotes Th17 differentiation whilst diminishing Th1 and cytotoxic T lymphocyte differentiation (Johnson et al., 2018).
In macrophages amino acids also play important functional and regulatory roles. Glutamine metabolism has been associated with anti-inflammatory polarization programs, and serine metabolism was implicated in the regulation of IL-1β production (Jha et al., 2015; Rodriguez et al., 2019). Furthermore, amino acids can also be used for the production of effector molecules in macrophages. LPS(+IFNγ)-induced macrophages mainly convert arginine into nitric oxide (NO) via inducible NO synthase (iNOS), whilst IL-4-stimulated macrophages predominantly metabolize arginine into ornithine and polyamines (Munder et al., 1998; Van den Bossche et al., 2012). For more information on how amino acids regulate immunity, we refer to an excellent recent review on this topic (Kelly and Pearce, 2020).
Importantly, most of the concepts described so far were derived from bulk measurements in immune cells that were cultured and activated in vitro. As discussed below, technological limitations largely prevented the validation of current dogmas in vivo and the determination of the spatiotemporal facets of immunometabolism. Next, we describe the single-cell approaches addressing these key open questions to push the immunometabolism field to the next level.
Limitations of current approaches and associated gaps in our knowledge
The need for in vitro to in vivo validation.
Given the importance of environmental factors, immune cell metabolism in laboratory cell culture is obviously different than in vivo. Indeed, Ma et al. recently used a 13C-glucose infusion method in mice to investigate the metabolism of CD8+ T cells in response to Listeria infection and observed fundamentally different metabolic profiles for activated T cells in vivo (Ma et al., 2019). While in vitro-activated T cells show a shift away from OXPHOS towards glycolysis, CD8+ T cells activated in vivo display higher rates of oxidative metabolism and a reliance on glucose-dependent biosynthesis of the amino acid serine. The approach developed in this work requires delicate experimental implementation and is not readily scalable or applicable to human samples. This translation to the human setting is important since animal models have their limitations and not always replicate human immunology and biology. Generally, the further development of in vivo (or ex vivo) assessments of cellular metabolism with these and other techniques has a high priority in the field. Meanwhile, the validation of key concept in immunometabolism research in vivo, especially in humans, requires alternate options for metabolic profiling.
The need to understand the spatiotemporal aspects of immunometabolism.
Immune cells heavily rely on a timely supply of nutrients, which can differ depending on the location of the cell within the microenvironment of a tumor or inflammation site (Caputa et al., 2019; Van den Bossche and Saraber, 2018). Sorting and bulk measurements inevitably average profiles over cell populations which obscures the effects of timing and environmental variables. As such, understanding the cell’s metabolic state at single-cell resolution can explain the molecular mechanisms underlying their phenotypic heterogeneity within complex tissue microenvironments in vivo. This could help to understand the reasons behind their functioning, or their inability to function properly in pathological settings. Most recent transcriptional and imaging technologies can resolve the spatial arrangement of individual cells or even metabolites, and their further development will be critical to establish the next level of understanding of immunometabolic remodeling in human samples and in in vivo settings (Mazumdar et al., 2020; Van den Bossche et al., 2017). Timing is another aspect that is often overlooked in the immunometabolism field. We know most immune cells rapidly ramp up glycolysis upon activation and this ultimately leads to the increased metabolic fluxes and abundance of specific metabolites in their effector state (typically assessed after 24 h). Yet, how this happens over time and how it supports the acquisition of the effector phenotype and disease progression is not well-understood. Resolving the kinetics by which immune cells metabolically transits into their effector phenotype are essential to define which events are the cause and what are the subsequent consequences. Together, understanding this spatiotemporal aspect of immunometabolism will not only revolutionize our knowledge of fundamental biology, but also aid the rational design of new therapeutic approaches.
Cell numbers and sorting time limitation.
The lack of in vitro to in vivo transitions and mouse-to-human validations can be at least partially explained by the technological limitations of the commonly used bulk analysis techniques in immunometabolism research. A major caveat of both metabolomics and extracellular flux analysis is the need for relatively high cell numbers that are often not present in human clinical samples. For example, the Seahorse XF analyzer measures extracellular fluxes in tens to hundreds of thousands of cells per well and typically requires 4–5 replicate wells per condition. For metabolomics, researchers typically measure half a million pooled cells per replicate and even with this high input, the metabolic coverage is limited as we typically measure a few hundred metabolites out of the estimated thousands present in the cell. Another drawback of extracellular flux analysis and metabolomics is the fact that both assess metabolic features that are not very stable. As such, the obtained results can be strongly affected by lengthy and harsh tissue digestion and (FACS) sorting protocols (Llufrio et al., 2018). Therefore, new metabolic profiling methods accompanied by novel, optimized cell isolation approaches are needed to measure stable metabolic features within small quantities of immune cells ex vivo.
Leveraging different ‘omics approaches for the indirect metabolic assessment.
The instability of metabolite levels can be at least partially overcome by integrating metabolomics with other ‘omics data that are more stable during processing such as transcriptomics and proteomics. Metabolic fluxes can be regarded as the net result of metabolite levels and the presence and activity of the enzymes that metabolize them. Gene expression analysis and proteomics can already give some insight in the regulation of metabolic pathways but becomes particularly powerful when integrated with metabolomics data. Using a network integration approach, Jha et al. identified an important metabolic break in the TCA cycle that supports inflammatory macrophage responses (Jha et al., 2015). Baardman et al. also combined metabolomics and transcriptomics data to demonstrate that a defective PPP is associated with decreased inflammatory responses in lipid-laden macrophages (Baardman et al., 2018). Similarly, integration of bulk proteomics and metabolomics revealed the metabolic requirements for T cell activation (Geiger et al., 2016). These distinct ‘omics approaches, especially when integrated, can reveal (de)regulated metabolic hubs that can be functionally tested using genetic tools or pharmacological compounds.
Single-cell metabolomics is currently too premature for large-scale applications and thus alternate approaches are needed for immunometabolism research to enter the single-cell era. Previous successes using bulk transcriptomics and proteomics to delineate cellular metabolism shows that using the related single-cell ‘omics approaches is the way to go at the moment. To this end, the latest single-cell RNA-sequencing and cytometry-based approaches that map the metabolic landscape at single-cell resolution are discussed in the next parts of this article.
Metabolic analysis based on single-cell transcriptomics
With the advent of single-cell RNA-sequencing (scRNA-seq), one can resolve transcriptional profiles of individual cells within complex multicellular ecosystems, which is critically important in an immunological context. Using the common 10x Genomics pipeline, scRNA-seq experiments nowadays profile up to ten thousand cells per sample, routinely detecting two to four thousand genes per cell. Even direct examination of scRNA-seq data in an immunological context can be very illuminating with regard to the key metabolic processes that occur in vivo. For example, we can use data on the immune cells within murine sarcomas that were treated either with immune checkpoint blockade (ICB) anti-PD-1/anti-CTLA-4 antibodies or with control antibodies (Gubin et al., 2018). In this system, ICB treatment leads to tumor rejection which is paralleled by overall activation of the immune compartment and the appearance of activated cells within the myeloid compartment (Gubin et al., 2018). As illustrated in Figure 2A–B we created a visualization of the information from this scRNA-seq dataset to demonstrate the behavior of some key metabolic genes in the immune cell subsets; notably:
Figure 2 – Expression of some key metabolic genes in intratumoral immune cells based on published single-cell transcriptomics data.
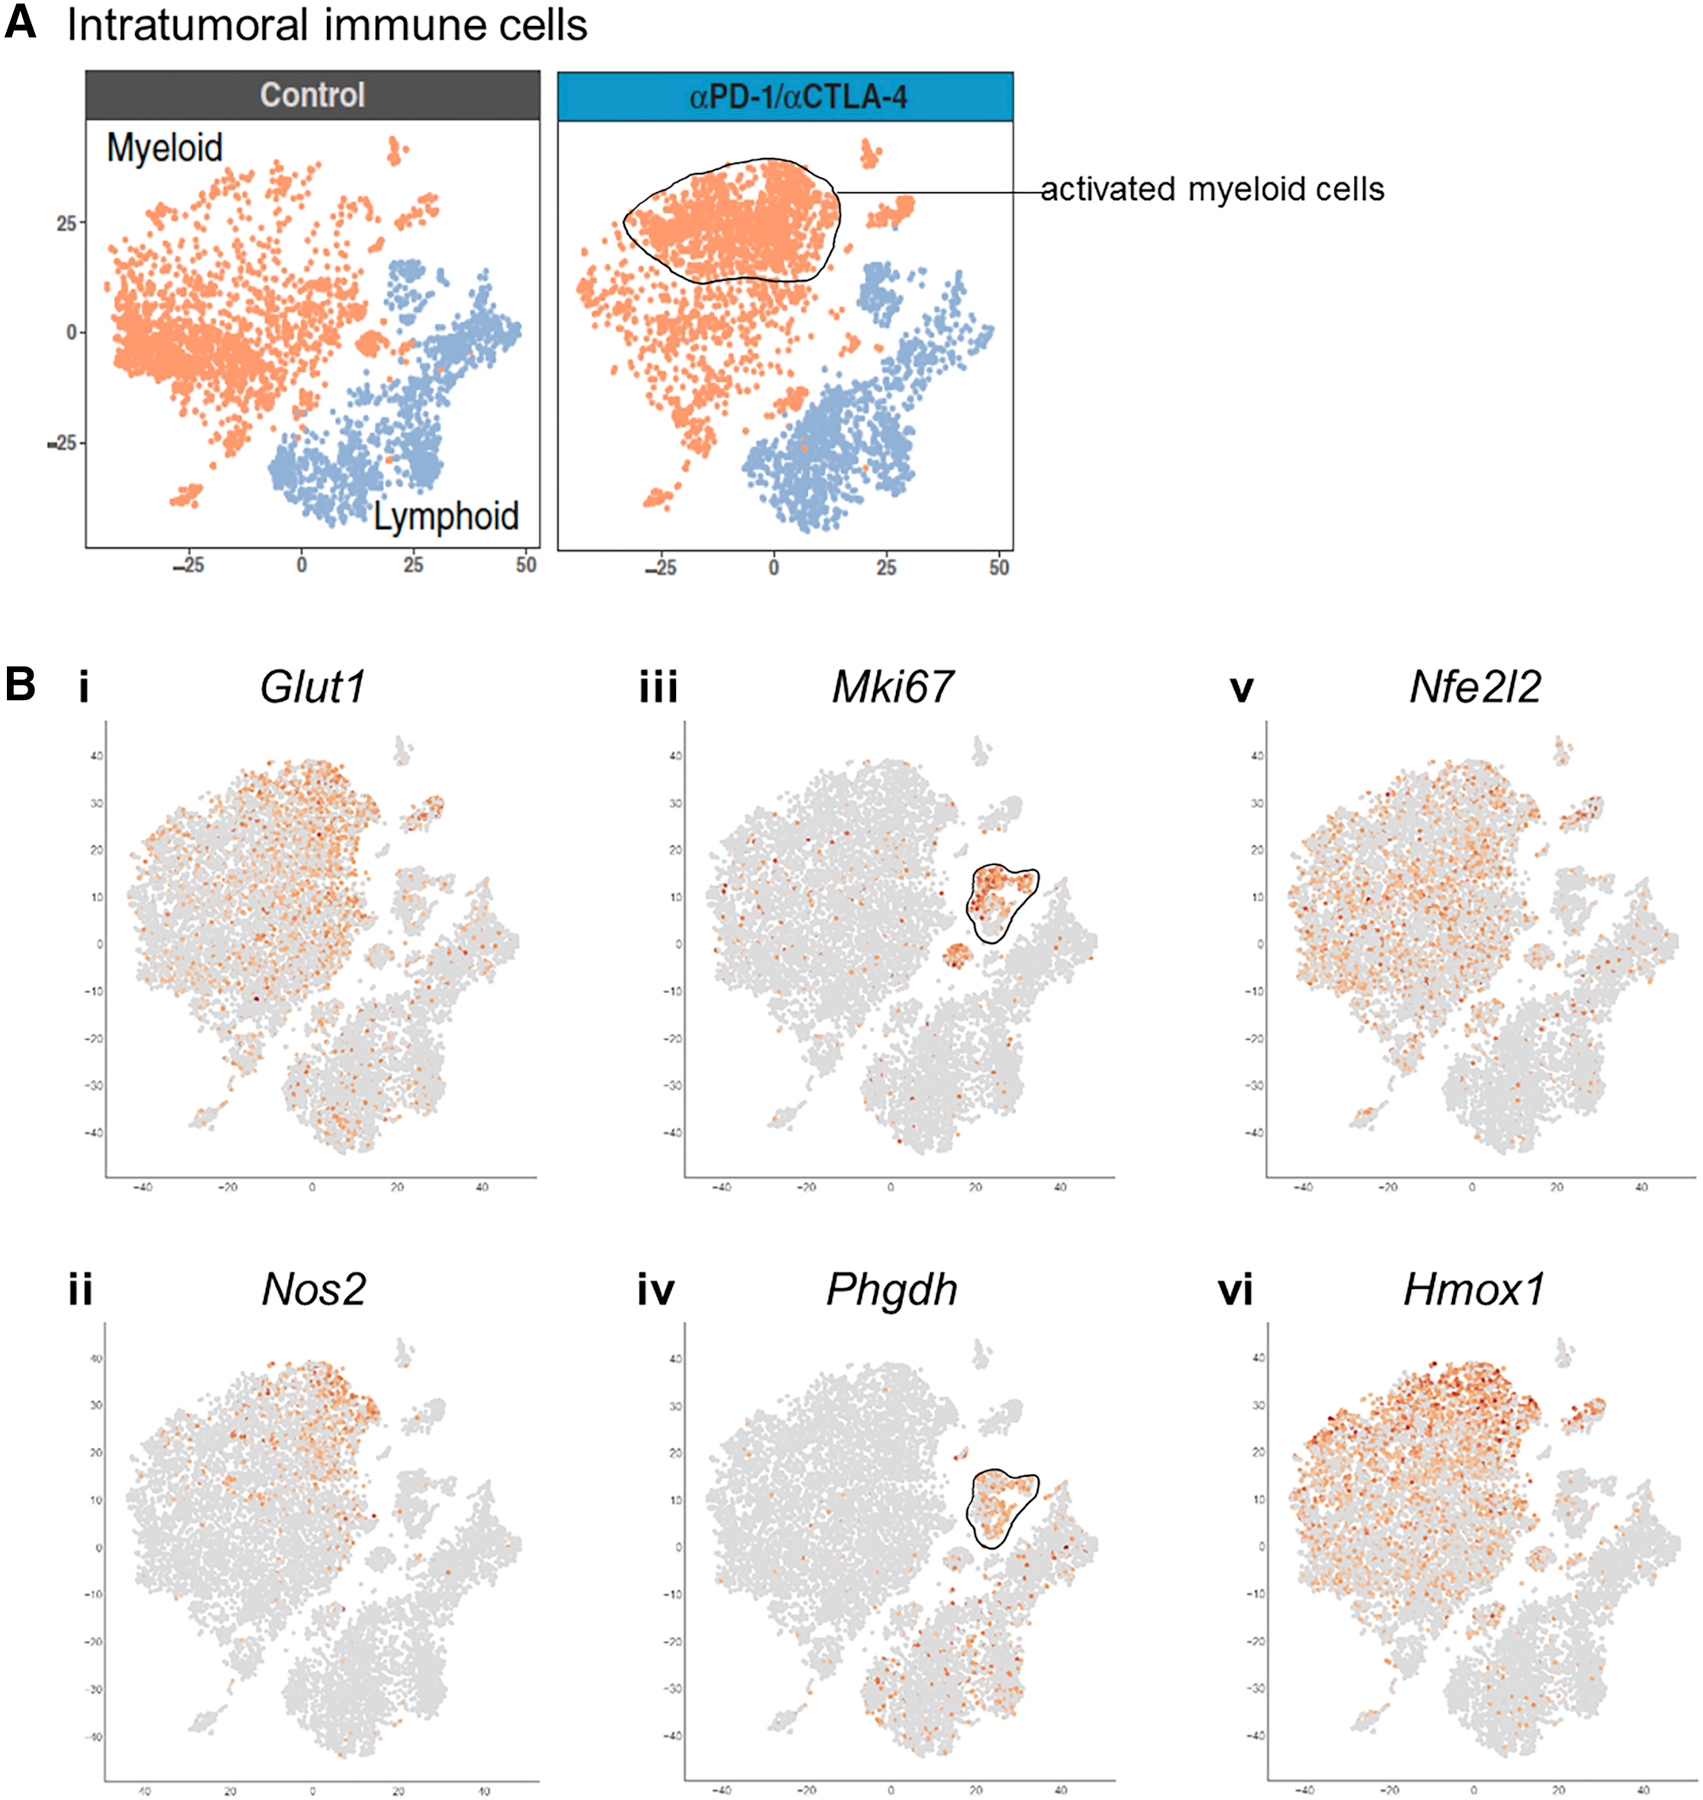
A–B. The behavior of some key metabolic genes is shown in immune cells of mouse sarcomas that were treated with either anti-PD1/anti-CTLA4 immune checkpoint blockade antibodies or with control antibody (Gubin et al., 2018). To do so, we created a direct visualization of the indicated genes from the associated published dataset (GSE119352).
i. Genes associated with increased glycolytic activity like Glut1 are enriched in the activated macrophages that appear after ICB treatment.
ii. Nos2, a metabolic gene characteristic of inflammatory macrophage activation, is enriched in macrophages that are specific to the ICB treatment condition.
iii. & iv. Phgdh expression is associated with Mki67 expressing highly proliferative T cells, which is consistent with bulk ex vivo analyses describing the role of serine metabolism in T cell proliferation (Ma et al., 2017; Ma et al., 2019).
v. & vi. Levels of NRF2 transcript (Nfe2l2), a key factor in oxidative stress responses, are generally enriched in macrophages relative to T cells and do not appear to depend on the treatment condition. However, its direct targets such as Hmox1 do increase in subpopulations of inflammatory macrophages, consistent with potential oxidative/electrophilic stress from NO and itaconate. Together this is in line with the fact that NRF2 is mainly regulated on the protein level (Taguchi et al., 2011) and highlights the need to profile protein rather than gene expression for this key metabolic regulator.
A similar approach of direct examination of specific key metabolic genes in scRNA-seq data proved to be powerful in describing the metabolic aspects of apoptosis during Drosophila eye development (Ariss et al., 2018). Together, these examples illustrate the potential utility of scRNA-seq data for studying metabolism. Yet, methods to comprehensively map the metabolic landscape at single-cell resolution remain relatively scarce and/or are in the early stages of development. Most approaches for metabolic analysis of scRNA-seq data arise from bulk RNA-seq analysis techniques and considerable challenges have to be overcome when making this transition.
Indeed, bulk transcriptional profiling provides an appealing source of data as it yields exhaustive information about transcript levels within the sequenced cells. As such, the absence of a signal typically implies absence of the corresponding transcript. This is in contrast to metabolomics profiling, where coverage is limited and absence of a signal often arises due to technological limitations rather than due to absence of the metabolite itself. Yet, this advantage of transcriptional profiling is not as pronounced in scRNA-seq data. Due to generally lower depth of sequencing and drop-out events, expression levels of individual genes can appear zero in some cells even though these genes are actually expressed. Typical depth of sequencing is in the order of 25,000–50,000 reads per cell, which yields confident detection of 3,000–4,000 genes per cell. Shallow sequencing (i.e., on the order of 1000 genes per cell) might result in detection of mostly common and housekeeping genes and only very few subpopulation specific genes, which would lead to significant difficulties when comparing the data with other published signatures. Still, even the detection of 3000–4000 genes per cell is significantly lower than the estimated 12,000–15,000 genes expressed in purified cell populations based on the bulk RNA-seq data. In these situations, techniques such as data imputations have to be used to post-process the data and to obtain smooth transcriptional profiles. Within the same scRNA-seq dataset different cell clusters can have very different RNA content per cell, which results in uneven coverage between cell types. For example, a smaller number of total transcripts is typically detected in neutrophils as compared to T cells or macrophages. Thus, care is required when comparing pathway enrichments between different cells since lower coverage of some clusters can lead to false negative results.
Most of the approaches for metabolic analysis of scRNA-seq data can be broadly classified into two main categories that are briefly described below: (1) pathway-based analysis and (2) Flux Balance Analysis (FBA) based-methods.
Pathway-based approaches.
Genes composing distinct metabolic pathways are fairly well annotated (Kanehisa and Goto, 2000) and can be directly probed as gene sets using standard bioinformatics pathway enrichment techniques. This simple yet powerful approach can reveal novel biological insights. For example, the role of serine metabolism in T cells has been investigated based on the initial observation of the transcriptional enrichment of this pathway in published bulk RNA-seq data (Ma et al., 2017). As Figure 2 shows, this pathway is enriched in the proliferating T cell cluster within the scRNA-seq data. Recently, Xiao et al. demonstrated how pathway enrichment pipelines can be adjusted for scRNA-seq data analysis and used it to characterize the metabolic diversity within the tumor microenvironment. Using a similar analysis strategy, Miragaia et al. highlighted the metabolic heterogeneity among Tregs across different tissues using pathway enrichments.
Flux Balance Analysis (FBA)-based approaches.
Flux Balance Analysis (FBA) is an elegant way to compute the steady state distribution of metabolic fluxes in the system that would satisfy constraints on input and output fluxes given a specific network architecture (Orth et al., 2010). Simply put, FBA views metabolic wiring in a cell as a system of pipes with a limited number of input and output faucets and requires that there is steady state equilibrium established at every node of a system. In other words, incoming metabolic flow towards each reaction should equal metabolic flow going away from that reaction. As such, specific expression levels of individual enzymes are not directly participating in modeling and the results are mostly dependent on network topology and requirements on input and output reactions of the model. Inputs are typically the most common substrate uptake reactions (e.g. glucose, glutamine) and outputs (usually referred as objective function) are associated with the specific studied cell behavior. For instance, an objective can be to maximize the production of biomass for growing cells or the production of certain metabolites such as NO for activated macrophages (Bordbar et al., 2012).
An important advantage of the FBA-based approaches is that they rely on network analysis that is not associated with predefined pathway knowledge and therefore can reveal novel biological concepts. As such, it provides a powerful tool to understand changes in metabolic flux upon changes in network topologies, e.g. due to gene knock-out or tissue-specific pattern of expression. Indeed, Zhang et al. have demonstrated scRNA-seq-based analysis of NAD+ biosynthesis in different tissues using an FBA-based approach (Zhang et al., 2020). Conceptually, this work follows from the approach of studying tissue-specific metabolism based on bulk RNA-seq data from different tissues (Bordbar et al., 2011). In addition to looking at the dramatically different network topologies, the FBA framework allows investigation of metabolic remodeling within the same network, but upon the change of the required cellular output induced by a stimulation. This is feasible when at least some key metabolic features are known. For instance, using this approach, Bordbar et al. modeled activation of macrophages using increase in NO production as a key objective of inflammatory macrophages (Bordbar et al., 2012). Key objectives can also be defined based on the differential expression between conditions. This approach for bulk data has previously been adopted to reveal itaconate as an SDH inhibitor (Lampropoulou et al., 2016) and has recently been translated to scRNA-seq data to investigate metabolic differences associated with pathogenic/non-pathogenic Th17 cells, as well as their difference with Tregs (Wagner et al., 2020).
One significant caveat of the current approaches is that they typically focus on differences between two distinct cell populations. In these situations, a more straightforward approach would be to simply perform differential expression analysis between the two populations and either perform pathway enrichment analysis or metabolic subnetwork analysis. We argue that it is critical to move past the one-to-one comparison of known cell types and to learn to capture metabolic diversity within the whole dataset. Thus, the next generation metabolic scRNA-seq analysis approaches are expected to reveal major metabolic axes of variation independent of the assignments of the cellular identities. While it is feasible at the moment to perform such clustering simply in the space of all metabolic genes or using annotated metabolic pathways as principal components, the most powerful clustering approaches would incorporate network-based analysis with no a priori knowledge of individual pathways. This would allow for unbiased definition of individual cells as distinct metabolic entities and will provide an unbiased view of the whole cellular ecosystem from a metabolic perspective.
Protein-based single-cell metabolic analysis
Single-cell metabolic profiling (scMEP) by mass cytometry (CyTOF).
While untargeted analysis of proteins within single cells is still in its infancy (Slavov, 2020) and has not been applied in immunometabolism research yet, recent literature showcases the use of mass cytometry (cytometry by time of flight; CyTOF) to estimate the metabolic configurations of enzymes within single cells. This technology allows for simultaneous quantification of ~40 parameters at single-cell resolution (Hartmann and Bendall, 2020). In the context of immunometabolism, one should consider the inclusion of antibodies targeting the main metabolic features described above (Figure 1). Not surprisingly, the metabolic panels that were independently designed by three distinct research groups show considerable overlap (Table 1) (Ahl et al., 2020; Hartmann et al., 2020; Levine et al., 2020).
Table 1.
Metabolic targets used in different single-cell profiling approaches
| Target | Metabolic pathway and function | Inclusion in panels | ||||
|---|---|---|---|---|---|---|
| Glycolysis | Hartmann | Levine | Ahl | Miller | Core* | |
| GLUT1 | Glucose uptake | x | x | x | x | |
| HK | First glycolytic enzyme | x | x | (x) | ||
| PFK2 | Glycolytic enzyme and regulator | x | ||||
| GAPDH | Glycolytic enzyme / immune regulator | x | x | x | x | |
| PKM2 | Glycolysis / transcriptional regulator | x | ||||
| Fermentation | ||||||
| LDH | Pyruvate to lactate conversion | x | x | (x) | ||
| MCT1 | Lactate export | x | (x) | |||
| PPP | ||||||
| G6PD | G6P dehydrogenase, rate-limiting PPP step | x | x | x | x | |
| TCA / ETC | ||||||
| CS | Citrate synthase | x | x | (x) | ||
| IDH | Isocitrate dehydrogenase | x | x | x | x | |
| OGDH | alpha-ketaglutarate dehydrogenase | x | (x) | |||
| SDH | Succinate dehydrogenase / ETC complex II | x | x | |||
| ATP5A | ATP synthase / ETC complex V | x | x | x | x | |
| CytC | Cytochrome C, essential for ETC function | x | x | (x) | ||
| Mitochondrial regulation | ||||||
| PGC1a | Mitochondrial biogenesis | x | ||||
| VDAC1 | Outer mitochondrial membrane porin | x | x | (x) | ||
| OPA1 | Mitochondrial fusion | x | ||||
| Fatty acid metabolism | ||||||
| CD36/FAT | Fatty acid transporter | x | ||||
| CPT1A | Fatty acid shuttling into mitochondria | x | x | x | ||
| HADHA | Long-chain fatty acid oxidation | x | ||||
| ACADM | medium-chain acyl-CoA dehydrogenase | x | x | |||
| ACC / ACAC | Acetyl-CoA carboxylase / Fatty acid synthesis | x | x | x | ||
| Amino acid metabolism | ||||||
| CD98/LAT1 | Essential amino acid transporter | x | x | x | ||
| GLUD | Glutamate dehydrogenase | x | ||||
| ASCT2 | Alanine/Serine/Cysteine-preferring amino acid transporter 2 | x | ||||
| GLS | Glutamine to glutamate conversion | x | ||||
| GOT2 | Glutamic-oxaloacetic transaminase / malate-aspartate shuttle | x | ||||
| ASS1 | Argininosuccinate synthase | x | ||||
| Metabolic regulation / signalling | ||||||
| NRF1 | Anti-oxidant transcription factor | x | x | (x) | ||
| NRF2 | Anti-oxidant transcription factor | x | ||||
| KEAP1 | NRF2 degradation | x | ||||
| PRDX2 | Peroxiredoxin 2 anti-oxidant enzyme | x | ||||
| HIF1A | Hypoxia & inflammation-induced transcription factor | x | x | x | ||
| mTOR | central hub of nutrient signaling / anabolic metabolism | x | ||||
| S6-P | Ribosomal protein controlled by mTOR | x | x | x | ||
| XBP1 | ER stress transcription factor regulating diverse immune cells | x | ||||
| Funtional output | ||||||
| CyclinB1 | Proliferation / clonal expansion | x | ||||
| Ki-67 | Proliferation / clonal expansion | x | x | |||
| BrU | RNA biosynthesis | x | ||||
| IbU | DNA biosynthesis | x | ||||
| puromycin | Protein biosynthesis | x | ||||
A core metabolic cytometry panel of 10 targets is proposed, along with additional targets (x) for further insight.
To design an immunometabolic CyTOF panel, Hartmann et al. first screened over 100 commercial antibodies against a broad range of metabolic factors and came to a selection of 41 metabolic antibodies that passed all biological controls and yielded robust reproducible results in a proof-of-concept study of human white blood cells (Hartmann et al., 2020). After identifying distinct immune cell subsets based on their lineage marker expression pattern, the metabolic states of all immune cell subsets could be estimated and compared without the need for prior sorting. The metabolic state profiles acquired by mass cytometry were in agreement with their described roles in specific immune functions as exemplified by high expression levels of targets associated with glucose and fatty acid metabolism in plasmacytoid DCs, and high levels of the rate-limiting PPP enzyme G6PD in neutrophils (O’Neill et al., 2016). Furthermore, Hartman et al. have demonstrated a high degree of consistency between metabolic changes in T cells measured by Seahorse and the changes observed at a single-cell resolution on the protein level. This highlights that CyTOF-based single-cell metabolic profiling is a powerful tool to gain new insights into the concepts of metabolic remodeling established by bulk measurements.
Application of metabolic CyTOF in the ex vivo clinical context.
Comparing tumor and healthy adjacent tissue from colorectal carcinoma patients, along with healthy donor PBMCs and lymph nodes, Hartmann et al. (2020) revealed specific metabolic phenotypes that were enriched in tumor-associated CD8+ T cells . These cells showed increased expression of the large neutral amino acid transporter 1 (LAT1, CD98) and decreased expression of a broad range of enzymes across distinct metabolic pathways. These so-called metalow cells displayed distinct signs of T cell exhaustion, including increased expression of PD1 and CD39, reduced mitochondrial capacity and low levels of TCF1. Of note, a fraction of the metalow subset did not express PD1 or CD39, indicating that combining metabolic and immune cell markers provides additional dimensions to phenotypically and functionally define tumor-associated immune cells in relation to human disease.
Use of CyTOF-based metabolic profiling in animal model research.
In addition to human samples, metabolic CyTOF panels can be useful to dissect metabolic remodeling in vivo in animal models. Levine et al. used CyTOF-based metabolic profiling of T cell responses during Listeria monocytogenes infection as a well-described model of CD8 T cell differentiation (Levine et al., 2020). The metabolic panel configured here was largely based on earlier bulk metabolic measurements and previous literature, and as such, the obtained mass cytometry data nicely recapitulated established concepts in the field. Indeed, effector T cells showed an expected increase in glycolytic activity (Michalek et al., 2011) as evident by GLUT1 and GAPDH induction in CyTOF analysis and as validated by an increased ECAR by Seahorse analysis. Conversely, memory T cells showed induction of CPT1a, a key player in FAO that was previously associated with CD8 memory T cells (van der Windt et al., 2012). This metabolic rewiring occurred in a stepwise manner that could be followed over time at single-cell resolution. This metabolic change included a uniform glycolytic switch early after activation, followed by heterogeneous GAPDH expression after 2 days of activation. These two GAPDH populations showed functional differences, which would not have been revealed in bulk approaches.
Furthermore, this approach revealed a transitional pool of effector T cells that could not be detected when solely using common antibodies against lineage markers and T cell subsets. This newfound subset appeared 4 days after infection, was highly proliferative, showed strongly induced expression of both glycolysis and mitochondrial oxidation markers, and appeared to be fueled by both fatty acids and amino acids based on the expression of CTP1a and CD98, respectively. Having detected this unknown subset of transitional cells by CyTOF, the authors next sorted these cells as CD62Llo CD44hi CD25hi to confirm their increased glycolytic and oxidative metabolism through extracellular flux analysis. This is an excellent example of how single-cell technologies provide new insights and how established bulk analysis can be used to validate such new discoveries.
Met-Flow; single-cell metabolic profiling by flow cytometry.
By using fluorescently labeled antibodies instead of heavy-metal-conjugated ones, single-cell metabolic profiling can also be performed by ‘regular’ flow cytometry (with some advantages and disadvantages; see later). Ahl et al. configured a flow cytometry-based method called Met-Flow to interrogate the metabolic state of immune cells using 10 fluorochrome-conjugated antibodies targeting rate-limiting enzymes and key proteins in distinct metabolic pathways, combined with phenotypic markers to generate a 27-color flow cytometry panel (Ahl et al., 2020). To acquire this extensive panel, the authors used an X-30 FACSymphony cytometer from BD. Using the expression profiles of 10 metabolic markers allowed Ahl et al. to cluster and separate blood leukocyte subsets into distinct metabolic islands. Akin to the CyTOF analysis by Hartmann et al., CD4+ and CD8+ T cell subsets were not separated on metabolic proteins alone but most other immune cell subsets were quite efficiently defined solely based on their metabolic profiles. This indicates that it is probably more beneficial to extend our conventional cytometry panels with antibodies against key metabolic enzymes that are coupled to specific immune effector functions, instead of staining additional immune cell surface markers for which the actual function is often unknown. Even when using relatively small cytometry panels, including a few metabolic antibodies, will probably be highly informative to further dissect the phenotype, function and metabolism of immune cells using equipment that is present in virtually every institute. This also supports the idea of Poznanski and Ashkar who previously addressed the question “If an NK Cell Cannot be Defined by How It Looks, Could It be Defined by How It Is Fueled?“ in an elegant review on which factors regulate NK cell function (Poznanski and Ashkar, 2019).
Of note, Met-Flow with only 10 metabolic proteins identified blood leukocytes subsets with a resolution comparable to that of +500 genes by scRNA-seq analysis, whereas solely analyzing the expression of the same 10 genes did not resolve the immune populations. Additionally, Met-Flow demonstrated the well-documented upregulation of glycolysis, OXPHOS and fatty acid synthesis upon T cell activation and this metabolic rewiring was confirmed by bulk extracellular flux analysis. Follow-up single-cell Met-Flow analysis indicated that most cells relied on glucose for their metabolic switch, but also revealed a subset of CD4 central memory cells with an alternative metabolic fuel. As such, single-cell, but not bulk, metabolic profiling is able to identify specific metabolic characteristics and requirements of individual T cell subsets.
Pros and cons of distinct single-cell metabolic profiling techniques and developments
Single-cell transcriptomics vs Cytometry.
Single-cell transcriptomics and multicolor cytometry are complementary approaches in terms of information acquired and experimental set-up required for profiling. As such they can be used simultaneously for maximal resolution, but at the same time either approach can be more accessible or informative. Here, we describe some basic considerations for selecting the most optimal approach (Table 2).
Table 2.
Strengths and weaknesses of the techniques
| Strenghts | Weaknesses | |
|---|---|---|
| Extracellular flux analysis | + (Indirect) functional readout | − High cell number & replicates needed |
| + Availability of apparatus respiration | − Limited to glycolysis and mitochondrial | |
| + Affordable & Fast | − Affected by cell isolation and sorting | |
| Bulk metabolomics & fluxomics | + Info on a broad range of pathways | − instability of metabolome |
| + Most direct assessment of metabolism | − High levels of input material needed | |
| + Applicable in vivo / ex vivo (advanced) | − Costly | |
| Single-cell transcriptomics | + unbiased | − limited to ~10,000 cells/sample |
| + combined metabolic and phenotypic info | − Limited sequencing depth / coverage | |
| + generation of new hypotheses | − Costly | |
| Flow cytometry | + Combination with metabolic dyes (Table 2) | − Targets need to be selected carefully (biased) |
| + Machinery available in most institutes | − Fluorescent spill-over and background | |
| + Affordable & Fast | − Indirect metabolic measurements | |
| Mass cytometry (CyTOF) | + Largest antibody panel size | − only available in high-end (core) facilities / costly |
| + Barcoding of multi samples | − lower sensitivity | |
| + Stability of signal | − Indirect metabolic measurements | |
| MIBI-TOF | + (indirect) spatial assessment of metabolism | − Advanced high-end technique (availability/cost/time) |
| + Large antibody panels | − Indirect metabolic measurements | |
| + Can be performed on biobanked material | ||
| In situ activity assays | + Activity measurements in situ | − Limited to dehydrogenases |
| + Measures selected enzymes in key pathways | − Measured at saturated substrate levels | |
| − Specialized technique | ||
| MS Imaging / sc metabolomics | + Direct in situ measurements of metabolism | − Advanced high-end technique (availability) |
| + Broad range of metabolites/lipds measured | − To be combined with phenotypic/metabolic readouts |
Single-cell RNA-sequencing typically yields ~3000–5000 genes detected in each cell. This allows for unbiased clustering of the data and potential identification of novel subpopulations that have not been described before. From the metabolic perspective, it allows simultaneous detection of multiple genes across many pathways and therefore yields a global picture of metabolic changes. On the other side, cytometry approaches are currently limited to the detection of ~40 proteins, including cell lineage markers, as well as selected metabolic enzymes such as the ones in Figure 1A and Table 1. Therefore, utilization of cytometry approaches requires reasonably specific hypotheses to design the antibody panel.
At the same time, the typical number of cells that is profiled by the two approaches is very different, as scRNA-seq is currently limited to about 10,000 cells per sample, while cytometry can routinely process millions of cells and can be readily scaled up if needed. This distinction becomes critical when minor cellular populations like innate lymphoid cells or dendritic cells need to be considered. Furthermore, the cost of single-cell transcriptional profiling is nearly an order of magnitude larger than that of a cytometry run, and therefore it is not feasible to profile either large numbers of replicates or to increase statistical power by profiling many cells from the same samples. Additionally, scRNA-seq is more sensitive to cellular morphology compared to cytometry approaches. A number of cell types, such as myocytes or neurons, cannot be reliably profiled due to incompatibility of cellular shapes and instrumental design. In other cases, such as neutrophils, transcriptional profiling is complicated by fragility of the cells and overall lower RNA content of the cells which introduces significant biases into the data.
On the other side, one significant advantage of transcriptional profiling is rooted in the utilization of single-nucleus RNA-seq. In this approach one can isolate individual nuclei and profile corresponding transcripts (Mereu et al., 2020). This approach has several important advantages, even though the number of detected transcripts is typically much smaller due to the fact that most RNA is localized in the cytosol and not in the nucleus (Ding et al., 2020). Firstly, this approach avoids morphological complications and all cell types within the sample can be profiled on the same footing. But most importantly, this approach allows profiling of frozen samples, including ones that have been biobanked years before. This opens up the ability to study cohorts of tissues from clinical samples that typically have to be collected across extended periods of time.
In spite of these advantages, transcriptional data provide only a “twice-removed” proxy to the metabolic measurements, and in that respect, cytometry is a more direct approach that yields protein level measurements. Antibody-based approaches directly measure levels of enzymes, including their post-translational modifications (and the modification of their key regulators). An additional benefit of using cytometry-based approaches is that it allows inclusion of non-protein-based markers of cellular phenotypes. For instance, by including tagged IdU, BrU and puromycin substrates, metabolic profiles and cellular phenotypes can be functionally linked to anabolic process like DNA, RNA and protein synthesis (Kimmey et al., 2019).
Altogether, in the setting of controlled experimental design we would advocate for a combinatorial approach where scRNA-seq is run on a limited scale to explore the broad landscape of the changes, followed by large-scale cytometry profiling using a hypothesis-driven antibody panel for validation at the protein level.
Mass versus flow cytometry for single-cell immunometabolism research.
Flow cytometry is still the most commonly used approach for immune cell profiling, but the number of parameters that can be simultaneously tested is relatively limited due to fluorescence spillover. This occurs when the fluorescence emission of one fluorochrome is sensed by the detector of another fluorochrome. Therefore, flow cytometry data need to be carefully compensated and this can be particularly challenging for large panels. Nevertheless, the number of colours and antibodies used in flow cytometry is growing fast and panels of 20 and more markers are now common. So far, it does not reach the +40 parameters that can be assessed in CyTOF but at this point flow cytometry is clearly catching up. Opposed to fluorescence detectors, CyTOF uses a mass cytometer to detect the time-of-flight (TOF) of each metal that is set by its mass (Spitzer and Nolan, 2016). As such both the detection overlap and background (autofluorescence in flow cytometry) are very low in CyTOF analyses because heavy metals do not naturally occur in cells. Designing ideal CyTOF panels is still key to minimize “spillover” due to impurities of metal-tags and to take differences in signal-intensity of distinct metals into account. Also, no mass channel in CyTOF is as sensitive as bright fluorochromes such as PE in flow cytometry. While stained cells need to be acquired fast in flow cytometry to prevent photobleaching, metal-tagged samples can be (cryo)preserved for weeks and acquired simultaneously when all samples are collected over time during a clinical trial. Alternatively, cells can be isolated, fixed and stored over time and handled together once the clinical trial or experiment is finalized. Indeed, unique barcoding of up to 20 samples allows one to combine and subsequently stain, process and acquire them as one multiplexed sample. These advantages come with a cost since CyTOF antibodies are more expensive than fluorochrome-coupled ones and also the instrument used to acquire the labelled cells is more costly and advanced in the case of mass cytometry. While multi-colour flow cytometers are the workhorses of virtually every lab, mass cytometers are less common and restricted to high-end core facilities.
Nowadays, spectral analysers are pushing the boundaries of flow cytometry. Employing 5 lasers to detect the full emission spectra over 64 channels, instruments like the Cytek Aurora are now able to detect 30+ colours in a sensitive, fast and accessible manner (Ferrer-Font et al., 2020). This is particularly valuable for (immuno)metabolism research since it can combine fluorochrome-tagged antibodies against metabolic proteins and immune lineage markers with fluorescent metabolic tools to provide an extra layer of metabolic information (Scharping et al., 2016). For example, expression of the glucose transporter GLUT1 can be directly related to the uptake of fluorescently labelled 2NBDG. Similarly, increased expression of proteins that suggest increased mitochondrial oxidation can be directly linked to mitochondrial mass and membrane potential using fluorescent dyes such as MitoTracker and TMRE (or related TMRM), respectively. As such, a clear advantage of fluorescence-based flow cytometry is the applicability of fluorescent metabolic dyes, whereas the largest benefits of mass cytometry are panel size, signal stability and barcoding possibilities that allow in-depth single-cell metabolic profiling of immune cells in patient biopsies obtained during clinical trials.
Spatially-resolved immunometabolism
A major drawback of all approaches listed so far is that they require cells in suspension and as such lack spatial information. The spatial aspect is particularly important since specific microenvironmental factors, including the complex mixture of stimuli, the availability of nutrients and interactions with neighboring cells, are key drivers of cellular metabolic profiles in tissues and critically shape immunity and disease progression. Another drawback of conventional single-cell profiling approaches is that the specific protocols used to digest tissues into single cells induce cell death in some, but not all cells, and might favor the isolation of specific immune cell subsets with associated metabolic profiles. Together, these limitations underscore the need for the validation of key observations of immunometabolic features of cells within their tissue microenvironment, taking into account their spatial organization and avoiding problems associated with cell sorting. New methods that instantaneously capture spatial context and single-cell transcriptome profiles are now being applied, but their use in immunometabolism research has yet to be described. Nevertheless, recent publications highlight how the metabolic configuration of single cells within their microenvironment can be assessed at the protein level in a highly multiplexed manner.
MIBI-TOF as protein-based spatial single-cell immune/metabolic analysis.
Hartmann et al. took an important step towards spatial metabolic profiling by transferring their established metabolic CyTOF panel to the multiplexed ion beam imaging (MIBI-TOF) platform. This recently developed approach couples single-cell metabolic profiles, immune cell phenotypes and functional states to cell-cell interactions and location within tissues (Hartmann and Bendall, 2020; Keren et al., 2019). To do so, tissue sections are stained with heavy-metal-coupled antibodies (that are also used in CyTOF), and then scanned with an ion beam to release the heavy-metals from antibodies recognizing specific metabolic and immune targets. For each acquired pixel, the released ions are quantified by TOF-MS as in CyTOF, with the important advantage that the obtained high-dimensional data obtained by MIBI-TOF also contain spatial information.
Staining colorectal carcinoma and control tissue sections with lineage markers in combination with a broad range of metabolic antibodies, followed by segmentation of individual cells in the acquired images and subsequent clustering of cells into cell lineages, allowed researchers to couple immune cell phenotypes to metabolic characteristics that are driven by their specific tissue microenvironment (Hartmann et al., 2020). Metabolic profiles were spatially organized in environmental niches with similar metabolic characteristics irrespective of cell type. Cells expressing high levels of metabolic factors associated with glycolysis, mitochondrial respiration or amino acid metabolism were often surrounded by neighboring cells expressing the same metabolic target. This microenvironment-driven metabolic polarization was especially apparent when comparing immunometabolic profiles of cells near the tumor border with the ones positioned further away from the boundary. Typically, metabolically suppressed cells were further away from the tumor-border, while metabolically active cells resided at the tumor-immune edge. Since the MIBI-TOF approach can be performed on existing FFPE material obtained from biobanks, it offers the opportunity to link immunometabolic profiles and locations to clinical outcome and therapeutic success. As such, single-cell metabolic profiling is an important next step to translate immunometabolism research towards clinical diagnostics and therapy. Yet, it should be noted that the presence of a particular enzyme does not always correlate with its activity and this aspect should be taken into account when drawing conclusions from these antibody-based approaches.
Mapping metabolism within microenvironments in situ using dehydrogenase activity assays.
Miller et al. previously configured an alternate method to assess the metabolic configuration of cells in their tissue microenvironment (Miller et al., 2017). Their approach relies on enzyme activity measurements at saturating substrate and co-factor availability in combination with staining of multiple immune cell markers on consecutive tissue sections. Dehydrogenase activities are measured for five enzymes catalyzing key steps in major metabolic pathways; G6PD in the PPP, GAPDH in glycolysis, LDH in lactate fermentation, and IDH and SDH in the TCA cycle. When these dehydrogenases are active, nitroblue tetrazolium chloride (NBT) is reduced by NAD(P)H into a strongly colored state that can be quantified and related to the acquired immune cell marker expression on consecutive sections. The authors employed this technique to interrogate the metabolic signatures of macrophage and T cell subsets in human cancerous and control colon. Macrophages producing IL-6 and TNF within the tumor showed increased glycolytic GADPH activity in comparison with non-inflammatory macrophages within the TME but overall tumor-associated macrophages appeared metabolically repressed in comparison to macrophages in healthy tissue. It is therefore tempting to speculate that an impaired metabolic fitness of macrophages in tumors might prevent their antitumor activities. Moreover, Tregs showed cancer-specific metabolic features with suppressed glycolytic GAPDH activity and increased mitochondrial SDH compared to Tregs in healthy tissues. Identifying such tumor-specific metabolic properties of immune cell subsets could aid the development of new therapeutic approaches. Of note, the activities of these distinct dehydrogenases are measured at saturated substrate concentrations and are thus estimates of the optimal in vivo scenario rather than a precise reflection of their activity in a given context such as a hypoxia TME in which cells compete for nutrients.
Conclusions and future directions
It is clear that a technological transition towards understanding immunometabolism at the single-cell level is inevitable, although not yet complete. Technologies developed for transcriptomic and proteomic profiling at single-cell resolution demonstrate a sufficient level of maturity to establish the current frontier in the field of immunometabolism – initial assessment and focused probing of the metabolic landscape within clinical samples and in vivo models of inflammation. As discussed above, specific metabolic features can be informed by scRNA-seq profiling or even bulk observations from mixed cell cultures/ex vivo samples and then dissected through dedicated protein-targeting panels. For instance, based on the overlap between the recently published panels and previous literature, one can compile a core metabolic panel consisting of 10 metabolic antibodies that is also applicable in multicolor flow cytometry and a more extensive set panel including an additional 10 antibodies to gain more detailed and functional insight through CyTOF analysis (Table 1).
While methods such as CyTOF and scRNA-seq can be insightful with respect to metabolic remodeling within the diverse cell subpopulations, the primary data obtained with these methods remain either indirect or limited in scope. Therefore, the technological advances that can address these challenges will build up a foundation for the next generation of immunometabolism research (Figure 3). Two key directions would be (1) improving depth and quality of data for the single-cell level profiling of ex vivo cell suspensions, and (2) improving our ability to resolve the spatial distribution of metabolic features (e.g. within tissue slices).
Figure 3 –
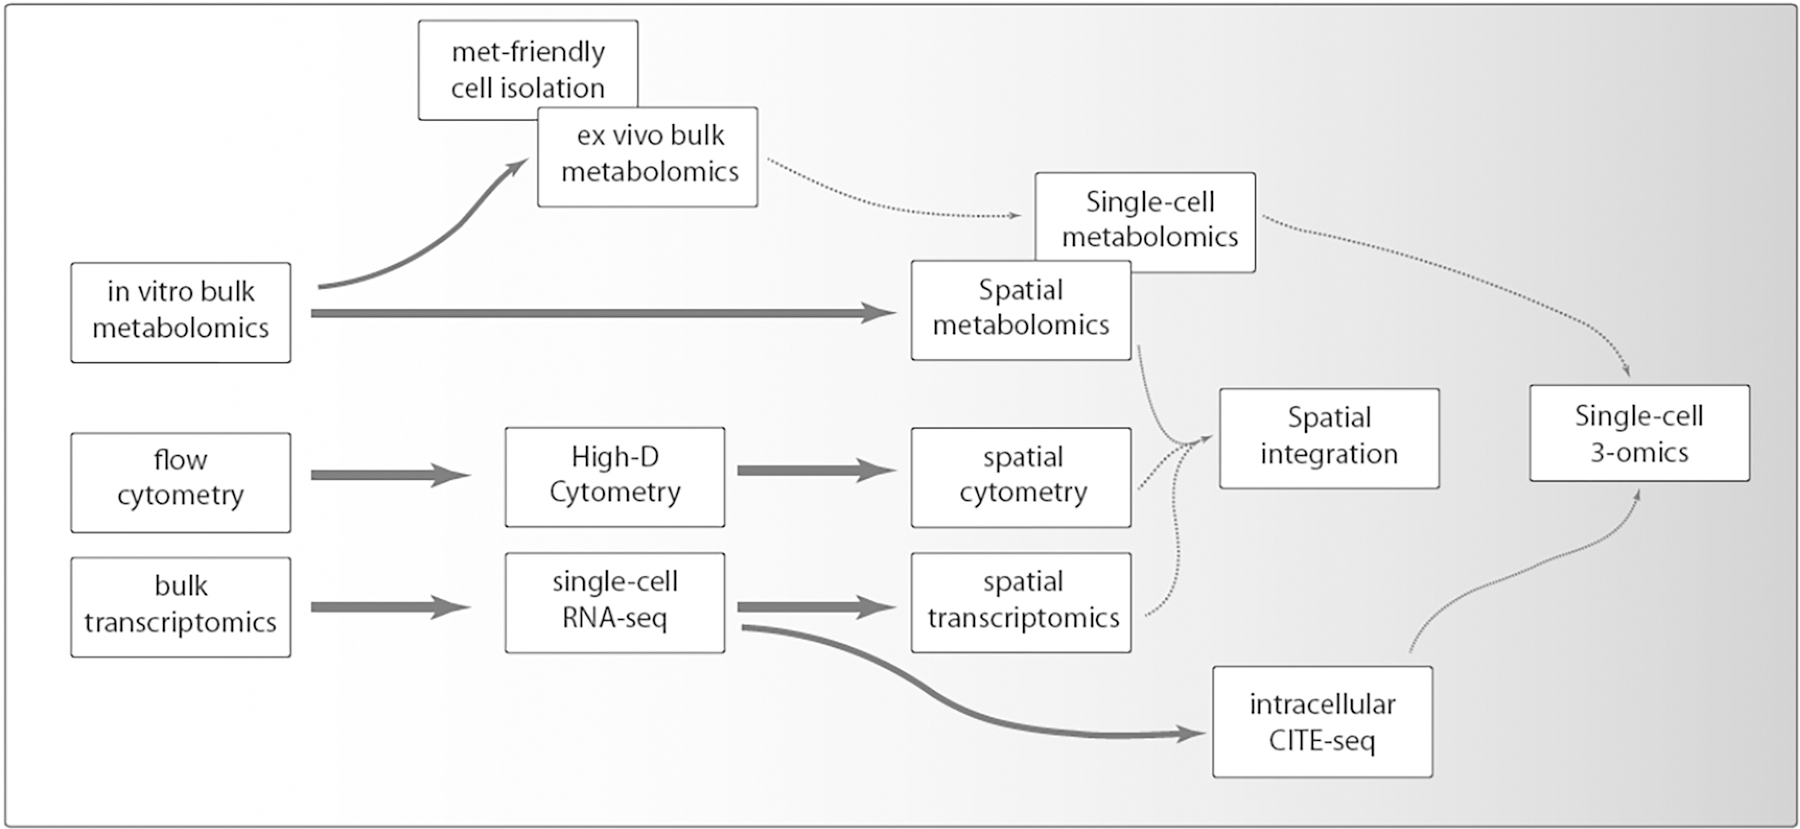
Hypothetical technology development perspective in the context of single-cell immunometabolism applications.
The next generation approaches would include direct single-cell metabolite profiling (Duncan et al., 2019), which should be accompanied by the development of robust methods to isolate individual cells without significant metabolic perturbations (Figures 3). Such an approach would not only allow direct evaluation of metabolite levels, but also provide fluxomics at a single-cell level, when cell mixtures, or even animals/people, are supplemented with labeled substrates. Given the unstable nature of the metabolome and the fact that isolation of cells affects the readout, the future of single-cell metabolomics is probably not in measuring metabolites in isolated cells in suspension, but rather in MS-based imaging (MSI) approaches to spatially resolve the metabolic configuration of single-cells within their tissue microenvironment. For detailed information on emerging techniques such as MALDI-MS for single-cell and even subcellular analysis we refer the reader to excellent recent reviews (Gilmore et al., 2019; Scupakova et al., 2020).
Resolving immunometabolism at single-cell resolution is certainly not the end stage as cells are not homogeneous bags but rather highly compartmentalized structures with a heterogeneous distribution of metabolites with different functions at different subcellular locations. For example, acetyl-CoA feeds the TCA cycle within the mitochondria, whilst fueling fatty acid and cholesterol biosynthesis in the cytosol and histone acetylation within the nucleus. As such, improving the subcellular resolution of metabolic readouts will provide an additional layer of insight into the immunometabolism field and to science in general (Alexandrov, 2020; Pareek et al., 2020).
In the context of complementary ‘omics profiling, fusion of protein and transcriptomic level measurements along the lines implemented in CITE-seq approaches bears significant promise for the immunometabolism field (Stoeckius et al., 2017). Specifically, extension of the CITE-seq-based approach to robust measurement of intracellular proteins would allow for measuring significantly larger numbers of enzyme and their post-translational modifications since antibodies are conjugated to nucleic-acid barcodes and therefore 100–200 proteins can feasibly be measured simultaneously (Hwang et al., 2020; Stoeckius et al., 2017). This will significantly improve the resolution compared to the current ~40 antibodies possible with CyTOF, especially considering the fact that almost half of the panel is typically devoted to cell type-specific markers.
Furthermore, adopting new data generation techniques will demand development of a portfolio of novel computational approaches that could integrate the network-based nature of the data with corresponding technological outputs in terms of spatial location or potential temporal aspects of immune responses. The use of computational algorithms such as SCORPIUS (Cannoodt et al., 2016) are promising to deduce a pseudotime ordering to investigate the presumed temporal sequence of metabolic rewiring. Understanding the kinetics of phenotypic, functional and metabolic changes can reveal which metabolic events are causal and what are mere bystanders of a particular immune state. Understanding the spatiotemporal aspect of immunometabolism can help to rationally design new therapeutic approaches as one would have a better understanding of the drivers of disease versus bystander effects. In particular, targeting the metabolic changes that kinetically precede, and thus likely also regulate, the phenotypic alterations in immune cells could improve immune cell function and disease outcome. Moreover, physiological immune response occurs in multicellular environments that are highly organized spatially. Given that our current understanding of the immunometabolic regulation is obtained using highly controlled in vitro settings (typically with purified cell types), the design of metabolic interventions for in vivo phenotypes relies as much on chance as it does on knowledge-based considerations. We envision that understanding the fundamental principles of multicellular immunometabolic remodeling will pave the way to deductively transition from perturbation of key intracellular pathways towards the successful therapies on the whole-body scale. Yet it is clear that additional analytical tools are required to fully grasp the spatiotemporal aspect of immunometabolism and for tasks such as metabolic clustering on the single-cell level.
Altogether, immunometabolism is quickly becoming a systems level science where multidisciplinary expertise is required for making the fullest use of the novel technologies. Therefore, computational advances would be important not only in terms of data analysis itself but also in terms of their usability and interpretability by experimental immunologists in order to successfully transit to the single-cell era of immunometabolism.
Immunometabolic dysregulation underlies many modern diseases, and thus targeting such dysfunction is considered a potential avenue for therapy. Here, Artyomov and Van den Bossche review how emerging single-cell technologies will aid in the resolution of the details concerning the spatiotemporal regulation of immunometabolism in complex in vivo microenvironments, allowing progression towards clinical applications.
Acknowledgements
We thank Sjoerd Schetters, Menno de Winther and Felix Hartmann for insightful feedback, Sanne Verberk, Kyra de Goede and Luc Magré for proofreading, and Amanda Swain and Karl Harber for edits and comments on the manuscript. M.N.A. is supported by R01-AI125618 from National Institute of Allergy and Infectious Diseases (NIAID). J.V.d.B. received a VENI grant from ZonMW (91615052), a Netherlands Heart Foundation Junior Postdoctoral grant (2013T003), and Senior Fellowship (2017T048), an NWO ENW-KLEIN-1 grant (268) and a CCA PhD grant from Cancer Center Amsterdam.
Footnotes
Publisher's Disclaimer: This is a PDF file of an unedited manuscript that has been accepted for publication. As a service to our customers we are providing this early version of the manuscript. The manuscript will undergo copyediting, typesetting, and review of the resulting proof before it is published in its final form. Please note that during the production process errors may be discovered which could affect the content, and all legal disclaimers that apply to the journal pertain.
Declaration of interests
The authors declare no competing interests.
References
- Ahl PJ, Hopkins RA, Xiang WW, Au B, Kaliaperumal N, Fairhurst AM, and Connolly JE (2020). Met-Flow, a strategy for single-cell metabolic analysis highlights dynamic changes in immune subpopulations. Commun Biol 3, 305. [DOI] [PMC free article] [PubMed] [Google Scholar]
- Alexandrov T (2020). Probing metabolism in time and space. Science 368, 241–242. [DOI] [PubMed] [Google Scholar]
- Alves TC, Pongratz RL, Zhao X, Yarborough O, Sereda S, Shirihai O, Cline GW, Mason G, and Kibbey RG (2015). Integrated, Step-Wise, Mass-Isotopomeric Flux Analysis of the TCA Cycle. Cell Metab 22, 936–947. [DOI] [PMC free article] [PubMed] [Google Scholar]
- Ariss MM, Islam A, Critcher M, Zappia MP, and Frolov MV (2018). Single cell RNA-sequencing identifies a metabolic aspect of apoptosis in Rbf mutant. Nat Commun 9, 5024. [DOI] [PMC free article] [PubMed] [Google Scholar]
- Ayres JS (2020). Immunometabolism of infections. Nat. Rev. Immunol 20, 79–80. [DOI] [PubMed] [Google Scholar]
- Baardman J, Verberk SGS, Prange KHM, van Weeghel M, van der Velden S, Ryan DG, Wust RCI, Neele AE, Speijer D, Denis SW, et al. (2018). A Defective Pentose Phosphate Pathway Reduces Inflammatory Macrophage Responses during Hypercholesterolemia. Cell Rep 25, 2044–2052 e2045. [DOI] [PubMed] [Google Scholar]
- Bordbar A, Feist AM, Usaite-Black R, Woodcock J, Palsson BO, and Famili I (2011). A multi-tissue type genome-scale metabolic network for analysis of whole-body systems physiology. BMC Syst. Biol 5, 180. [DOI] [PMC free article] [PubMed] [Google Scholar]
- Bordbar A, Mo ML, Nakayasu ES, Schrimpe-Rutledge AC, Kim YM, Metz TO, Jones MB, Frank BC, Smith RD, Peterson SN, et al. (2012). Model-driven multi-omic data analysis elucidates metabolic immunomodulators of macrophage activation. Mol. Syst. Biol 8, 558. [DOI] [PMC free article] [PubMed] [Google Scholar]
- Buck MD, Sowell RT, Kaech SM, and Pearce EL (2017). Metabolic Instruction of Immunity. Cell 169, 570–586. [DOI] [PMC free article] [PubMed] [Google Scholar]
- Cannoodt R, Saelens W, Sichien D, Tavernier S, Janssens S, Guilliams M, Lambrecht B, Preter KD, and Saeys Y (2016). SCORPIUS improves trajectory inference and identifies novel modules in dendritic cell development. bioRxiv, 079509.
- Caputa G, Castoldi A, and Pearce EJ (2019). Metabolic adaptations of tissue-resident immune cells. Nat. Immunol 20, 793–801. [DOI] [PubMed] [Google Scholar]
- Caro-Maldonado A, Wang R, Nichols AG, Kuraoka M, Milasta S, Sun LD, Gavin AL, Abel ED, Kelsoe G, Green DR, et al. (2014). Metabolic reprogramming is required for antibody production that is suppressed in anergic but exaggerated in chronically BAFF-exposed B cells. J. Immunol 192, 3626–3636. [DOI] [PMC free article] [PubMed] [Google Scholar]
- Chang CH, Curtis JD, Maggi LB Jr., Faubert B, Villarino AV, O’Sullivan D, Huang SC, van der Windt GJ, Blagih J, Qiu J, et al. (2013). Posttranscriptional control of T cell effector function by aerobic glycolysis. Cell 153, 1239–1251. [DOI] [PMC free article] [PubMed] [Google Scholar]
- De Rosa V, Galgani M, Porcellini A, Colamatteo A, Santopaolo M, Zuchegna C, Romano A, De Simone S, Procaccini C, La Rocca C, et al. (2015). Glycolysis controls the induction of human regulatory T cells by modulating the expression of FOXP3 exon 2 splicing variants. Nat. Immunol 16, 1174–1184. [DOI] [PMC free article] [PubMed] [Google Scholar]
- Dennis EA, Deems RA, Harkewicz R, Quehenberger O, Brown HA, Milne SB, Myers DS, Glass CK, Hardiman G, Reichart D, et al. (2010). A mouse macrophage lipidome. J. Biol. Chem 285, 39976–39985. [DOI] [PMC free article] [PubMed] [Google Scholar]
- Ding J, Adiconis X, Simmons SK, Kowalczyk MS, Hession CC, Marjanovic ND, Hughes TK, Wadsworth MH, Burks T, Nguyen LT, et al. (2020). Systematic comparison of single-cell and single-nucleus RNA-sequencing methods. Nat. Biotechnol 38, 737–746. [DOI] [PMC free article] [PubMed] [Google Scholar]
- Divakaruni AS, Hsieh WY, Minarrieta L, Duong TN, Kim KKO, Desousa BR, Andreyev AY, Bowman CE, Caradonna K, Dranka BP, et al. (2018). Etomoxir Inhibits Macrophage Polarization by Disrupting CoA Homeostasis. Cell Metab [DOI] [PMC free article] [PubMed]
- Duncan KD, Fyrestam J, and Lanekoff I (2019). Advances in mass spectrometry based single-cell metabolomics. Analyst 144, 782–793. [DOI] [PubMed] [Google Scholar]
- Everts B, Amiel E, Huang SC, Smith AM, Chang CH, Lam WY, Redmann V, Freitas TC, Blagih J, van der Windt GJ, et al. (2014). TLR-driven early glycolytic reprogramming via the kinases TBK1-IKKvarepsilon supports the anabolic demands of dendritic cell activation. Nat. Immunol 15, 323–332. [DOI] [PMC free article] [PubMed] [Google Scholar]
- Ferrer-Font L, Pellefigues C, Mayer JU, Small SJ, Jaimes MC, and Price KM (2020). Panel Design and Optimization for High-Dimensional Immunophenotyping Assays Using Spectral Flow Cytometry. Curr Protoc Cytom 92, e70. [DOI] [PubMed] [Google Scholar]
- Galvan-Pena S, Carroll RG, Newman C, Hinchy EC, Palsson-McDermott E, Robinson EK, Covarrubias S, Nadin A, James AM, Haneklaus M, et al. (2019). Malonylation of GAPDH is an inflammatory signal in macrophages. Nat Commun 10, 338. [DOI] [PMC free article] [PubMed] [Google Scholar]
- Geiger R, Rieckmann JC, Wolf T, Basso C, Feng Y, Fuhrer T, Kogadeeva M, Picotti P, Meissner F, Mann M, et al. (2016). L-Arginine Modulates T Cell Metabolism and Enhances Survival and Anti-tumor Activity. Cell 167, 829–842 e813. [DOI] [PMC free article] [PubMed] [Google Scholar]
- Gilmore IS, Heiles S, and Pieterse CL (2019). Metabolic Imaging at the Single-Cell Scale: Recent Advances in Mass Spectrometry Imaging. Annu. Rev. Anal. Chem. (Palo Alto Calif.) 12, 201–224. [DOI] [PubMed] [Google Scholar]
- Gubin MM, Esaulova E, Ward JP, Malkova ON, Runci D, Wong P, Noguchi T, Arthur CD, Meng W, Alspach E, et al. (2018). High-Dimensional Analysis Delineates Myeloid and Lymphoid Compartment Remodeling during Successful Immune-Checkpoint Cancer Therapy. Cell 175, 1014–1030 e1019. [DOI] [PMC free article] [PubMed] [Google Scholar]
- Hartmann FJ, and Bendall SC (2020). Immune monitoring using mass cytometry and related high-dimensional imaging approaches. Nat. Rev. Rheumatol 16, 87–99. [DOI] [PMC free article] [PubMed] [Google Scholar]
- Hartmann FJ, Mrdjen D, McCaffrey E, Glass DR, Greenwald NF, Bharadwaj A, Khair Z, Verberk SGS, Baranski A, Baskar R, et al. (2020). Single-cell metabolic profiling of human cytotoxic T cells. Nat. Biotechnol [DOI] [PMC free article] [PubMed]
- Haschemi A, Kosma P, Gille L, Evans CR, Burant CF, Starkl P, Knapp B, Haas R, Schmid JA, Jandl C, et al. (2012). The sedoheptulose kinase CARKL directs macrophage polarization through control of glucose metabolism. Cell Metab 15, 813–826. [DOI] [PMC free article] [PubMed] [Google Scholar]
- Hayashi K, Jutabha P, Endou H, Sagara H, and Anzai N (2013). LAT1 is a critical transporter of essential amino acids for immune reactions in activated human T cells. J. Immunol 191, 4080–4085. [DOI] [PubMed] [Google Scholar]
- Hsieh WY, Zhou QD, York AG, Williams KJ, Scumpia PO, Kronenberger EB, Hoi XP, Su B, Chi X, Bui VL, et al. (2020). Toll-Like Receptors Induce Signal-Specific Reprogramming of the Macrophage Lipidome. Cell Metab 32, 128–143 e125. [DOI] [PMC free article] [PubMed] [Google Scholar]
- Huang SC, Everts B, Ivanova Y, O’Sullivan D, Nascimento M, Smith AM, Beatty W, Love-Gregory L, Lam WY, O’Neill CM, et al. (2014). Cell-intrinsic lysosomal lipolysis is essential for alternative activation of macrophages. Nat. Immunol 15, 846–855. [DOI] [PMC free article] [PubMed] [Google Scholar]
- Huang SC, Smith AM, Everts B, Colonna M, Pearce EL, Schilling JD, and Pearce EJ (2016). Metabolic Reprogramming Mediated by the mTORC2-IRF4 Signaling Axis Is Essential for Macrophage Alternative Activation. Immunity 45, 817–830. [DOI] [PMC free article] [PubMed] [Google Scholar]
- Hwang B, Lee DS, Tamaki W, Sun Y, Ogorodnikov A, Hartoularos G, Winters A, Song YS, Chow ED, Spitzer MH, et al. (2020). SCITO-seq: single-cell combinatorial indexed cytometry sequencing. bioRxiv, 2020.2003.2027.012633. [DOI] [PMC free article] [PubMed]
- Jha AK, Huang SC, Sergushichev A, Lampropoulou V, Ivanova Y, Loginicheva E, Chmielewski K, Stewart KM, Ashall J, Everts B, et al. (2015). Network integration of parallel metabolic and transcriptional data reveals metabolic modules that regulate macrophage polarization. Immunity 42, 419–430. [DOI] [PubMed] [Google Scholar]
- Johnson MO, Wolf MM, Madden MZ, Andrejeva G, Sugiura A, Contreras DC, Maseda D, Liberti MV, Paz K, Kishton RJ, et al. (2018). Distinct Regulation of Th17 and Th1 Cell Differentiation by Glutaminase-Dependent Metabolism. Cell 175, 1780–1795 e1719. [DOI] [PMC free article] [PubMed] [Google Scholar]
- Kanehisa M, and Goto S (2000). KEGG: kyoto encyclopedia of genes and genomes. Nucleic Acids Res 28, 27–30. [DOI] [PMC free article] [PubMed] [Google Scholar]
- Kelly B, and Pearce EL (2020). Amino Assets: How Amino Acids Support Immunity. Cell Metab 32, 154–175. [DOI] [PubMed] [Google Scholar]
- Keren L, Bosse M, Thompson S, Risom T, Vijayaragavan K, McCaffrey E, Marquez D, Angoshtari R, Greenwald NF, Fienberg H, et al. (2019). MIBI-TOF: A multiplexed imaging platform relates cellular phenotypes and tissue structure. Sci Adv 5, eaax5851. [DOI] [PMC free article] [PubMed] [Google Scholar]
- Ketelhuth DFJ, Lutgens E, Back M, Binder CJ, Van den Bossche J, Daniel C, Dumitriu IE, Hoefer I, Libby P, O’Neill L, et al. (2019). Immunometabolism and atherosclerosis: perspectives and clinical significance: a position paper from the Working Group on Atherosclerosis and Vascular Biology of the European Society of Cardiology. Cardiovasc. Res 115, 1385–1392. [DOI] [PMC free article] [PubMed] [Google Scholar]
- Kimmey SC, Borges L, Baskar R, and Bendall SC (2019). Parallel analysis of tri-molecular biosynthesis with cell identity and function in single cells. Nat Commun 10, 1185. [DOI] [PMC free article] [PubMed] [Google Scholar]
- Koelwyn GJ, Corr EM, Erbay E, and Moore KJ (2018). Regulation of macrophage immunometabolism in atherosclerosis. Nat. Immunol 19, 526–537. [DOI] [PMC free article] [PubMed] [Google Scholar]
- Krawczyk CM, Holowka T, Sun J, Blagih J, Amiel E, DeBerardinis RJ, Cross JR, Jung E, Thompson CB, Jones RG, et al. (2010). Toll-like receptor-induced changes in glycolytic metabolism regulate dendritic cell activation. Blood 115, 4742–4749. [DOI] [PMC free article] [PubMed] [Google Scholar]
- Lam WY, Becker AM, Kennerly KM, Wong R, Curtis JD, Llufrio EM, McCommis KS, Fahrmann J, Pizzato HA, Nunley RM, et al. (2016). Mitochondrial Pyruvate Import Promotes Long-Term Survival of Antibody-Secreting Plasma Cells. Immunity 45, 60–73. [DOI] [PMC free article] [PubMed] [Google Scholar]
- Lampropoulou V, Sergushichev A, Bambouskova M, Nair S, Vincent EE, Loginicheva E, Cervantes-Barragan L, Ma X, Huang SC, Griss T, et al. (2016). Itaconate Links Inhibition of Succinate Dehydrogenase with Macrophage Metabolic Remodeling and Regulation of Inflammation. Cell Metab 24, 158–166. [DOI] [PMC free article] [PubMed] [Google Scholar]
- Levine LS, Hiam KJ, Marquez DM, Tenvooren I, Contreras DC, Rathmell JC, and Spitzer MH (2020). Single-cell metabolic analysis by mass cytometry reveals distinct transitional states of CD8 T cell differentiation. bioRxiv, 2020.2001.2021.911545.
- Lim AR, Rathmell WK, and Rathmell JC (2020). The tumor microenvironment as a metabolic barrier to effector T cells and immunotherapy. Elife 9. [DOI] [PMC free article] [PubMed] [Google Scholar]
- Llufrio EM, Wang L, Naser FJ, and Patti GJ (2018). Sorting cells alters their redox state and cellular metabolome. Redox Biol 16, 381–387. [DOI] [PMC free article] [PubMed] [Google Scholar]
- Ma EH, Bantug G, Griss T, Condotta S, Johnson RM, Samborska B, Mainolfi N, Suri V, Guak H, Balmer ML, et al. (2017). Serine Is an Essential Metabolite for Effector T Cell Expansion. Cell Metab 25, 345–357. [DOI] [PubMed] [Google Scholar]
- Ma EH, Verway MJ, Johnson RM, Roy DG, Steadman M, Hayes S, Williams KS, Sheldon RD, Samborska B, Kosinski PA, et al. (2019). Metabolic Profiling Using Stable Isotope Tracing Reveals Distinct Patterns of Glucose Utilization by Physiologically Activated CD8(+) T Cells. Immunity 51, 856–870 e855. [DOI] [PubMed] [Google Scholar]
- Makowski L, Chaib M, and Rathmell JC (2020). Immunometabolism: From basic mechanisms to translation. Immunol. Rev 295, 5–14. [DOI] [PMC free article] [PubMed] [Google Scholar]
- Mazumdar C, Driggers EM, and Turka LA (2020). The Untapped Opportunity and Challenge of Immunometabolism: A New Paradigm for Drug Discovery. Cell Metab 31, 26–34. [DOI] [PubMed] [Google Scholar]
- Mereu E, Lafzi A, Moutinho C, Ziegenhain C, McCarthy DJ, Álvarez-Varela A, Batlle E, Sagar, Grün D, Lau JK, et al. (2020). Benchmarking single-cell RNA-sequencing protocols for cell atlas projects. Nat. Biotechnol 38, 747–755. [DOI] [PubMed] [Google Scholar]
- Michalek RD, Gerriets VA, Jacobs SR, Macintyre AN, MacIver NJ, Mason EF, Sullivan SA, Nichols AG, and Rathmell JC (2011). Cutting edge: distinct glycolytic and lipid oxidative metabolic programs are essential for effector and regulatory CD4+ T cell subsets. J. Immunol 186, 3299–3303. [DOI] [PMC free article] [PubMed] [Google Scholar]
- Miller A, Nagy C, Knapp B, Laengle J, Ponweiser E, Groeger M, Starkl P, Bergmann M, Wagner O, and Haschemi A (2017). Exploring Metabolic Configurations of Single Cells within Complex Tissue Microenvironments. Cell Metab [DOI] [PubMed]
- Miragaia RJ, Gomes T, Chomka A, Jardine L, Riedel A, Hegazy AN, Whibley N, Tucci A, Chen X, Lindeman I, et al. (2019). Single-Cell Transcriptomics of Regulatory T Cells Reveals Trajectories of Tissue Adaptation. Immunity 50, 493–504 e497. [DOI] [PMC free article] [PubMed] [Google Scholar]
- Moon JS, Hisata S, Park MA, DeNicola GM, Ryter SW, Nakahira K, and Choi AM (2015). mTORC1-Induced HK1-Dependent Glycolysis Regulates NLRP3 Inflammasome Activation. Cell Rep 12, 102–115. [DOI] [PMC free article] [PubMed] [Google Scholar] [Retracted]
- Munder M, Eichmann K, and Modolell M (1998). Alternative metabolic states in murine macrophages reflected by the nitric oxide synthase/arginase balance: competitive regulation by CD4+ T cells correlates with Th1/Th2 phenotype. J. Immunol 160, 5347–5354. [PubMed] [Google Scholar]
- Nakaya M, Xiao Y, Zhou X, Chang JH, Chang M, Cheng X, Blonska M, Lin X, and Sun SC (2014). Inflammatory T cell responses rely on amino acid transporter ASCT2 facilitation of glutamine uptake and mTORC1 kinase activation. Immunity 40, 692–705. [DOI] [PMC free article] [PubMed] [Google Scholar]
- Nomura M, Liu J, Rovira II, Gonzalez-Hurtado E, Lee J, Wolfgang MJ, and Finkel T (2016). Fatty acid oxidation in macrophage polarization. Nat. Immunol 17, 216–217. [DOI] [PMC free article] [PubMed] [Google Scholar]
- O’Neill LA, Kishton RJ, and Rathmell J (2016). A guide to immunometabolism for immunologists. Nat. Rev. Immunol 16, 553–565. [DOI] [PMC free article] [PubMed] [Google Scholar]
- O’Neill LAJ, and Artyomov MN (2019). Itaconate: the poster child of metabolic reprogramming in macrophage function. Nat. Rev. Immunol [DOI] [PubMed]
- Orth JD, Thiele I, and Palsson BO (2010). What is flux balance analysis? Nat. Biotechnol 28, 245–248. [DOI] [PMC free article] [PubMed] [Google Scholar]
- Palsson-McDermott EM, Curtis AM, Goel G, Lauterbach MA, Sheedy FJ, Gleeson LE, van den Bosch MW, Quinn SR, Domingo-Fernandez R, Johnston DG, et al. (2015). Pyruvate kinase M2 regulates Hif-1alpha activity and IL-1beta induction and is a critical determinant of the warburg effect in LPS-activated macrophages. Cell Metab 21, 65–80. [DOI] [PMC free article] [PubMed] [Google Scholar]
- Pareek V, Tian H, Winograd N, and Benkovic SJ (2020). Metabolomics and mass spectrometry imaging reveal channeled de novo purine synthesis in cells. Science 368, 283–290. [DOI] [PMC free article] [PubMed] [Google Scholar]
- Pelgrom LR, van der Ham AJ, and Everts B (2016). Analysis of TLR-Induced Metabolic Changes in Dendritic Cells Using the Seahorse XF(e)96 Extracellular Flux Analyzer. Methods Mol. Biol 1390, 273–285. [DOI] [PubMed] [Google Scholar]
- Poznanski SM, and Ashkar AA (2019). What Defines NK Cell Functional Fate: Phenotype or Metabolism? Front. Immunol 10, 1414. [DOI] [PMC free article] [PubMed] [Google Scholar]
- Raud B, Roy DG, Divakaruni AS, Tarasenko TN, Franke R, Ma EH, Samborska B, Hsieh WY, Wong AH, Stuve P, et al. (2018). Etomoxir Actions on Regulatory and Memory T Cells Are Independent of Cpt1a-Mediated Fatty Acid Oxidation. Cell Metab [DOI] [PMC free article] [PubMed]
- Rodriguez AE, Ducker GS, Billingham LK, Martinez CA, Mainolfi N, Suri V, Friedman A, Manfredi MG, Weinberg SE, Rabinowitz JD, et al. (2019). Serine Metabolism Supports Macrophage IL-1beta Production. Cell Metab 29, 1003–1011 e1004. [DOI] [PMC free article] [PubMed] [Google Scholar]
- Scharping NE, Menk AV, Moreci RS, Whetstone RD, Dadey RE, Watkins SC, Ferris RL, and Delgoffe GM (2016). The Tumor Microenvironment Represses T Cell Mitochondrial Biogenesis to Drive Intratumoral T Cell Metabolic Insufficiency and Dysfunction. Immunity 45, 374–388. [DOI] [PMC free article] [PubMed] [Google Scholar]
- Scupakova K, Balluff B, Tressler C, Adelaja T, Heeren RMA, Glunde K, and Ertaylan G (2020). Cellular resolution in clinical MALDI mass spectrometry imaging: the latest advancements and current challenges. Clin. Chem. Lab. Med 58, 914–929. [DOI] [PMC free article] [PubMed] [Google Scholar]
- Slavov N (2020). Unpicking the proteome in single cells. Science 367, 512–513. [DOI] [PMC free article] [PubMed] [Google Scholar]
- Spitzer Matthew H., and Nolan Garry P. (2016). Mass Cytometry: Single Cells, Many Features. Cell 165, 780–791. [DOI] [PMC free article] [PubMed] [Google Scholar]
- Stoeckius M, Hafemeister C, Stephenson W, Houck-Loomis B, Chattopadhyay PK, Swerdlow H, Satija R, and Smibert P (2017). Simultaneous epitope and transcriptome measurement in single cells. Nat Methods 14, 865–868. [DOI] [PMC free article] [PubMed] [Google Scholar]
- Swain A, Bambouskova M, Kim H, Andhey PS, Duncan D, Auclair K, Chubukov V, Simons DM, Roddy TP, Stewart KM, et al. (2020). Comparative evaluation of itaconate and its derivatives reveals divergent inflammasome and type I interferon regulation in macrophages. Nature Metabolism [DOI] [PMC free article] [PubMed]
- Tabas I, and Bornfeldt KE (2020). Intracellular and Intercellular Aspects of Macrophage Immunometabolism in Atherosclerosis. Circ. Res 126, 1209–1227. [DOI] [PMC free article] [PubMed] [Google Scholar]
- Taguchi K, Motohashi H, and Yamamoto M (2011). Molecular mechanisms of the Keap1-Nrf2 pathway in stress response and cancer evolution. Genes Cells 16, 123–140. [DOI] [PubMed] [Google Scholar]
- Turbitt WJ, Buchta Rosean C, Weber KS, and Norian LA (2020). Obesity and CD8 T cell metabolism: Implications for anti-tumor immunity and cancer immunotherapy outcomes. Immunol. Rev 295, 203–219. [DOI] [PMC free article] [PubMed] [Google Scholar]
- Van den Bossche J, Baardman J, and de Winther MP (2015). Metabolic Characterization of Polarized M1 and M2 Bone Marrow-derived Macrophages Using Real-time Extracellular Flux Analysis. J Vis Exp 105. [DOI] [PMC free article] [PubMed] [Google Scholar]
- Van den Bossche J, Baardman J, Otto NA, van der Velden S, Neele AE, van den Berg SM, Luque-Martin R, Chen HJ, Boshuizen MC, Ahmed M, et al. (2016). Mitochondrial Dysfunction Prevents Repolarization of Inflammatory Macrophages. Cell Rep 17, 684–696. [DOI] [PubMed] [Google Scholar]
- Van den Bossche J, Lamers WH, Koehler ES, Geuns JM, Alhonen L, Uimari A, Pirnes-Karhu S, Van Overmeire E, Morias Y, Brys L, et al. (2012). Pivotal Advance: Arginase-1-independent polyamine production stimulates the expression of IL-4-induced alternatively activated macrophage markers while inhibiting LPS-induced expression of inflammatory genes. J. Leukoc. Biol 91, 685–699. [DOI] [PubMed] [Google Scholar]
- Van den Bossche J, O’Neill LA, and Menon D (2017). Macrophage Immunometabolism: Where Are We (Going)? Trends Immunol [DOI] [PubMed]
- Van den Bossche J, and Saraber DL (2018). Metabolic regulation of macrophages in tissues. Cell. Immunol 330, 54–59. [DOI] [PubMed] [Google Scholar]
- Van den Bossche J, and van der Windt GJW (2018). Fatty Acid Oxidation in Macrophages and T Cells: Time for Reassessment? Cell Metab 28, 538–540. [DOI] [PubMed] [Google Scholar]
- van der Windt GJ, Everts B, Chang CH, Curtis JD, Freitas TC, Amiel E, Pearce EJ, and Pearce EL (2012). Mitochondrial respiratory capacity is a critical regulator of CD8+ T cell memory development. Immunity 36, 68–78. [DOI] [PMC free article] [PubMed] [Google Scholar]
- van der Windt GJ, O’Sullivan D, Everts B, Huang SC, Buck MD, Curtis JD, Chang CH, Smith AM, Ai T, Faubert B, et al. (2013). CD8 memory T cells have a bioenergetic advantage that underlies their rapid recall ability. Proc. Natl. Acad. Sci. U. S. A 110, 14336–14341. [DOI] [PMC free article] [PubMed] [Google Scholar]
- van der Windt GJW, Chang CH, and Pearce EL (2016). Measuring Bioenergetics in T Cells Using a Seahorse Extracellular Flux Analyzer. Curr. Protoc. Immunol 113, 3 16B 11–13 16B 14. [DOI] [PMC free article] [PubMed] [Google Scholar]
- Vats D, Mukundan L, Odegaard JI, Zhang L, Smith KL, Morel CR, Wagner RA, Greaves DR, Murray PJ, and Chawla A (2006). Oxidative metabolism and PGC-1beta attenuate macrophage-mediated inflammation. Cell Metab 4, 13–24. [DOI] [PMC free article] [PubMed] [Google Scholar]
- Wagner A, Wang C, DeTomaso D, Avila-Pacheco J, Zaghouani S, Fessler J, Akama-Garren E, Pierce K, Ron-Harel N, Douglas VP, et al. (2020). In Silico Modeling of Metabolic State in Single Th17 Cells Reveals Novel Regulators of Inflammation and Autoimmunity. bioRxiv, 2020.2001.2023.912717.
- Wang R, Dillon CP, Shi LZ, Milasta S, Carter R, Finkelstein D, McCormick LL, Fitzgerald P, Chi H, Munger J, et al. (2011). The transcription factor Myc controls metabolic reprogramming upon T lymphocyte activation. Immunity 35, 871–882. [DOI] [PMC free article] [PubMed] [Google Scholar]
- Xiao Z, Dai Z, and Locasale JW (2019). Metabolic landscape of the tumor microenvironment at single cell resolution. Nat Commun 10, 3763. [DOI] [PMC free article] [PubMed] [Google Scholar]
- Zhang Y, Kim MS, Nguyen E, and Taylor DM (2020). Modeling metabolic variation with single-cell expression data. bioRxiv, 2020.2001.2028.923680.