Abstract
Introduction
Many types of research are being carried out in the fields of understanding of the pathogenesis, early recognition, and improving the outcomes after spinal cord injury (SCI). Diffusion tensor imaging (DTI) is one of the modalities used in vivo microstructural assessment of SCI. The aim of the present study is to evaluate the role of DTI imaging and fiber tractography in acute spinal injury with clinical profile and neurological outcome.
Methods
The study was carried out on twenty-five patients of acute spinal cord injury who presented within 48 hours of injury and completed minimum of six months follow-up.
Results
The mean age of patients was 37.32±13.31 years and male & female ratio of 18:7. Total MIS score was 91.64±6.0 initially which improved to 96.92±3.68 after 3 months and 99.4±1.35 after 6 months. Total SIS score was similar at all the time intervals i.e. 224±0. Maximum subjects 14(56%) were classified into AIS C and 5(20%) into AIS D whereas only 6(24%) subjects were having no deficit (AIS E). At the end of 6 months, 13(52%) subjects had no deficit (AIS E). Mean fractional anisotropy (FA) initially was 0.451 (± 0.120) but after 6 months, it increased to 0.482 (± 0.097) (p<0.001). The mean apparent diffusion coefficient (ADC) initially was 3.13 (± 2.68) but after 6 months, it decreased to 3.06 (± 2.68) and this change was found to be statistically highly significant (p<0.001). Mean anisotropy index (AI) initially was 0.420 (± 0.245) but after 6 months, it increased to 0.430 (± 3.41) and this change was found to be statistically significant (p<0.01).
Conclusions
DTI is a sensitive tool to detect neurological damage in SCI and subsequent neurological recovery. FA correlated with ASIA impairment scale. It can be useful as an adjunct to conventional MRI for better evaluation and predicting prognosis in SCI patients.
Keywords: Acute spinal cord injury, Magnetic Resonance Imaging, Diffusion Tensor Imaging, Fiber Tractography
Introduction
Magnetic resonance imaging (MRI) is an essential tool for detecting pathological changes, for predicting prognosis and for planning the treatment of patients with SCI1). However, the information typically provided by conventional T1- and T2-weighted MRI of the spinal cord is limited to the differentiation of white matter from gray matter and macroscopic structural changes within the cord in a diseased or injured state.
Diffusion tensor imaging (DTI) and Diffusion tensor tractography are advanced MRI techniques that enables the measurement of anisotropic restricted diffusion of water in tissue in order to produce neural tract images. It enables the quantification of diffusion anisotropy and detection of subtle changes in the white matter which is normally not observed on conventional MRI images2).
Spinal cord injury results in damage to myelinated fibres of the spinal cord and or nerve roots. Magnetic resonance imaging can detect these changes as increased signal density on T2W and STIR Images3).
Currently, DTI is being used routinely in the clinical assessment of ischemic and hypoxic injuries in the CNS. The earliest DTI-sensitive morphological changes after spinal insult occur as hemorrhages in the central gray matter adjacent to the central canal. These hemorrhages spread radially from the central canal, primarily affecting the anterior horns and neighboring white matter regions around the injury epicentre and then extend in the rostral and caudal directions4-7). In addition to an increase in transverse diffusion, DTI in acute spinal trauma often exhibits a decrease in apparent diffusion coefficient (ADC), resulting in an overall decrease in diffusion anisotropy in the lesion sites during the period of severe edema and hemorrhage. This decrease in the ADC has been largely attributed to metabolic dysfunction as opposed to specific changes in axon morphology8,9).
Diffusion tensor imaging may be beneficial in quantification of spinal injury prior to surgical treatment and help in prognostic postsurgical outcome. It can also determine the extent of injury particular below the level of diagnosed injury. Studies have shown that injured segments show evidence of reduced fractional anisotropy (FA) and increased ADC values as compared to normal areas with depiction of disruption on tractography images10).
As the number of patients with SCI is increasing day by day, the information on outcome helps in counseling the anxious relatives, forecasting length of stay and expenditure in the hospital. We conducted a study in acute SCI patients to analyze findings on diffusion tensor magnetic resonance imaging and fiber tractography and correlate with clinical profile and neurological outcome.
Material and Methods
Forty-six patients were enrolled for the present prospective study initially who presented within 48 hours of injury to the Orthopaedics Department of a tertiary care center during a period of 2 years from May 2017 to April 2019. Four patients with severe SCI expired, and seven patients (3 with complete and 4 with incomplete SCI) were lost to follow up. Ten patients (including complete and incomplete SCI) with unstable thoracolumbar fractures were stabilized with short segment pedicle screw fixation. Presence of implant created artifacts at injury site on diffusion images in the subsequent DTI; these were excluded from the study. Data analysis of remaining twenty-five patients treated conservatively and who completed minimum six month of follow up with all relevant investigations as per study protocol was carried out. Prior written informed consent was taken from each patient after explaining the procedure, risks and benefits. Patients with non-traumatic cause for SCI, patients with head injury/medically unstable condition, patients with previous implanted metallic devices, patients with claustrophobia, pacemakers and cochlear implants, patients presented with previous neurological deficits, gunshot wounds were excluded from the study.
Detailed informative history of the patient was taken in a chronological order. Thorough general physical examination and neurological examination of the patient was performed. Clinical assessment (sensory score, motor score and zone of partial preservation) was done at the time of admission, 3rd day, 7th day, 3 months and 6 months as per international guidelines11).
Plain roentgenogram examination (lateral, antero-posterior film) was taken. CT and MRI were done in all cases within 48 hours of injury. Our protocol of conservative treatment included initial bed rest and postural reduction; and followed by gradual mobilization with braces.
Follow-up was done at one month, 3 months and 6 months. Clinical evaluation and plain radiography was done at each follow-up. Diffusion tensor imaging and fiber tractography and conventional MRI was also done at 3 months and 6 months. Following outcome were measured and assessed:
1. DTI and DTT
Tractography is a 3D modeling technique used to visually represent neural tracts using data collected by diffusion-weighted images (DWI). The results were assessed in two and three-dimensional images. Fractional anisotropy, apparent diffusion coefficient, and anisotropy index (AI) were calculated.
2. Neurologic outcome
Neurological examination was done on each follow up to assess neurological outcome. Any increased in motor power; regain of bladder sensation, bladder and bowel recovery was noticed and the patient graded as per AIS (ASIA impairment scale)11).
Statistical analysis
The statistical analysis on the results was performed by using Student t-test (paired), Analysis of Variance, Cochran Q-test and Chi-square test. A p value of <0.05 was considered as significant.
Results
The mean age of patients was 37.32 ± 13.31 years with a range of 20 to 75 years. Out of the total subjects, eighteen (72%) were males and seven (28%) were females. Most of the subjects were farmer (24%), followed by housewife and student (20%) each and laborers (16%). Thoracolumbar vertebral junctional region (D11-L1) was the most common site of injury 20 patients (80%) and it was followed by thoracic spine in 3 patients (12%). Cervical spine was involved in 2 patients (8%). The most common cause of SCI was fall from height 23 patients (92%). The mean duration of time elapsed between injury and imaging was 7.36 (±3.02) hours ranging from 3 to 15 hours. Maximum number of patients were imaged within 12 hours (88%).
Severe pain, swelling and deformity preceded by trauma were the universal presenting symptoms followed by weakness in lower limbs 17 patients (68%) and retention of urine 20 patients (80%). All symptoms subsequently decreased significantly. At the end of 6 months, pain, weakness of lower limb, and urinary retention persisted in 68%, 6%, and 8% subjects respectively.
1. Neurological assessment
Table 1 shows detailed neurological assessment at different point of time in subsequent follow ups. There was significant recovery in majority of parameters assessed. Significant improvement in neurological deficit was observed in patients with AIS C and D.
Table 1.
Distribution of Subjects According to Their Neurological Assessment (n=25).
| Neurological assessment | Initial | 3 months | 6 months | Significance |
|---|---|---|---|---|
| Decreased Muscle Tone | 20 (80%) | 11 (44%) | 6 (24%) | <0.001* |
| Total Motor Index Score (MIS) | 91.64±6.0 | 96.92±3.68 | 99.4±1.35 | <0.001# |
| Total Sensory Index Score (SIS) | 224±0 | 224±0 | 224±0 | - |
| Voluntary anal contraction | 14 (56%) | 9 (36%) | 3 (12%) | <0.001* |
| Temperature | 8 (32%) | 3 (12%) | 0 | <0.001* |
| Deep anal pressure | 11 (44%) | 7 (28%) | 2 (8%) | <0.01* |
| Reflexes: | ||||
| Abdominal reflex | 10 (40%) | 2 (8.0%) | 2 (8.0%) | <0.001* |
| Babinski reflex | 25 (100.0%) | 25 (100.0%) | 25 (100.0%) | - |
| Patellar | 10 (40.0%) | 4 (16.0%) | 3 (12.0%) | <0.05* |
| Ankle | 10 (40.0%) | 4 (16.0%) | 2 (8.0%) | <0.01* |
| Clonus | 25 (100.0%) | 25 (100.0%) | 25 (100.0%) | - |
| ASIA Score | ||||
| A | 0 | 0 | 0 | - |
| B | 0 | 0 | 0 | - |
| C | 14 (56%) | 0 | 0 | <0.001** |
| D | 5 (20%) | 15 (60%) | 12 (48%) | <0.01** |
| E | 6 (24%) | 10 (40%) | 13 (52%) | 0.124** |
| Median | C | D | E |
*Cochran’s Q test #Repeated Measures ANOVA **Chi-square test
2. DTI and DTT
i. Quantitative findings of DTI and fiber tractography in the cohort
Table 2 shows quantitative findings of DTI and fiber tractography. Average FA was initially 0.451 (±0.120) which improved to 0.464 (±0.111) in 3 months. It further improved to 0.482 (±0.097) in next 3 months. Average ADC was high 3.13(±2.68) initially and decreased to 3.09 (±2.68) in 3 months. It further decreased to 3.06 (±2.68) in next 3 months (p<0.001). AI was initially 0.420 (±0.245) which improved to 0.424 (±0.245) in 3 months. It further improved to 0.430 (±0.243) in next 3 months. All the values showed significant (p<0.001) changes in the subsequent follow ups.
Table 2.
Quantitative Findings on DTI and Fiber Tractography as Observed Initially and Their Subsequent Follow-ups (n=25).
| DTI and fiber tractography findings | Initial | 3 months | 6 months | Significance* (Initial vs. 6 months) |
|---|---|---|---|---|
| FA | 0.451±0.120 | 0.464±0.111 | 0.482±0.097 | <0.001 |
| Apparent diffusion coefficient | 3.13±2.68 | 3.09±2.68 | 3.06±2.68 | <0.001 |
| Anisotropy index | 0.420±0.245 | 0.424±0.245 | 0.430±0.243 | <0.001 |
*Student t-test (Paired)
ii. Correlation of FA, ADC and AI with AIS (ASIA impairment scale)
Table 3 and Graph 1-3 show correlation of FA, ADC and AI with AIS. Correlation of FA was found to be significant with AIS C, D and E at Initial, 3 months and 6 months. Correlation of ADC and AI at all three intervals was non-significant (p>0.05).
Table 3.
Correlation of FA, ADC, AI as Observed According to AIS (ASIA Impairment Scale) (n=25).
| AIS (ASIA impairment scale) |
FA | ADC | AI | ||||||
|---|---|---|---|---|---|---|---|---|---|
| Initial | 3m | 6m | Initial | 3m | 6m | Initial | 3m | 6m | |
| C (n=14) | 0.802* | 0.994** | 0.996** | 0.133 | 0.095 | 0.124 | 0.113 | 0.112 | 0.170 |
| D (n=5) | 0.812* | 0.800* | 0.800* | 0.400 | 0.359 | 0.300 | 0.800 | 0.872 | 0.800 |
| E (n=6) | 0.876* | 0.829* | 0.812* | 0.429 | 0.429 | 0.429 | -0.543 | -0.543 | -0.543 |
Pearson’s Correlation of Coefficient, **<0.01 Significant, *<0.05 Significant
Graph 1.
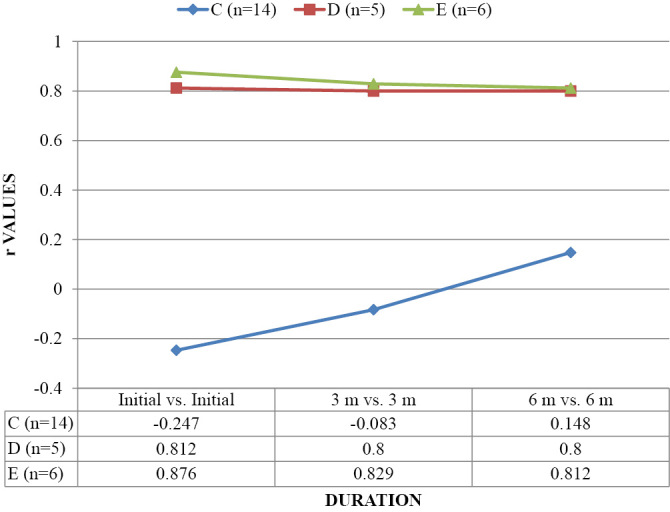
CORRELATION OF FA AS OBSERVED ACCORDING TO AIS (ASIA IMPAIRMENT SCALE) (n=25).
Graph 2.
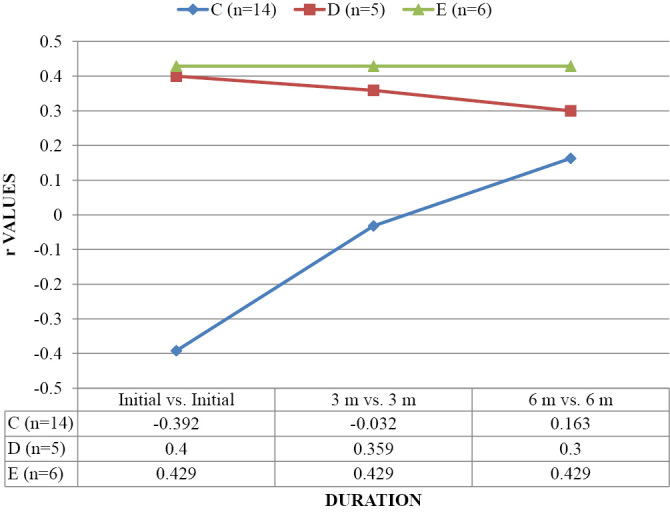
CORRELATION OF ADC AS OBSERVED ACCORDING TO AIS (ASIA IMPAIRMENT SCALE) (n=25).
Graph 3.
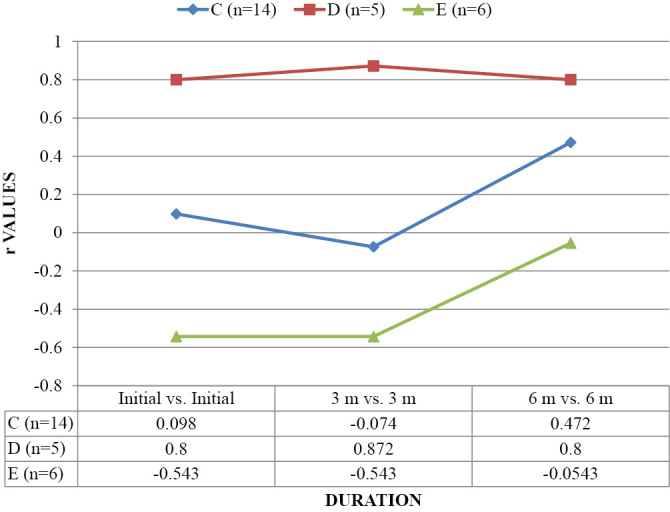
CORRELATION OF AI AS OBSERVED ACCORDING TO AIS (ASIA IMPAIRMENT SCALE) (n=25).
iii. Quantitative findings and inter AIS score comparison of FA, ADC, and AI according to AIS (ASIA impairment scale)
Table 4 shows quantitative findings of FA, ADC, and AI according to AIS. There was improvement in quantitative values; but this improvement was found statistically non-significant (p>0.05). Inter AIS score comparison showed significant difference in values at initial (p<0.001), 3 months (p<0.01) and 6 months (p=0.07) respectively for AIS C vs. D. For AIS C vs. E, values have been found to be significant in initial (p<0.001), 3 months (p<0.001), and 6 months (p=0.02). For AIS D vs. E, values have been found to be non-significant at all points of time.
Table 4.
Quantitative Findings and Inter AIS Score Comparison of FA, ADC, and AI as Observed According to AIS (ASIA Impairment Scale) Initially and Their Subsequent Follow-ups (n=25).
| AIS (ASIA impairment scale) |
Initial | 3 months | 6 months | Significance* (Initial vs. 6 months) |
|---|---|---|---|---|
| Fractional anisotropy (FA) | ||||
| C (n=14) | 0.323±0.056 | 0.354±0.065 | 0.397±0.083 | 0.272 |
| D (n=5) | 0.469±0.106 | 0.475±0.104 | 0.488±0.087 | 0.875 |
| E (n=6) | 0.516±0.123 | 0.530±0.099 | 0.541±0.092 | 0.927 |
| C vs. D** | <0.001 | <0.01 | 0.07 | - |
| D vs. E** | 0.442 | 0.291 | 0.261 | - |
| C vs. E** | <0.001 | <0.001 | 0.02 | |
| Apparent diffusion coefficient (ADC) | ||||
| C (n=14) | 1.91±0.49 | 1.96±0.50 | 2.0±0.50 | 0.998 |
| D (n=5) | 3.29±2.85 | 3.22±2.85 | 3.26±2.85 | 0.980 |
| E (n=6) | 3.71±3.36 | 3.74±3.36 | 3.77±3.36 | p=1 |
| C vs. D** | 0.251 | 0.254 | 0.255 | - |
| D vs. E** | 0.127 | 0.133 | 0.132 | - |
| C vs. E** | 0.751 | 0.750 | 0.753 | - |
| Anisotropy index (AI) | ||||
| C (n=14) | 0.323±0.226 | 0.327±0.226 | 0.335±0.225 | 0.990 |
| D (n=5) | 0.524±0.289 | 0.527±0.288 | 0.531±0.288 | 0.993 |
| E (n=6) | 0.566±0.119 | 0.571±0.119 | 0.575±0.120 | 0.999 |
| C vs. D** | <0.001 | <0.001 | 0.01 | - |
| D vs. E** | 0.759 | 0.747 | 0.748 | - |
| C vs. E** | <0.001 | <0.001 | 0.01 | - |
*Repeated measures ANOVA **Independent t-test
C vs. D: AIS C versus D; D vs. E: AIS D versus E; C vs. E: AIS C versus E
iv. Correlation of motor index score (MIS) with FA, ADC and AI
Graph 4 shows correlation of total MIS with FA, ADC, and AI. Correlation was found to be statistically non-significant (p>0.05) at all points of time of observations.
Graph 4.
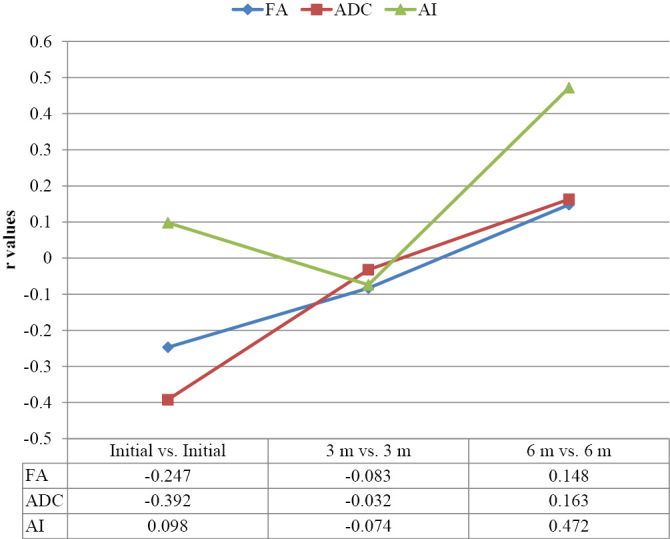
CORRELATION OF MIS WITH FA, ADC AND AI.
Fig. 1-3 show the conventional MRI pictures and DTI of a 42 year old female with fracture of lumbar first vertebra with AIS C neurological deficit.
Figure 1.
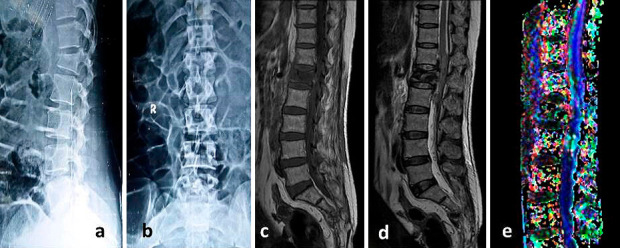
Initial plain radiographs anteroposterior (a) & lateral (b) showing fracture of lumbar first vertebra in a 42 year old female with AIS (ASIA impairment scale) C neurological deficit. Conventional MRI T1-weighted (c) and T2-Weighted (d) sagittal sections shows fracture of vertebral body with spinal cord edema & hemorrhage. Fiber tractography (e) shows disruption of fibers. Values of FA, ADC and AI were 0.456, 1.42, and 0.316 respectively.
Figure 2.
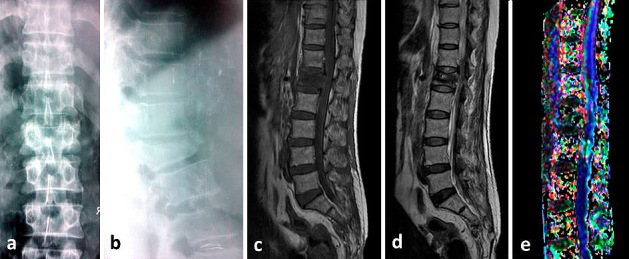
Plain radiographs anteroposterior (a) & lateral (b) at 3 months follow-up. The patient improved neurologically to AIS (ASIA impairment scale) D. Conventional MRI T1-weighted (c) and T2-Weighted (d) sagittal sections shows improvement in spinal cord edema & hemorrhage. Fiber tractography (e) shows disruption of the fibers. Values of FA, ADC and AI were 0.458, 1.40, and 0.318 respectively.
Figure 3.
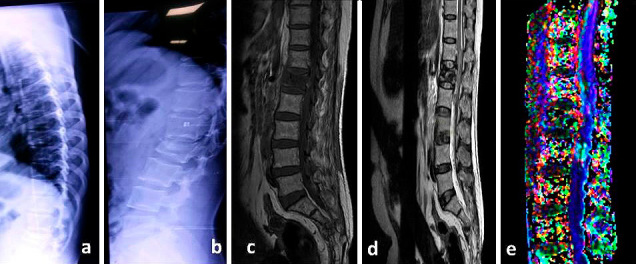
Plain radiographs anteroposterior (a) & lateral (b) at 6 months follow-up. The patient improved neurologically to AIS (ASIA impairment scale) E. Conventional MRI T1-weighted (c) and T2-Weighted (d) sagittal sections shows almost complete resolution of spinal cord edema & hemorrhage. Fiber tractography (e) shows disruption of the fibers. Values of FA, ADC and AI were 0.463, 1.37, and 0.322 respectively.
Discussion
Several studies in the past have shown the utility of DTI indices to quantify the damage of neural tissue post SCI4-10,11-33,36-39). The present study builds upon these studies that show the evidence in support DTI indices as a potential neuroimaging biomarker of the spinal cord and is the first to examine the clinical relevance of these over several point of times post SCI.
DTI and fiber tractography
In the present study, decrease in FA was seen initially and it increased statistically significantly (p<0.001) subsequently with the improvement in neurological deficit. The FA values were significantly lower in patients with more deficit; as shown by the comparison of FA values between AIS C and D, C and E initially and subsequent follow ups. Mulcahey et al.12) reported decreased FA at lesion (<0.003) in 10 SCI patients when compared with 15 controls. Rao et al.13) reported statistically significant differences in FA values between residual and remote normal fibers in 4 patients with SCI (P = 0.000) and between their residual and healthy control fibers (three healthy volunteers) (P = 0.000). No significant difference was reported between remote normal and healthy cords (P = 0.312). This may be the explanation why we did not have statically significant difference; while comparing AIS D vs. E. D'souza et al.14) reported that mean FA value at the level of injury (0.43±0.08) in traumatic cervical SCI patients was less than in controls (0.62±0.06), which was statistically significant (p value <0.001). Similarly, Alizadeh et al.15) in a study found FA values were significantly decreased in patients with SCI (P = 0.0238) when compared with controls. However, it was not a statistically significant difference. Similar to the present study, other studies in the past have shown a correlation between FA value reduction and severity of SCI16,17).
According to Mukherjee18) reduced FA is indicative of nerve degeneration and axonal loss. Degree of neurological deficit after SCI affects reduction of FA, which suggests a potential role for DTI in detecting objective morphological changes during the progression between acute and chronic stages of SCI19,20), as well as throughout the recovery process17,21).
Correlation of mean FA values of initial, 3 months and 6 months were done according to AIS. There was significant correlation at all point of time in all AIS scores. AIS is now internationally accepted method to predict outcome in acute SCI. Czyz et al.22) in their study showed an inverse relation between FA and ASIA score and ASIA grade endorsing the prognostic role of FA. A negative correlation of FA around the injury site with ASIA motor scores was for patients with non-hemorrhagic contusions after acute cervical traumatic SCI by Cheran et al.23). Similar to the present study, Koskinen et al.24) reported decreased FA (<0.001), and FA correlated with ASIA score (<0.001). Statistically significant positive correlation was found between clinical grading (Frankel grade) and FA values at the level of injury (r value = 0.86) by D'souza et al.14). Vedantam et al.21) reported that FA correlated with upper limb motor score (whole cord: r = 0.59, P = .04; lateral corticospinal tracts (CSTs): 0.67, P =.01) and the ASIA grade (whole cord: r = 0.61, P =.03; CST: r = 0.71, P =.009). Cohen-Adad et al.25) reported FA correlated with AIS (<0.01). In the present study we could find significant correlation only between different AIS grades and not with MIS.
In the cohort, ADC was high initially and it decreased significantly in next 3 months (p<0.001). Similar to the findings of the present study, D'souza et al.14) reported that the mean diffusivity (MD) value at the level of injury (1.30+/−0.24) in cases was higher than in controls (1.07+/−0.12, p value <0.001). Negative correlation was found between clinical grade and Mean MD at the level of injury (r value = −0.38) which was however statistically not significant. There are mixed reports of the ADC in SCI; few of the studies showed decrease at levels above, below, and at the site of injury, others show increase, while few have shown no change20,26-28).
We could not find any significant change in mean ADC values of initial, 3 months and 6 months according to AIS. Li et al.20) also reported that ADC did not show any significant changes with time in both the mild and moderate injury groups, suggesting that ADC was not effective in assessing the injuries. Correlation of total MIS score of initial, 3 months and 6 months with ADC values of initial, 3 months and 6 months respectively; also showed no significant correlation. Few studies in the literature have reported findings which are contrary to the findings of the present study. These findings are ADC positively correlated with ASIA motor score for upper limbs during the 3-month follow-up (Czyz et al.22)); decreased AD (<0.05), and RD (<0.05) at lesion; and RD correlated with AIS (<0.01) (Cohen-Adad et al.)25); and ADC correlated with postoperative recovery (=0.02) (Endo et al.)29).
In the cohort, AI was initially decreased and improved significantly in next six months (p<0.001). Although comparison of mean AI values of initial, 3 months and 6 months according to AIS showed improvement; but this was not statistically significant. Inter AIS grade comparison showed significant difference between AIS C and D, AIS C and E; thereby indicating lower values in patients with more neurological deficit. We could not find any significant correlation of total MIS score of initial, 3 months and 6 months with AI values of initial, 3 months and 6 months, respectively. Similarly, Nevo et al.30) (2001) in an animal study, reported that the mean-AI and sum anisotropy ratio (SAI) values increased gradually with the distance from the site of the lesion. At the site itself, the mean- AI and SAI values were significantly higher in the spinal cords of the treated animals than in the controls. The SAI values, AI histograms, and AI maps proved to be useful parameters for quantifying injury and recovery in an injured spinal cord in their study.
Studies conducted on use of DTI in SCI showed that FA values decrease and ACD values increase at lesion sites after SCI14,15,27,30-33). DTI metrics correlate with histological axonal injury as well as functional recovery34,35). Review of other studies done in human SCI in context with findings of the present study shows decrease in FA at lesion (<0.001), MD throughout cord (<0.05), and FA correlated with completeness of injury (Ellingson et al.)36); decreased FA at lesion (<0.001), FA and FT correlated with ISCSCI functional scores (Chang et al.)37); and decreased FA at (<0.001) and caudal to lesion (<0.05), decreased MD and increased AD throughout cord (<0.001) (Cheran et al.)23). Findings of the present study are also in concurrent with these studies; and at the same time also highlights that the FA and AI increase and ADC decrease during different point of time post SCI is associated with clinical improvement in neurological status in majority of the cases.
Martin et al. in 201538), while reviewing the English literature on diffusion tensor imaging (DTI), magnetization transfer (MT), myelin water fraction (MWF), MR spectroscopy (MRS), and functional MRI (fMRI) reported that the majority of DTI studies reporting biomarker utility results focused on the metric FA. We also endorse their observations and findings of Li et al.20) and Facon et al.39) that FA value is a sensitive marker of SCI and FA is more strongly related to the severity of injury; and can be used as a biomarker of SCI.
In the literature various possible causes have been proposed leading to the decreased FA value after SCI. These are axonal degeneration, demyelination, liquefaction of axoplasm, hemorrhage, edema, infarction, and cystic formation following the primary injury40). We speculate that improvement in DTI parameters observed in the present study may be multifactorial: spontaneous self-repair of myelin sheath, sprouting axons, and spared spinal cord tissue form a neural circuit41-43). This needs to be verified by robust longitudinal studies with more number of patients in human model of SCI.
Conclusion
We conclude that DTI is a sensitive tool to detect neurological damage in SCI and subsequent neurological recovery. DTI parameters FA, ADC, and AI are useful guide to predict severity of neurological injury and recovery. FA correlated with ASIA impairment scale. It can be useful as an adjunct to conventional MRI for better evaluation and predicting prognosis in SCI patients.
Conflicts of Interest: The authors declare that there are no relevant conflicts of interest.
Ethical Approval: Study was approved by the Institutional Review Board.
Author Contributions: All the authors participated in the study design, writing, and preparing the manuscript. All authors have read, reviewed, and approved the article.
Informed Consent: Informed consent was obtained by all participants in this study.
References
- 1.Fujiyoshi K, Konomi T, Yamada M, et al. Diffusion tensor imaging and tractography of the spinal cord: from experimental studies to clinical application. Exp Neurol. 2013;242(4):74-82. [DOI] [PubMed] [Google Scholar]
- 2.Chen J, Zhou C, Zhu L, et al. Identifying the injury in demyelinating cervical spinal cord disease: A diffusion tensor imaging and tractography study. Neurol Asia. 2016;21(1):73-80. [Google Scholar]
- 3.Bhattia V. Diffusion tractography in spinal cord injury: preliminary experience. Pak J Neurol Sci. 2012;7(2):14-6. [Google Scholar]
- 4.Sandler AN, Tator CH. Review of the effect of spinal cord trauma on the vessels and blood flow in the spinal cord. J Neurosurg. 1976;45(6):638-46. [DOI] [PubMed] [Google Scholar]
- 5.Wagner Jr FC, Dohrmann GJ, Bucy PC. Histopathology of transitory traumatic paraplegia in the monkey. J Neurosurg. 1971;35(3):272-6. [DOI] [PubMed] [Google Scholar]
- 6.Hagg T, Oudega M. Degenerative and spontaneous regenerative processes after spinal cord injury. J Neurotrauma. 2006;23(3-4):264-80. [DOI] [PubMed] [Google Scholar]
- 7.Balentine JD. Pathology of experimental spinal cord trauma. Lab Invest. 1978;39(3):236-53. [PubMed] [Google Scholar]
- 8.Mautes AE, Weinzierl MR, Donovan F, et al. Vascular events after spinal cord injury: contribution to secondary pathogenesis. Phys Ther. 2000;80(7):673-87. [PubMed] [Google Scholar]
- 9.Schwartz ED, Hackney DB. Diffusion-weighted MRI and the evaluation of spinal cord axonal integrity following injury and treatment. Exp Neurol. 2003;184(2):570-89. [DOI] [PubMed] [Google Scholar]
- 10.Ellingson BM, Cohen AJ. Diffusion-weighted imaging of the spinal cord. In: Cohen AJ, Wheeler-Kingshott AM, eds. Quantitative MRI of the spinal cord. Elsevier; 2014. p.123-45. [Google Scholar]
- 11.Kirshblum SC, Burns SP, Sorensen FB, et al. International standards for neurological classification of spinal cord injury. J Spinal Cord Med. 2011(6);34:535-46. [DOI] [PMC free article] [PubMed] [Google Scholar]
- 12.Mulcahey MJ, Samdani AF, Gaughan JP, et al. Diagnostic accuracy of diffusion tensor imaging for pediatric cervical spinal cord injury. Spinal Cord. 2013;51(7):532-7. [DOI] [PubMed] [Google Scholar]
- 13.Rao JS, Zhao C, Yang ZY, et al. Diffusion tensor tractography of residual fibers in traumatic spinal cord injury: A pilot study. J Neuroradiol. 2013;40 (3):181-6. [DOI] [PubMed] [Google Scholar]
- 14.D'souza MM, Choudhary A, Pooniaa M, et al. Diffusion tensor MR imaging in spinal cord injury. Injury. 2017;48(4):880-84. [DOI] [PubMed] [Google Scholar]
- 15.Alizadeh M, Intintolo A, Middleton DM, et al. Reduced FOV diffusion tensor MR imaging and fiber tractography of pediatric cervical spinal cord injury. Spinal Cord. 2017;55(3):314-20. [DOI] [PubMed] [Google Scholar]
- 16.Lee S, Lee YH, Chung TS, et al. Accuracy of diffusion tensor imaging for diagnosing cervical spondylotic myelopathy in patients showing spinal cord compression. Korean J Radiol. 2015;16(6):1303-12. [DOI] [PMC free article] [PubMed] [Google Scholar]
- 17.Patel SP, Smith TD, VanRooyen JL, et al. Serial diffusion tensor imaging in vivo predicts long-term functional recovery and histopathology in rats following different severities of spinal cord injury. J Neurotrauma. 2016;33(10):917-28 [DOI] [PMC free article] [PubMed] [Google Scholar]
- 18.Mukherjee P. Diffusion tensor imaging and fiber tractography in acute stroke. Neuroimaging Clin N Am. 2005;15(3):655-65. [DOI] [PubMed] [Google Scholar]
- 19.Ellingson BM, Ulmer JL, Schmit BD. Morphology and morphometry of human chronic spinal cord injury using diffusion tensor imaging and fuzzy logic. Ann Biomed Eng. 2008;36(2):224-36. [DOI] [PubMed] [Google Scholar]
- 20.Li XH, Li JB, He XJ, et al. Timing of diffusion tensor imaging in the acute spinal cord injury of rats. Sci Rep. 2015;5:12639. [DOI] [PMC free article] [PubMed] [Google Scholar]
- 21.Vedantam A, Eckardt G, Wang MC, et al. Clinical correlates of high cervical fractional anisotropy in acute cervical spinal cord injury. World Neurosurg. 2015;83(5):824-8. [DOI] [PubMed] [Google Scholar]
- 22.Czyz M, Tykocki T, Szewczyk P, et al. Application of diffusion tensor imaging in the prognosis of outcome after traumatic cervical spinal cord injury. J Spinal Stud Surg. 2017;1(1):25-8. [Google Scholar]
- 23.Cheran S, Shanmuganathan K, Zhuo J, et al. Correlation of MR diffusion tensor imaging parameters with ASIA motor scores in hemorrhagic and nonhemorrhagic acute spinal cord injury. J Neurotrauma. 2011;28(9):1881-92. [DOI] [PubMed] [Google Scholar]
- 24.Koskinen E, Brander A, Hakulinen U, et al. Assessing the state of chronic spinal cord injury using diffusion tensor imaging. J Neurotrauma. 2013;30(18):1587-95. [DOI] [PubMed] [Google Scholar]
- 25.Cohen Adad J, El Mendili MM, Lehericy S, et al. Demyelination and degeneration in the injured human spinal cord detected with diffusion and magnetization transfer MRI. Neuroimage. 2011;55(3):1024-33. [DOI] [PubMed] [Google Scholar]
- 26.Petersen JA, Wilm BJ, von Meyenburg J, et al. Chronic cervical spinal cord injury: DTI correlates with clinical and electrophysiological measures. J Neurotrauma. 2012;29:1556-66. [DOI] [PubMed] [Google Scholar]
- 27.Shanmuganathan K, Gullapalli RP, Zhuo J, et al. Diffusion tensor imaging in cervical spine trauma. Am J Neuroradiol. 2008;29(4):655-9. [DOI] [PMC free article] [PubMed] [Google Scholar]
- 28.Song T, Chen WJ, Yang B, et al. Diffusion tensor imaging in the cervical spinal cord. Eur Spine J. 2011;20(3):422-8. [DOI] [PMC free article] [PubMed] [Google Scholar]
- 29.Endo T, Suzuki S, Utsunomiya A, et al. Prediction of neurological recovery using apparent diffusion coefficient in cases of incomplete spinal cord injury. Neurosurgery. 2011;68(2):329-36. [DOI] [PubMed] [Google Scholar]
- 30.Nevo U, Hauben E, Yoles E, et al. Diffusion anisotropy MRI for quantitative assessment of recovery in injured rat spinal cord. Mag Res Med. 2001;45(1):1-9. [DOI] [PubMed] [Google Scholar]
- 31.Rajasekaran S, Kanna RM, Karunanithi R, et al. Diffusion tensor tractography demonstration of partially injured spinal cord tracts in a patient with posttraumatic Brown Sequard syndrome. J Magn Reson Imaging. 2010;32(4):978-81. [DOI] [PubMed] [Google Scholar]
- 32.Wang K, Wang WT, Wang J, et al. Compared study of routine magnetic resonance imaging and diffusion tensor tractography on the predictive value of diagnosis and prognosis in acute cervical spinal cord injury. J Acute Dis. 2016;5:328-32. [Google Scholar]
- 33.Li XH, Wu F, Zhao F, et al. Fractional anisotropy is a marker in early-stage spinal cord injury. Brain Res. 2017;1672(10):44-9. [DOI] [PubMed] [Google Scholar]
- 34.Ellingson BM, Kurpad SN, Schmit BD. Functional correlates of diffusion tensor imaging in spinal cord injury. Biomed Sci Instrum. 2008;44(1):28-33. [PubMed] [Google Scholar]
- 35.Yoon H, Kim J, Moon WJ, et al. Characterization of chronic axonal degeneration using diffusion tensor imaging in canine spinal cord injury: a quantitative analysis of diffusion tensor imaging parameters according to histopathological differences. J Neurotrauma. 2017;34:3041-50. [DOI] [PubMed] [Google Scholar]
- 36.Ellingson BM, Ulmer JL, Kurpad SN, et al. Diffusion tensor MR imaging in chronic spinal cord injury. AJNR Am J Neuroradiol. 2008;29(10):1976-82. [DOI] [PMC free article] [PubMed] [Google Scholar]
- 37.Chang Y, Jung TD, Yoo DS, et al. Diffusion tensor imaging and fiber tractography of patients with cervical spinal cord injury. J Neurotrauma. 2010;27(11):2033-40. [DOI] [PubMed] [Google Scholar]
- 38.Martin AR, Aleksandereka I, Cohen-Adadb J, et al. Translating state-of-the-art spinal cord MRI techniques to clinical use: A systematic review of clinical studies utilizing DTI, MT, MWF, MRS, and fMRI. NeuroImage: Clin. 2016;10(12):192-238. [DOI] [PMC free article] [PubMed] [Google Scholar]
- 39.Facon D, Ozanne A, Fillard P, et al. MR diffusion tensor imaging and fiber tracking in spinal cord compression. AJNR Am J Neuroradiol. 2005;26(6):1587-94. [PMC free article] [PubMed] [Google Scholar]
- 40.Assaf Y, Galron R, Shapira I, et al. MRI evidence of white matter damage in a mouse model of Nijmegen breakage syndrome. Exp Neurol. 2008;209(1):181-91. [DOI] [PubMed] [Google Scholar]
- 41.Jeffery ND, Blakemore WF. Locomotor deficits induced by experimental spinal cord demyelination are abolished by spontaneous remyelination. Brain. 1997:120(Pt 1):27-37. [DOI] [PubMed] [Google Scholar]
- 42. Fouad K, Pedersen V, Schwab ME, et al. Cervical sprouting of corticospinal fibers after thoracic spinal cord injury accompanies shifts in evoked motor responses. Curr Biol. 2001;11(22):1766-70. [DOI] [PubMed] [Google Scholar]
- 43.Raineteau O, Schwab ME. Plasticity of motor systems after incomplete spinal cord injury. Nat Rev Neurosci. 2001;2(4):263-73. [DOI] [PubMed] [Google Scholar]


